


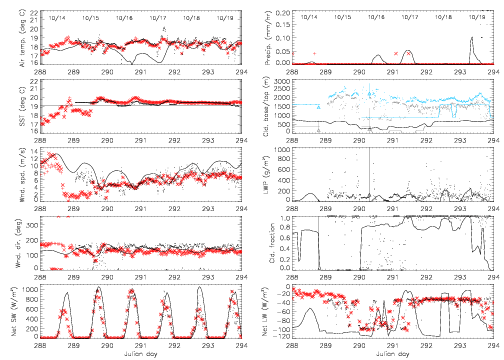
Here, we preliminarily compare observations at the WHOI Stratus buoy at 20S, 85W (red crosses and X's) with CAM3.1 model output (solid line), data from the ship as it passed within 1 deg of the buoy (dots), and from a multi-satellite dataset (co-located CLOUDSAT, CALIPSO, and MODIS data, triangles represent the median values and the vertical lines represent the range of values from overpasses within 1 deg of the buoy) during the pre-VOCA period from Julian day 288 (October 14) to 294 (October 20) of 2006. Shown are air temperature, sea surface temperature, wind speed, wind direction, net shortwave radiation, net longwave radiation, precipitation rate, cloud base (gray) and top (light blue), liquid water path, and cloud fraction. Also shown with the modeled cloud base and top are the model PBL heights (black line). We will do a similar analysis in 2008 using the VOCALS-REx observations when they become available.
Modeled SST, air temperature, wind speed and direction, and shortwave radiation are fairly consistent with observations during this period. However, the model is erroneous in that it rains more often than observed, modeled clouds are generally lower than from ship observations and from CALIPSO, most of the time the model PBL height is within the cloud, and model LWP and cloud fraction are systematically lower than observed. In fact, there is a period of over one day when the model produced no cloud for this location, while the ship observed complete cloud cover during most of this time.
These analyses are funded by the National Science Foundation under Grant #ATM-0745661.