![]()
![]()
![]()
![]()
This page reviews and expands upon what we have already covered. Some of it corresponds to some common weather terminology used by forecasters. The height pattern on a 500 mb upper air map can often be used to estimate the the large scale weather conditions at the surface. The simple analysis presented here does not explain everything that may be going on with the weather, especially at small spatial scales, but is very good at providing a snap shot or picture of the general weather conditions over large areas. It will work best in the wintertime in the middle and high latitude regions of the Earth. Analysis of a 500 mb height map provides a nice way to "see" the large-scale weather pattern over the United States or even the entire Northern Hemisphere in winter. Most often, we will be looking at 500 mb height maps centered over North America. However, you should realize that the 500 mb wave pattern of troughs and ridges extends around the entire Northern Hemisphere, basically encircling the north polar region. These maps can be used to visualize the large scale weather pattern for the middle and high latitude regions of the entire Northern Hemisphere. Two figures are shown below. These figures are shown on a polar projection with the north pole at the center of the map. The left figure is a simple instructional figure of a typical 500 mb height pattern over the Northern Hemisphere with a clearly visible trough and ridge pattern. On the right is an actual northern hemispheric 500 mb height pattern that was forecasted for 12Z on December 25, 2017. This is a 312 hour forecast from the GFS model obtained from Pivotal Weather. This pattern has a very strong ridge centered over the state of Alaska, a deep trough over the western United States, which is centered over Arizona, and another ridge over the eastern United States, which is centered just off the Atlantic coast. While I have little confidence in the accuracy of a 312 hour weather forecast, this pattern would indicate very cold conditions for Arizona (with even a chance for snow in Tucson), warm conditions in the eastern United States, and very warm in Alaska for Christmas day.
 |
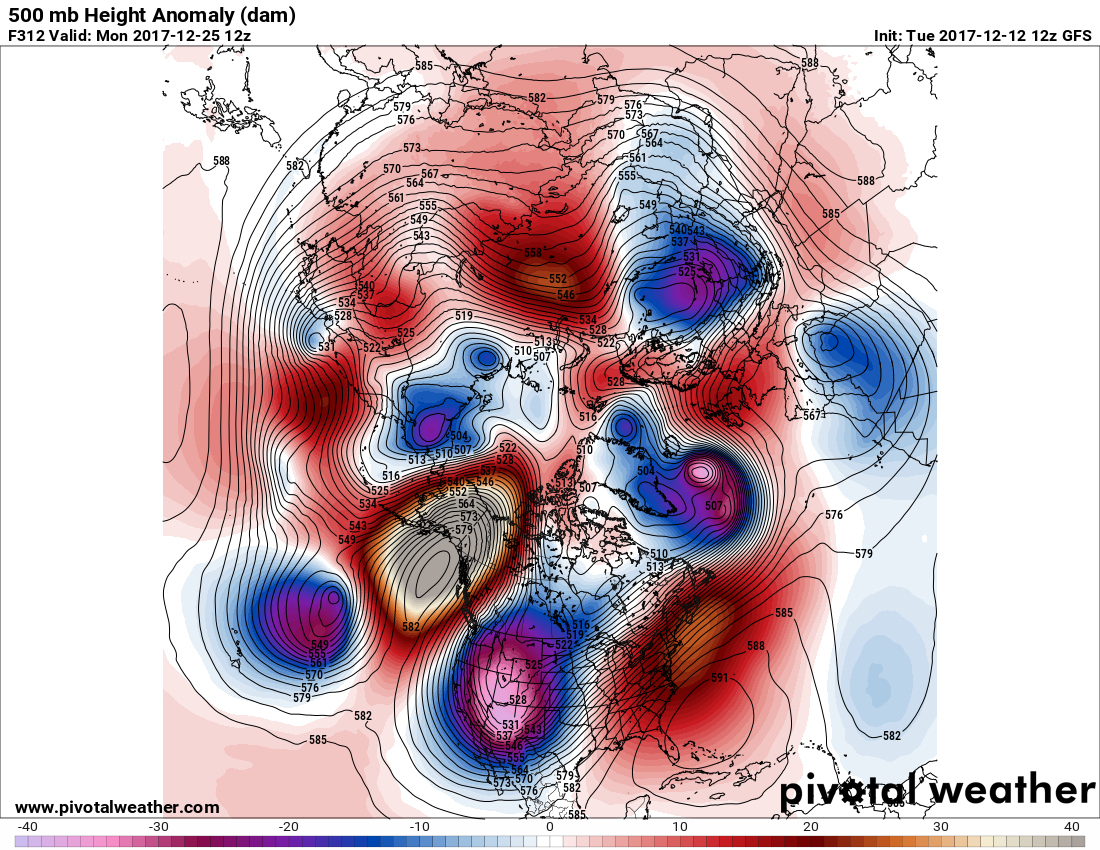 |
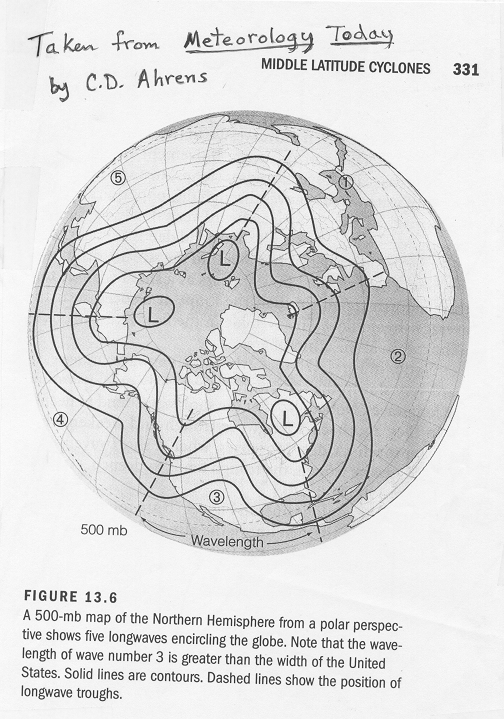
| Instructional picture of a typical 500 mb longwave height pattern around the Northern Hemisphere from the perspective of looking down on the north pole. | 500 mb height anomaly map from Pivotal Weather. This map projection flattens the Earth with the north pole in the center. This map is a 312 hour forecast for December 25, 2017. |
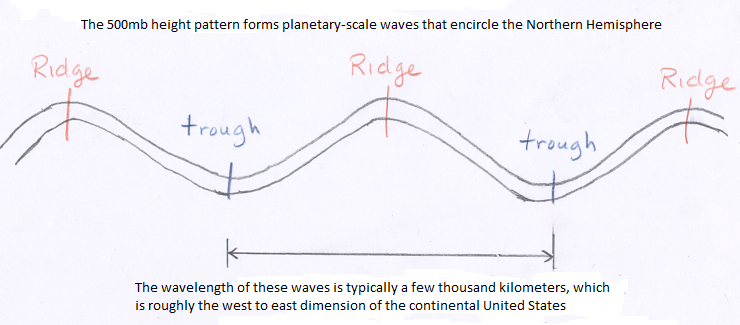
First, recall that the height of the 500 mb surface is related to the (density averaged) temperature of the atmosphere below 500 mb -- the higher the temerature, the higher the height of the 500 mb level. Consider what the 500 mb pattern would look like if temperatures decreased steadily from the equator toward the north pole. In that case the height contours would be concentric circles around the north pole with the highest heights to the south (toward the equator). While this is generally true, the actual pattern at any given time is wavy. See figure 13.6 above. Where the height lines bow northward (a ridge), warm air has moved north; and where the height lines bow southward (a trough), cold air has moved south. Therefore, in general warmer than average temperatures can be expected underneath ridges and colder than average temperatures can be expected underneath troughs. The more pronounced the ridge (or trough), the more above (or below) average the temperatures will be, i.e., the larger the amplitude of a 500 mb wave pattern, the greater the temperature contrast between trough and ridge.
You will notice that the caption for figure 13.6 above refers to the waves in the 500 mb pattern as longwaves. These are the waves that define the large-scale weather pattern There are usually between 3 and 7 longwaves that encircle the Northern Hemisphere at any given time. The sample map above has 5 longwaves, labeled as 1 - 5. The average size or wavelength, which is the distance from one trough to the next as depicted here, of a longwave is a few thousand km or about the width of the United States. This size explains why we often see a pattern where it is warm in the Eastern U.S., but cold in the Western U.S., or vice versa warm in the West and cold in the East, because half of the country is under the ridge of a longwave, while the other half in a trough. The map on the right is an actual forecasted height pattern for December 25, 2017. According to the map on the right, there are at least 4 and perhaps 5 longwave troughs around the Northern Hemisphere. It can sometimes be difficult to make out the entire longwave pattern on maps like this, and you will not be asked to do this on homework or exam questions. You just need to know that the largescale weather pattern around the northern hemisphere generally consists of somewhere between 3 and 7 of these longwaves.
Although we will concentrate on 500 mb maps and forecasts centered over the United States, the evolution of the 500 mb height pattern takes place across the entire Northern Hemisphere. Here is a link to Latest GFS forecast of the 500 mb height pattern and anomaly for the Northern Hemisphere. These forecast movies can be interesting to watch. Troughs and ridges commonly appear to rotate counterclockwise around the north pole, but not always. At the same time, new troughs and ridges form, intensify, and then dissipate.
The 500 mb pattern can also be used to locate where surface storms and precipitation are most likely to be occurring. Surface storms and precipitation are most often found over areas downstream of 500 mb troughs (following the horizontal wind direction from a trough to a ridge). The reason for this is that rising air motion is forced in this part of the flow pattern. Rising motion means that surface air is forced to move upward into the atmosphere. Clouds and precipitation develop where air rises. Thus, we try to use weather maps to pick out areas where air is forced to rise upward, as these are places where precipitation may be occurring. Conversely, sinking air motion is forced over areas downstream of ridges. Clouds do not develop where air is sinking. Underneath these areas fair weather is most likely. By looking at a 500 mb map, you should be able to distinguish where precipitation is most likely and where fair weather is most likely.
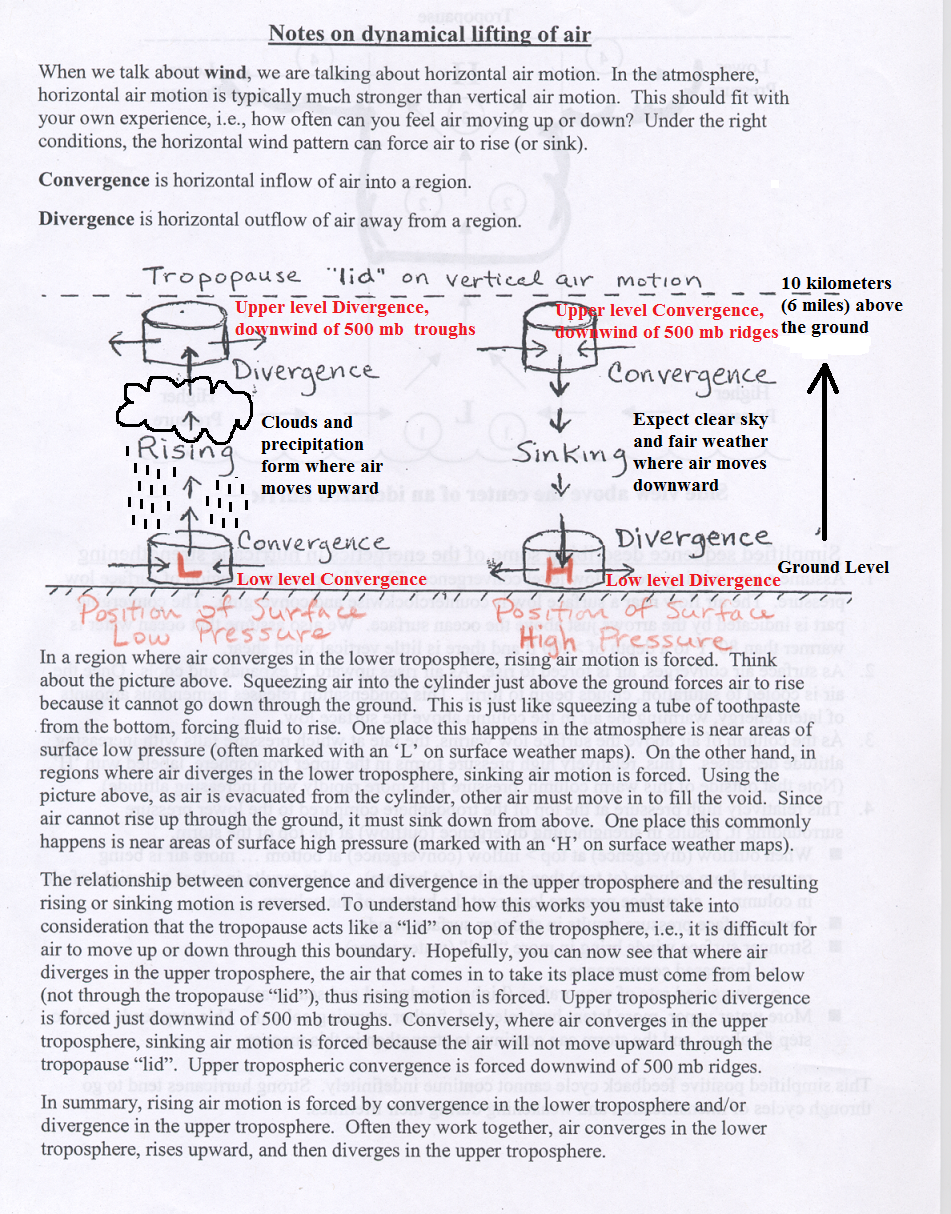
The reason that rising motion occurs just downstream of 500 mb troughs is that in this region divergence of air occurs above the 500 mb height level in the upper troposphere, while just downstream of ridges, sinking motion occurs as a result of convergence of air above the 500 mb height level in the upper troposphere. Divergence occurs when horizontal winds cause a net outflow of air from a region (more air leaving a vertical column of air than entering), while convergence occurs when horizontal winds cause a net inflow of air into a region (more air entering a vertical column than leaving it). Take a look at these Notes on dynamical lifting of air to help you to understand what is meant by divergence and convergence, and why divergence above the 500 mb level in the upper troposphere forces air in a vertical column to rise, while convergence above the 500 mb height level in the upper troposphere forces air in a vertical column to sink. You are not expected to understand why upper level divergence and convergence occur downstream of upper level troughs and ridges respectively, just that it does. You should associate upper level divergence, which occurs downstream of 500 mb troughs, with rising air, clouds, and precipitation. Conversely, you should assoicated upper level convergence, which occurs downstream of 500 mb ridges, with sinking air and fair weather (lack of clouds and precipitation). As shown in the Notes on dynamical lifting of air, the relationship between horizontal divergence/convergence of winds just above the ground surface (at low height levels in the lower troposphere) and rising motion is reversed. This will be discussed further in later lectures along with a review of horizontal convergence and divergence. Typically, where air is rising upward, there will be convergence at low altitudes (below the 500 mb height) and divergence at high altitudes (above the 500 mb height). Conversely, where air is sinking downward, there will be divergence at low altitudes (below the 500 mb height) and convergence at high altitudes (above the 500 mb height). These concepts are also shown in the figure below. This is important since clouds and precipitation happen where air is moving upward with generally cloud-free conditions expected where air is moving downward.
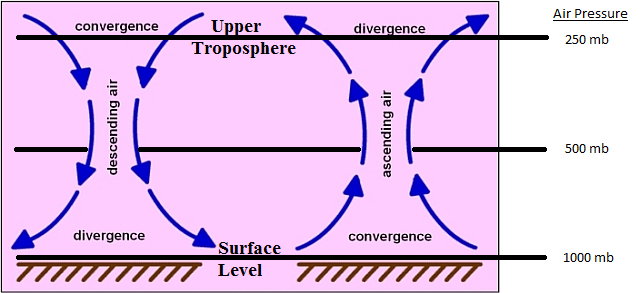 |
Relationship between horizontal covergence and divergence and vertical air motion.
|
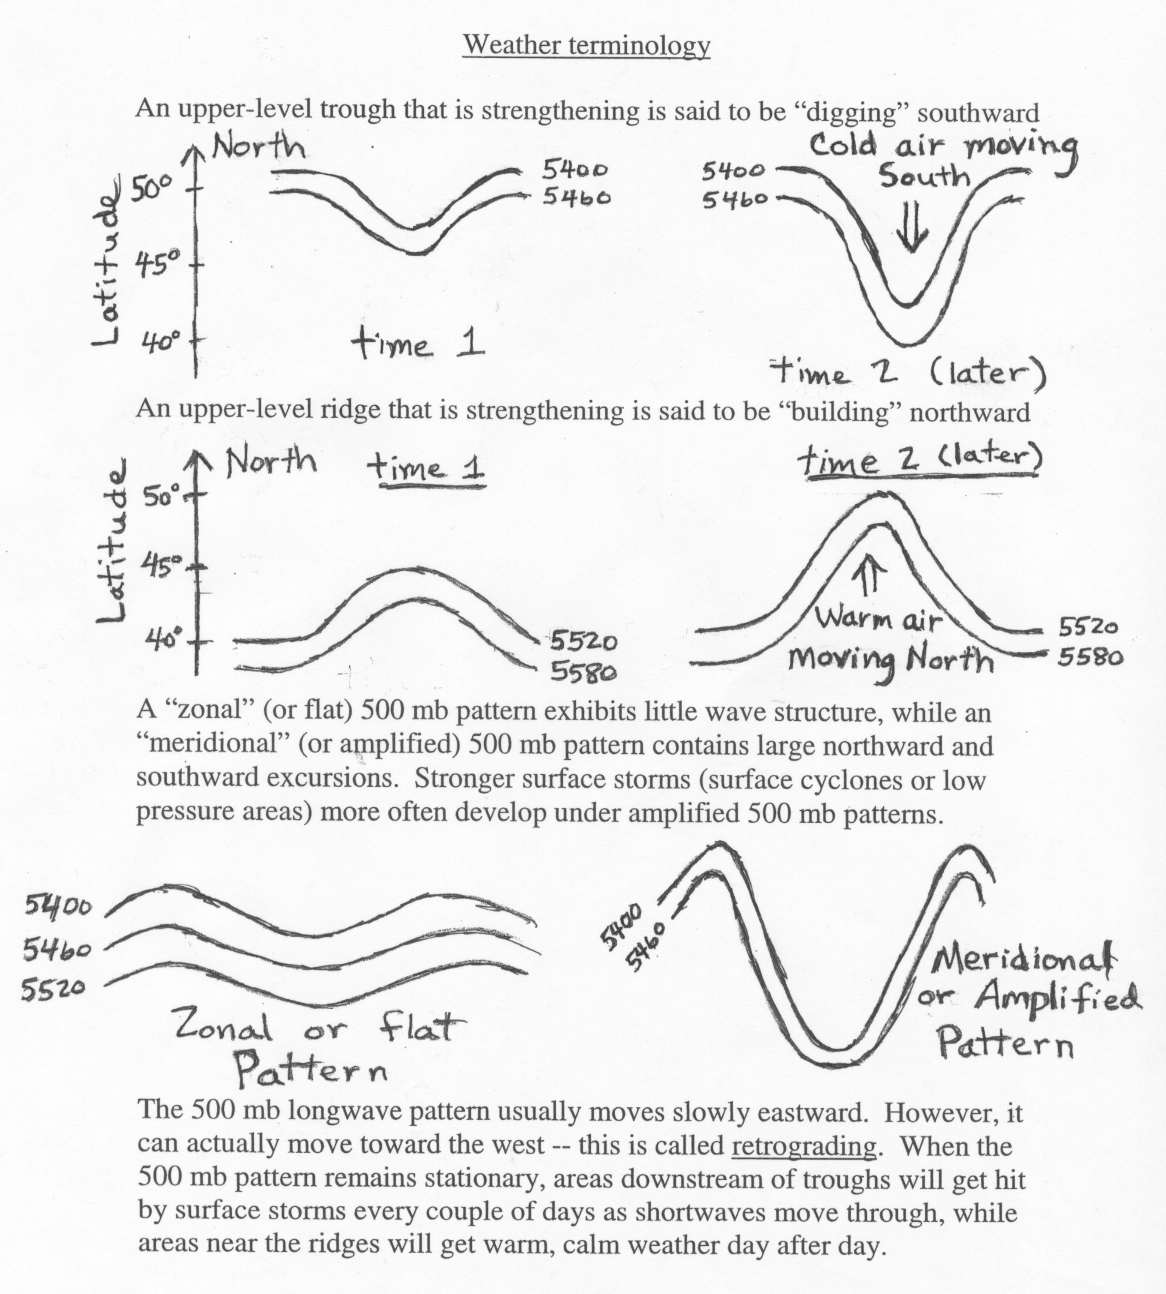
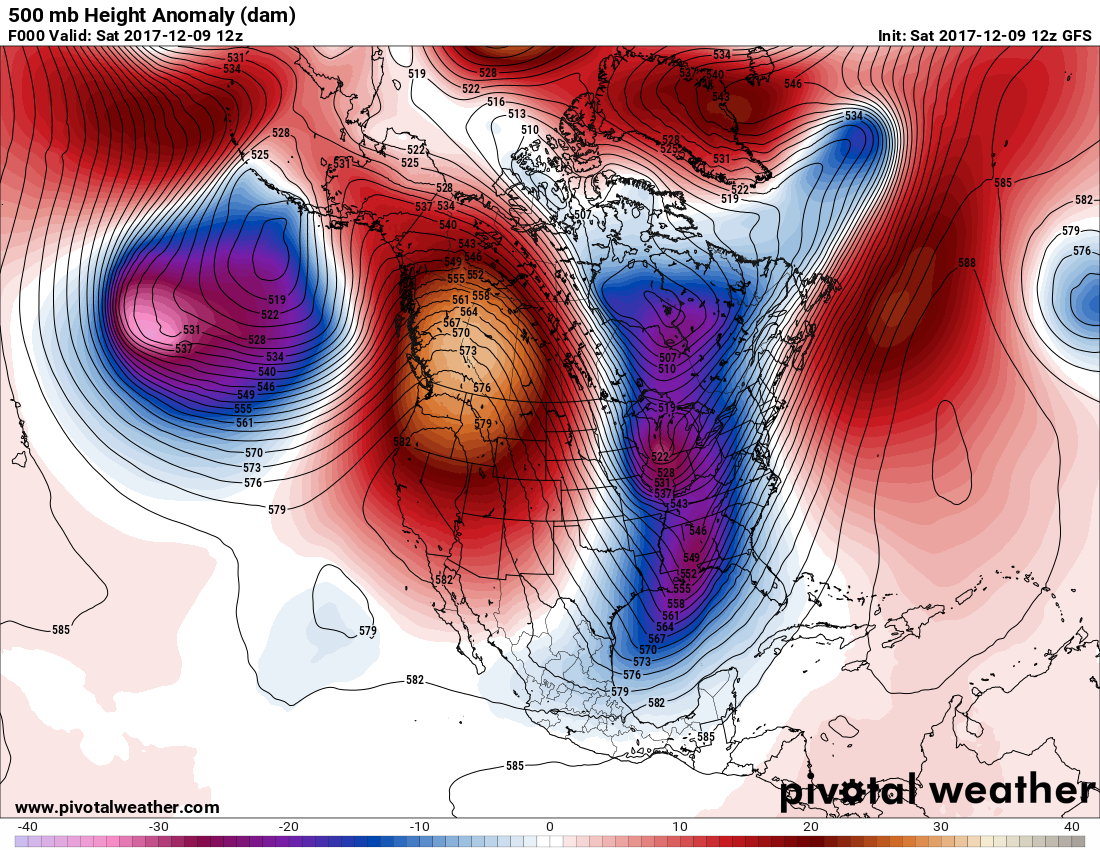
Because the 500 mb pattern is often a good indicator of what is going on at the surface, much common weather terminology has arisen to describe it. Some of this terminology is depicted on the figure below. For exams, you should know the weather terminology mentioned in this and the following paragraph. If a forecaster says that an upper level trough will be "digging" into the local area, it means a trough is expected to move into your area. You can expect that it will get colder with time and that precipitation may occur just beyond the trough. Typically as a trough "digs," the base of the trough pushes toward the south. This amplifies the 500 mb wave pattern (the trough/ridge wave pattern). Digging troughs often indicate a strengthening or developing storm system. Here is a good example of a trough digging toward the southwestern United States. A "building ridge" is just the opposite of a digging trough. Typically as a ridge builds, the apex of the ridge pushes north. It is also common for a building ridge to expand in size along its eastern and western flanks. If a forecaster says that an upper level ridge is building into the local area, you can expect that it will get warmer with time and precipitation is unlikely.
In a "zonal" 500 mb height pattern, the waves that form the trough/ridge pattern have small amplitude. The 500 mb height lines generally run west to east, along lines of latitude. Since the 500 mb winds are parallel to the height contours, the 500 mb winds are west to east. West to east motion is called zonal motion, thus a forecaster may say the flow is "zonal." If a forecaster says the US is under a zonal pattern, it generally means that near average temperatures are found everywhere and that strong areas of precipitation are unlikely. In a "meridional" or "amplified" 500 mb height pattern, the waves that form the trough/ridge pattern have high amplitude. The 500 mb height lines trace out these high amplitude waves with large ridges that extend far to the north followed by deep troughs that extend far to the south. In this case, much of the 500 mb wind flow will be along a north to south direction. Movement along a north to south line is called "meridional," and a forecaster may say the flow is "meridional." If a forecaster says the pattern over the US is amplified (or meridional), then more extreme weather is expected, i.e., very cold under deep troughs, very warm under large ridges, with strong areas of precipitation possible just beyond the positions of troughs in the region where the upper level divergence takes place. Here is an example of an amplified (or meridional) 500 mb pattern over the United States and here is an example of a zonal (or flat) 500 mb pattern over the United States.
 |
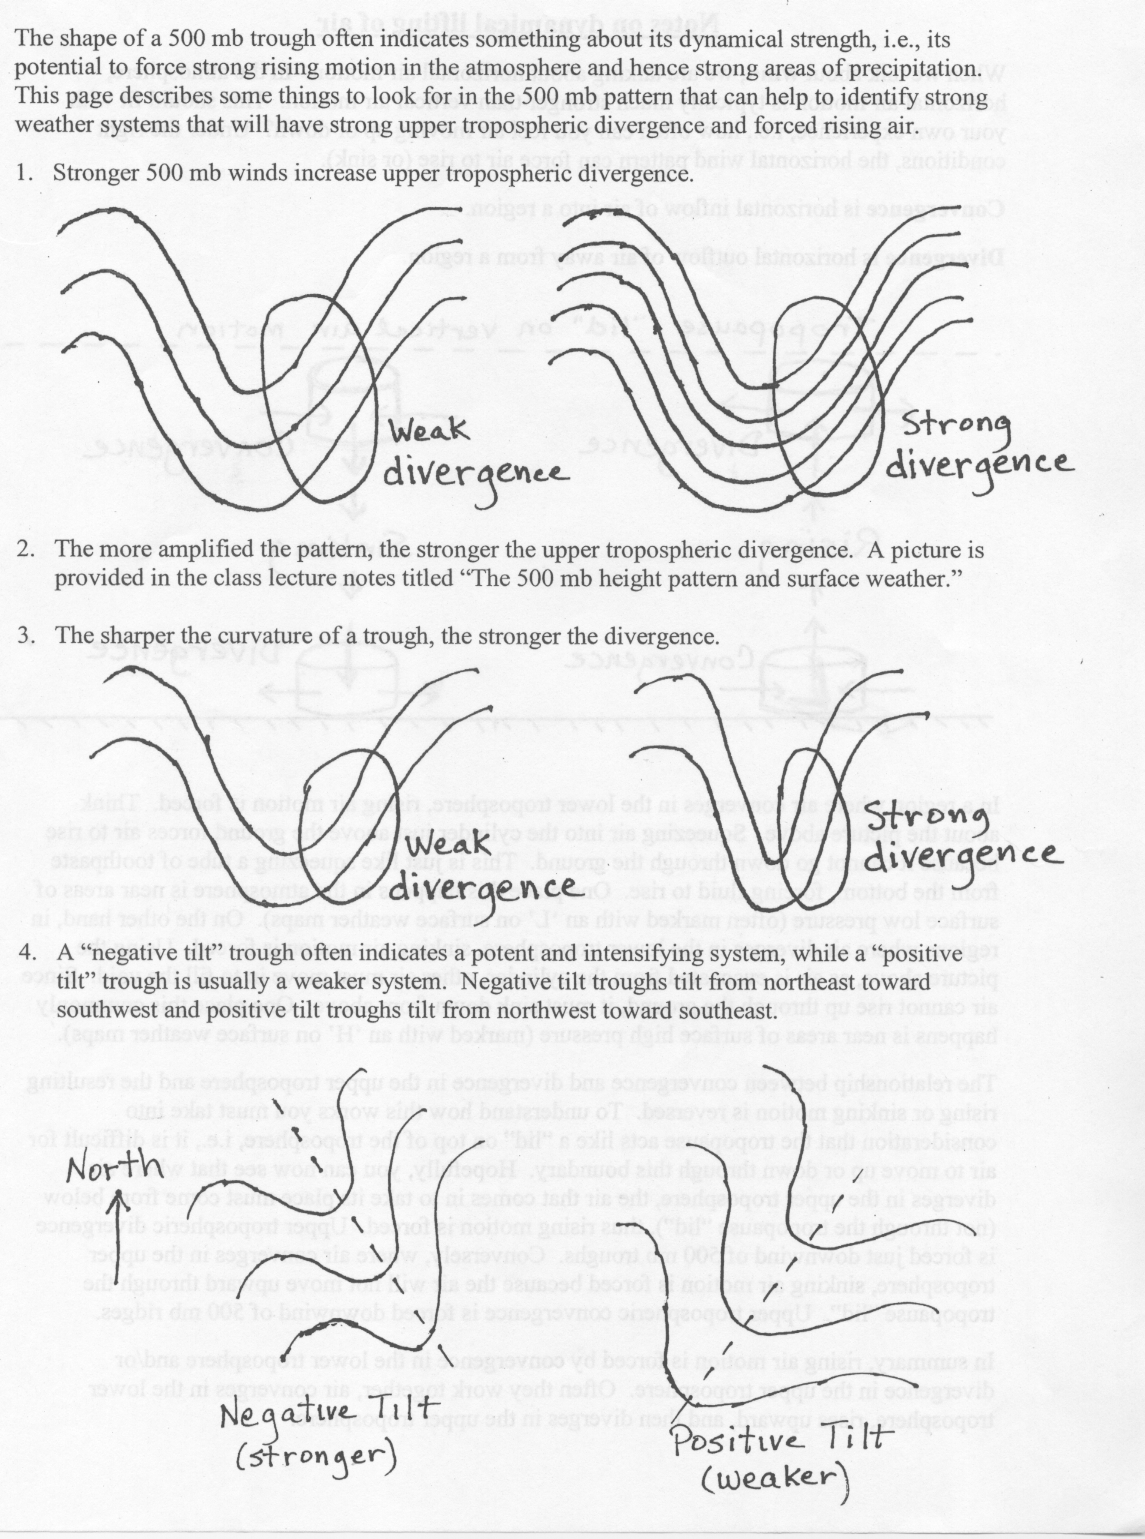
A few additional comments concerning the shape and strength of troughs will be given here. The information in this paragraph will not be on exams, though there may be homework questions taken from it. The amount of precipitation that occurs with a winter-type storm depends on two main factors: atmospheric dynamics (how strongly air is forced to rise) and the availability of water vapor. Keep in mind that if the air does not contain sufficient water vapor, then no matter how forcefully it rises, clouds and precipitation will not form. On the other hand, if the air contains a lot of water vapor, then it does not take much lifting before clouds and precipitation will form. The stronger the divergence of air in the upper troposphere, the stronger air is forced to rise. The shape of a 500 mb trough often indicates something about its dynamical strength, i.e., its potential to force strong rising motion in the atmosphere and hence strong areas of precipitation. Below is a list of several things to look for in 500 mb pattern that act to increase divergence and hence rising motion. Link to Hand-drawn pictures for the items in the list.
The atmosphere contains waves over a large range of sizes from the planetary-scale longwaves described above to minute sound waves that have no impact on weather. However, there are often smaller wiggles or waves that are superimposed on the longwave pattern that do have a significant impact on weather. These are called shortwaves(see figure below). There are shortwave troughs and shortwave ridges. These indicate smaller regions of warm/cold temperature contrasts and forced rising or sinking vertical air motions. Because they are much smaller than longwaves, shortwave troughs often have a much sharper curvature than longwaves and hence stronger divergence and forced rising motion. Thus, shortwaves can indicate the position of a strong weather system especially if it is sharply curved. Shortwaves typically flow through the longwave pattern following the longwave wind direction but at a slower speed. (As a rule of thumb, shortwaves move along at about one-half the speed of the 500 mb winds). Shortwaves tend to strengthen as they move into the region just downstream of a longwave trough and weaken as they move into the region just downstream of a longwave ridge.
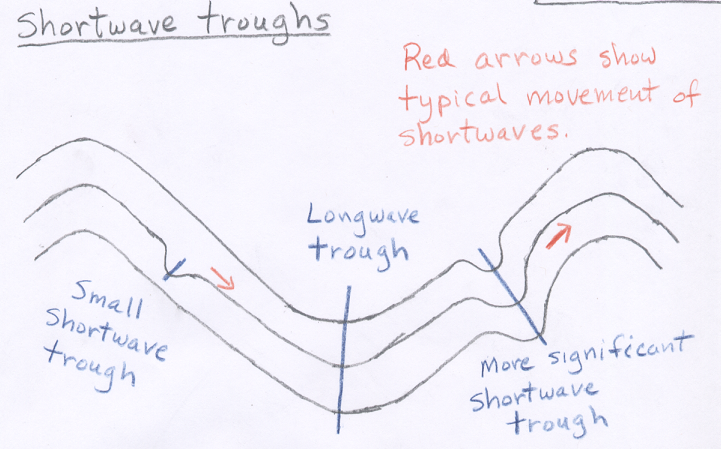 |
If you compare 500 mb maps with where precipitation is falling, you will see that it generally is not raining (or snowing) everywhere downwind of troughs. Often the precipitation gets concentrated near a shortwave trough, then moves along with the shortwave. You may also notice small areas of precipitation just downwind of longwave ridges (where you didn't expect to see it). This again can be associated with a shortwave trough. Weather forecasters sometimes refer to shortwave troughs as "pieces of energy" or "little disturbances in the flow". This terminology arises from the fact that shortwave troughs force small areas of horizontal divergence and forced rising motion and often bring periods of precipitation. It is common for a region downwind of a longwave trough to have occasional periods of precipitation as shortwaves ripple though the longwave pattern, rather than continuous precipitation.
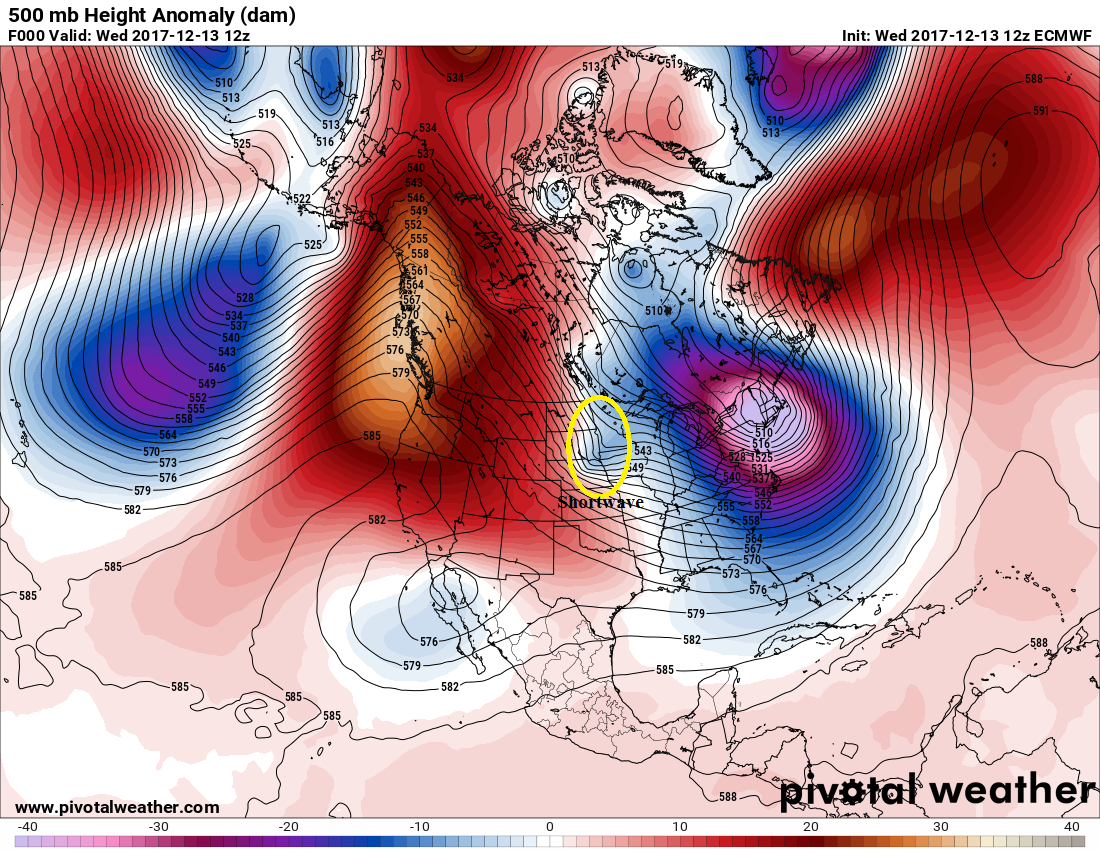
Shortwaves come in a wide range of sizes and shapes. If a shortwave is large enough, you can easily locate it on a 500 mb height map by looking for wiggles (wavelike features) in the height pattern that are smaller than the longwaves. Here is a 500 mb height anomaly map with a marked shortwave. On that map the shortwave over the center of the United States is between a longwave ridge to the west and a longwave trough to the east. Some shortwaves are so small that they are difficult to see on 500 mb height maps, though their influence can be seen when they cause small areas of clouds or rain.
Although we often think of the 500 mb pattern as being composed of troughs and ridges, it is fairly common to see closed lows (and closed highs) in the 500 mb height pattern. A closed low on a 500 mb map is a region surrounded by one or more circular height contours (with the lowest heights found in the middle). The air flows in a counterclockwise rotation around the closed low. The closed low indicates a pool of cooler air surrounded by warmer air. Three closed lows are shown in figure 13.6 near the top of this page.
When a closed low becomes completely detached from the main westerly wind currents at 500 mb, it is called a cutoff low because it is cutoff from the main steering winds. A good example of a cutoff low centered just south of San Diego is shown on this map from fall 2005 (sample 500 mb map containing a cutoff low). Another cutoff low in the Pacific off Baja, Mexico is found on the map used above as an example of a zonal pattern (500 mb height anomlay map with cuttoff low). Notice the cutoff low is not connected to the main zonal westerly wind flow that is taking place across the northern part of the United States. Cutoff lows may remain detached from the westerlies for days while exhibiting very little forward (eastward) progress. In some instances, a cutoff low may move to the west, or retrograde, opposite to the prevailing flow. It is sometimes difficult for weather models to predict the movement and evolution of cutoff lows. Often they move very little and over a period of several days eventually weaken and dissipate. For reasons that I do not understand, the extreme southwestern United States including the coastal Pacific waters off southern California, is a region where closed and cutoff lows are relatively common. These features can produce significant rain and high elevation snow in Arizona when positioned properly, which is one reason for including this discussion.
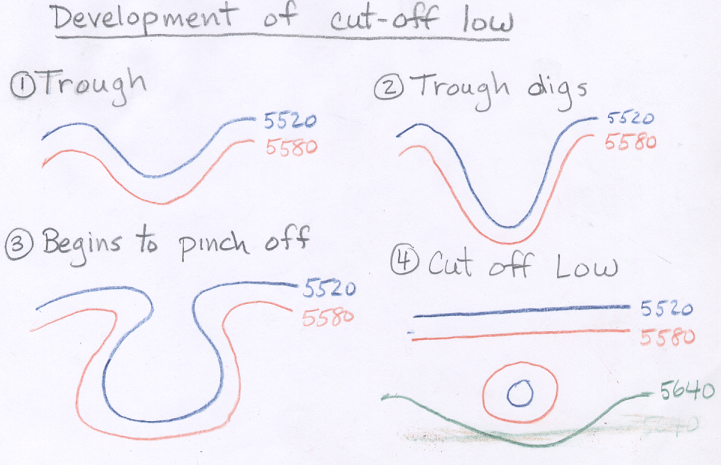 |
Cutoff lows often form when a 500 mb trough "pinches off" as shown in the sequence of figures above. As the cutoff low pinches off, the clouds and precipitation found downstream of the 500 mb trough can be wrapped around low by the counterclockwise winds. Thus, when cutoff lows sit over a given region, they often bring a prolonged period of cool, cloudy weather with intervals of rain or snow as shortwave "disturbances" rotate around the closed low.
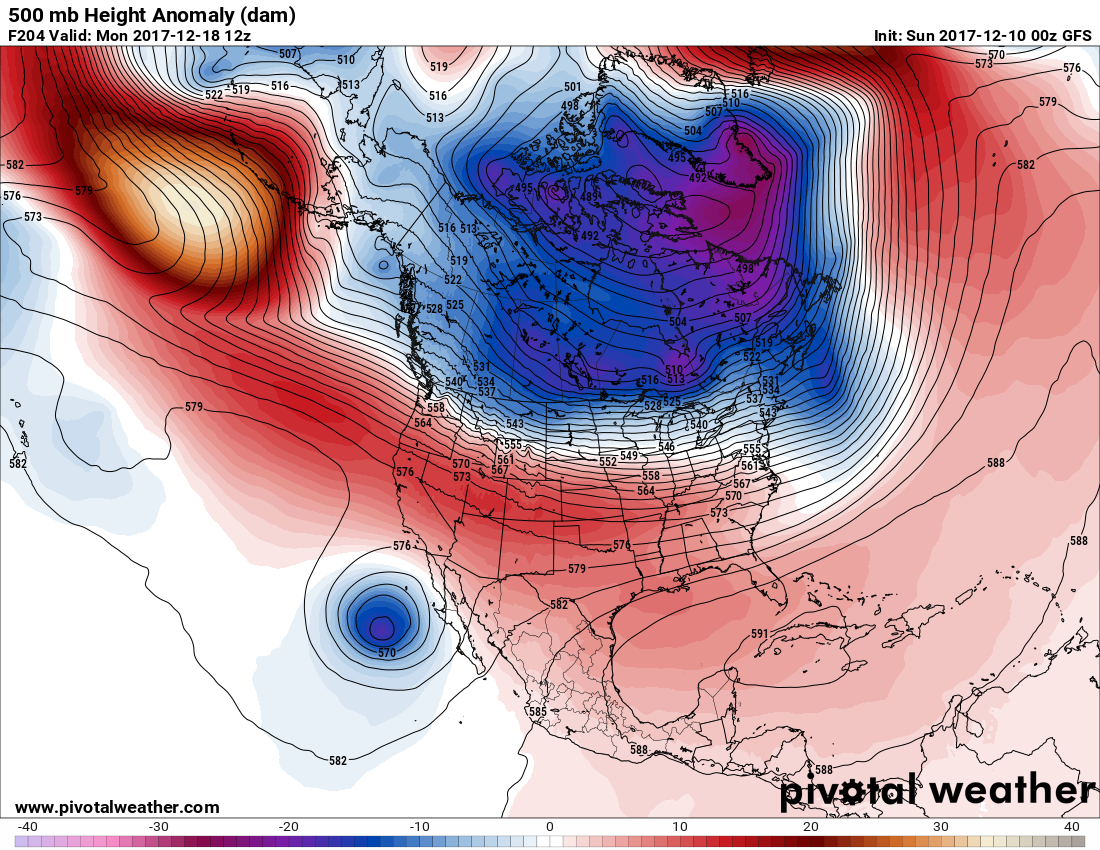
More often, closed lows do not become cutoff. As a trough digs, it is fairly common for a closed low to pinch off as shown above. The closed low remains associated with the trough and moves away with the trough, rather than remaining stationary as cutoff lows often do. Here again is the example of a trough digging toward the southwestern United States. Notice that this trough forms a closed low as it strengthens.
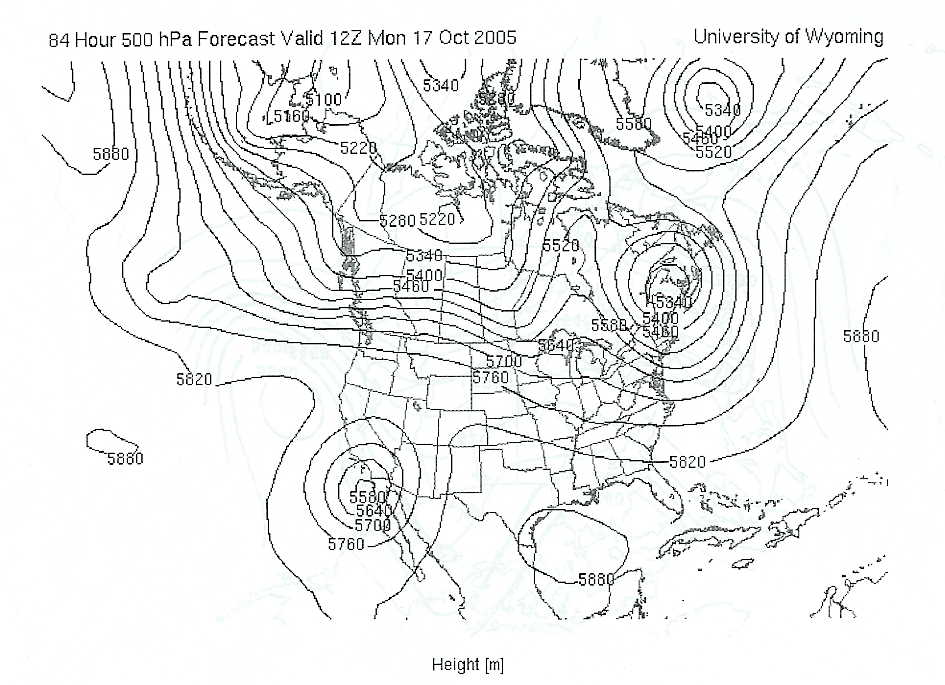
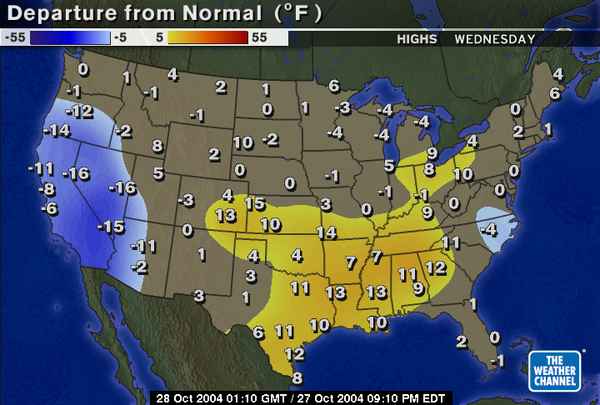
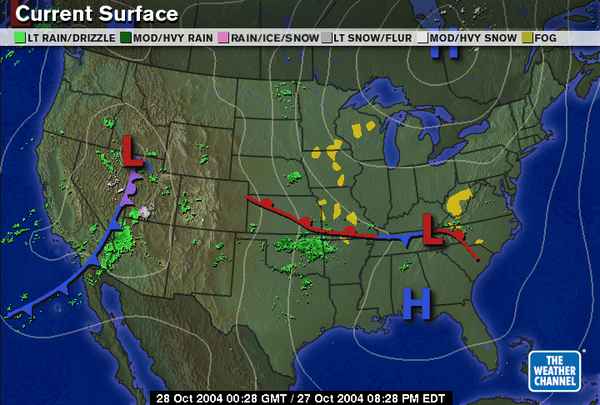
The first linked map below shows the 500 mb height pattern for 00Z Thursday, October 28, 2004. The two linked maps below that show the corresponding temperature relative to average for Wednesday, October 27 and the precipatation at 28 minutes past 00Z. Notice the relatively low temperature and precipitation near the trough and closed low in the western US and the relatively high temperatures near the ridge in the center of the country. The area of precipitation in Oklahoma would be difficult to predict just based on the 500 mb height pattern.
500 mb map for 00Z, Thursday, October 28, 2004
High temperatures relative to average for Wednesday, October 27, 2004
Weather conditions at 00:28Z, Thursday, October 28, 2004
![]()
![]()
![]()
![]()