![]()
![]()
![]()
![]()
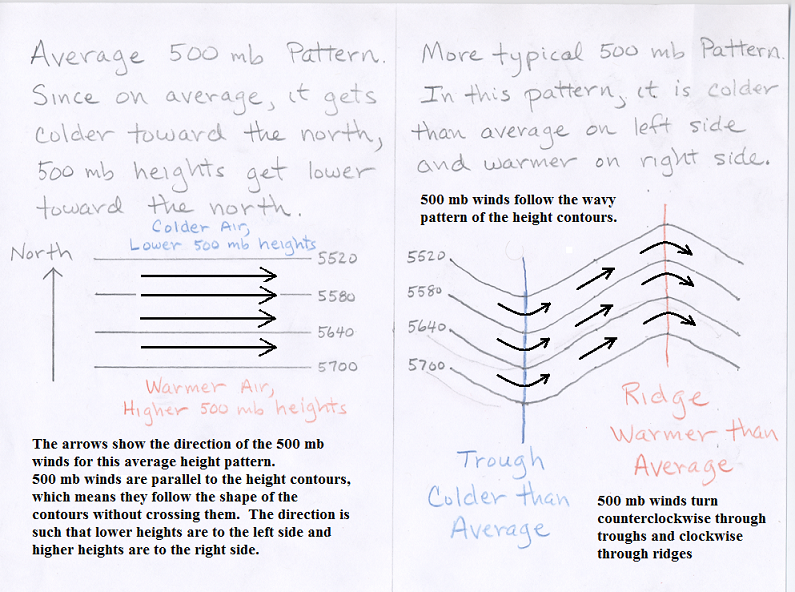
The wind at 500 mb can be estimated from the height pattern. The wind blows parallel to the height contours with lower heights to the left of the wind direction. In other words, the wind at the 500 mb height level moves along the pattern of the height contours, without crossing them, such that lower 500 mb heights are toward the left of the wind direction and higher 500 mb heights are toward the right of the wind direction. Wind direction has been added to the figure below, which was linked on the previous reading page.
|
| Arrows show the trajectory of the 500 mb wind for a flat 500 mb height pattern on the left and a wavy 500 mb pattern on the right. |
Because the air temperature across the United States generally decreases in value as you move from south to north, the 500 mb height generally decreases as you move from south to north as shown in the figure above. This means that the 500 mb winds over the United States generally move from west to east, though the winds follow the wavy patterns that are commonly observed in the 500 mb height field. Keep in mind that this is the wind at the altitude where the air pressure is 500 mb, which is several thousand meters above the Earth's surface, and not the wind that would be felt on the ground.
In addition to the wind direction, the relative speed of the 500 mb winds can be inferred from the 500 mb height pattern. The wind speed is faster where the height lines are closer together, and slower where the height contours are spaced further apart. If this helps, you can think of the 500 mb height lines as channels through which the air moves. The wind follows the wavy pattern of the contour lines, and gets squeezed together where the lines get closer together, resulting in faster winds. This is just how water would flow in a hypothetical channel.
Two example maps are displayed below. The 500 mb height pattern is shown with labeled height contours. Arrows have been drawn to indicate the wind trajectories at selected locations on the maps. The color shading on these maps represents the wind speed at 500 mb as determined by the weather model. The important thing to note is that 500 mb wind speeds are highest where the contour lines are most closely spaced, while the 500 mb winds are slow where the contour lines are spaced further apart. See the color key for wind speeds below the maps. Areas with weak 500 mb wind speeds (less than 20 knots) are displayed in white. Notice that the height contours are spaced far apart in these areas. Again, the stronger winds happen where the height contour lines are spaced closer together. You are not expected to be able to determine actual wind speeds, just to point out areas where the winds are relatively strong and places where the winds are relatively weak. The contour interval on these maps is 6 decameters, rather than the 3 decameter intervals that were shown on the height anomaly maps.
 Map of the 500 mb height pattern for December 9, 2017 at 12Z. 500 mb wind trajectories are shown at various locations using
bold arrows. The color shading indicates the 500 mb wind speed in knots (nautical miles per hour) with color key at
the bottom. This is an example of a highly amplified 500 mb height pattern over the continental United States. The wave pattern
has a large amplitude (north to south distance from the wave ridge in the west to the wave trough in the east) with a high
ridge followed by a deep trough. In an amplified pattern the 500 mb winds have a lot of northward and southward movement on top
of the general west to east motion.
Click on the image
above to open a larger version.
Map of the 500 mb height pattern for December 9, 2017 at 12Z. 500 mb wind trajectories are shown at various locations using
bold arrows. The color shading indicates the 500 mb wind speed in knots (nautical miles per hour) with color key at
the bottom. This is an example of a highly amplified 500 mb height pattern over the continental United States. The wave pattern
has a large amplitude (north to south distance from the wave ridge in the west to the wave trough in the east) with a high
ridge followed by a deep trough. In an amplified pattern the 500 mb winds have a lot of northward and southward movement on top
of the general west to east motion.
Click on the image
above to open a larger version.
|
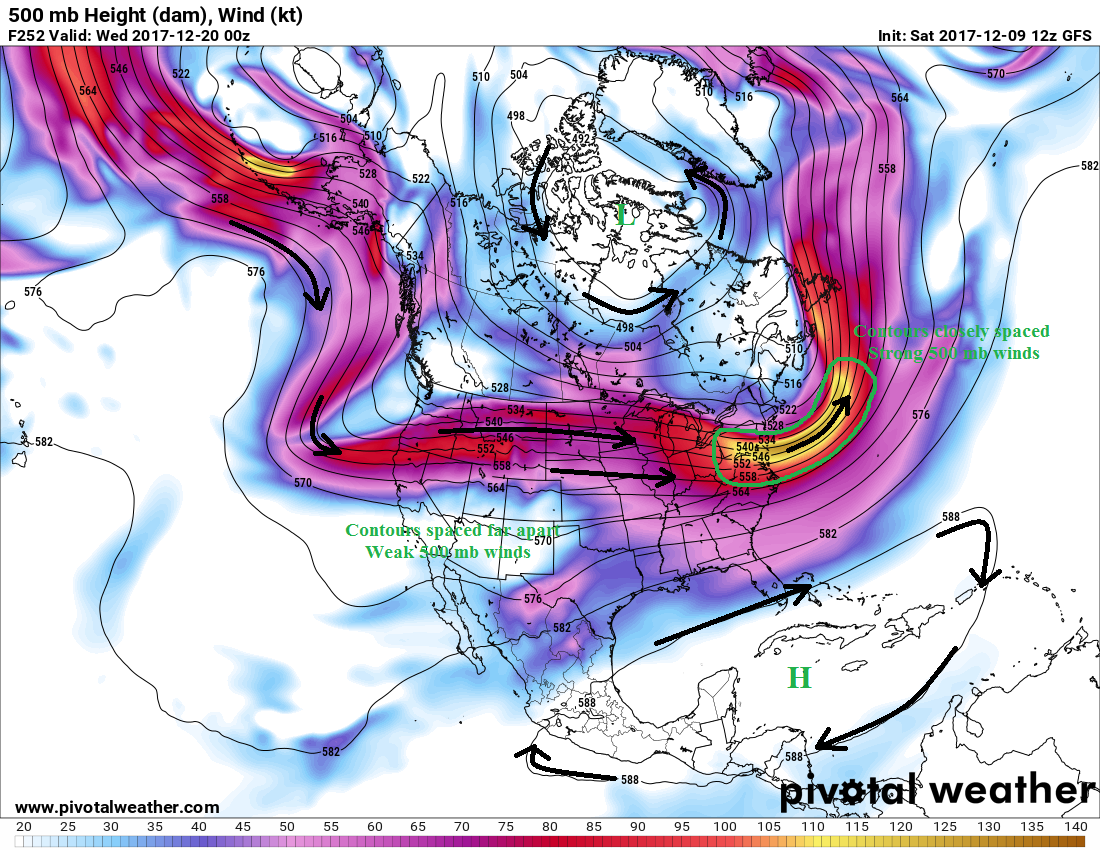 Map of the 500 mb height pattern forecasted for December 20, 2017 at 00Z. 500 mb wind trajectories are shown at various locations using
bold arrows. The color shading indicates the 500 mb wind speed in knots (nautical miles per hour) with color key at
the bottom. This is an example of a zonal or flat 500 mb height pattern over the continental United States. The wave pattern has
a small amplitude with a very flat ridge extending across the northern half of the United States. In a zonal pattern, the 500 mb winds
move almost directly from west to east. Click on the image
above to open a larger version.
Map of the 500 mb height pattern forecasted for December 20, 2017 at 00Z. 500 mb wind trajectories are shown at various locations using
bold arrows. The color shading indicates the 500 mb wind speed in knots (nautical miles per hour) with color key at
the bottom. This is an example of a zonal or flat 500 mb height pattern over the continental United States. The wave pattern has
a small amplitude with a very flat ridge extending across the northern half of the United States. In a zonal pattern, the 500 mb winds
move almost directly from west to east. Click on the image
above to open a larger version.
|
The wind trajectory arrows shown on the maps above are parallel to the height contours and point in the direction such that lower 500 mb heights are to the left and higher 500 mb heights are to the right. Each map has one labeled closed high and one labeled closed low. Following the rules for 500 mb wind direction, the 500 mb air flow around closed highs turns clockwise, just as for ridges, and the 500 mb air flow around closed lows is counterclockwise, just as for troughs.
The pattern of wind flow is the perferable way to identify troughs and ridges on 500 mb height maps. In general troughs and ridges do not have to be oriented along a north-south axis. The best way to identify troughs and ridges is to visualize the 2-Dimensional wind trajectory based on the 500 mb height pattern. The wind trajectory traces the motion of air. With troughs (and closed lows) the air flow makes a counterclockwise turn and with ridges (and closed highs) the air flow makes a clockwise turn in the Northern Hemisphere. We are only going to discuss weather maps for the Northern Hemisphere and will not confuse the situation by covering differences between the Northern and Southern Hemisphere. In looking at these maps, you may notice that troughs and ridges come in a wide range of sizes. Some are quite small and may appear as a small wiggle along one of the contour lines, while others can include many contour lines and be almost as large as the entire continental United States. For this class you will only be expected to identify large and easy-to-find troughs and ridges.
The 500 mb winds have a large influence on the motion of smaller-scale weather features, such as the movement of surface low pressure areas (which can be the ground location of "winter storms"), the movement of hurricanes, and the movement of individual thunderstorm cells. In this context, smaller-scale means small compared to the size of the larger scale trough and ridge pattern. For these reasons, the winds at the altitude of the 500 mb pressure level are often referred to as the "steering level" winds. In fact where thunderstorms do form, they generally move as a unit in the direction of the winds near the 500 mb pressure level. This is something that we will pay attention to when local (Tucson, AZ) thunderstorms form. Note that we have only covered how to interpret the 500 mb winds based on the height pattern. We have not discussed the forces that cause the wind to blow.
A visualization of the relationship between the 500 mb height pattern and the winds at high alitudes can often be seen by looking at a movie of the 500 mb height pattern superimposed over a satellite image that is sensitive to the motions of clouds and water vapor at high altitudes. The weather data available from the UA Department of Atmospheric Sciences produces a movie showing the evolutions of the 500 mb height pattern over the last 24 hours (one frame per hour) superimposed on what is known as a satellite "water vapor image." The water vapor image is able to "see" or "sense" the presence of clouds and relatively high water vapor concentrations at high altitudes. Although, it is most sensitive to clouds and water vapor at altitudes higher than the 500 mb height (lower air pressure), the winds at those altitudes are often similar to those at 500 mb. When you look at the loop, notice that the features in the water vapor image generally move parallel to the 500 mb height pattern with lower heights to the left of the wind direction. It can be a bit tricky because the 500 mb height pattern is changing with time along with the winds. Link to 500 mb movie for the last 24 hours
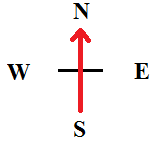
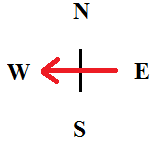
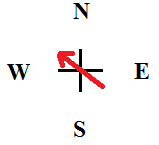
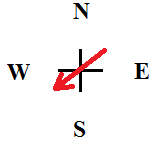
In meteorology, the wind direction is specified as the direction from which the wind is coming, not the direction toward which it is heading. For example, a west wind moves from west toward east. We will often draw arrows on maps showing the 500 mb wind direction. A few examples are shown below.
| 
| 
| 
|
| A south wind (south toward north) | An east wind (east toward west) | A southeast wind (southeast to northwest) | A northeast wind (northeast to southwest) |
Clouds and precipitation are most likely to be occurring just downwind (or downstream) from the location of 500 mb troughs. Following the 500 mb wind flow, this is the region just after the wind has gone through the trough and starts heading toward the next ridge (see example map below). The reason for this is that rising air motion is forced in this part of the flow pattern. Rising motion means that air moves vertically upward. At this point, you are only expected to be able to identify regions favored for rising air motion based on the 500 mb height pattern, not to understand or be able to explain why rising motion happens in those regions. Clouds and precipitation will develop where air rises (as long as there is sufficient water vapor). Conversely, sinking air motion is forced over areas downstream of ridges. Clouds do not develop where air is sinking, or moving vertically downward. Fair weather is most likely in these areas. By looking at the height patterns on a 500 mb map, you should be able to distinguish where clouds and precipitation are most likely and where fair weather is most likely.
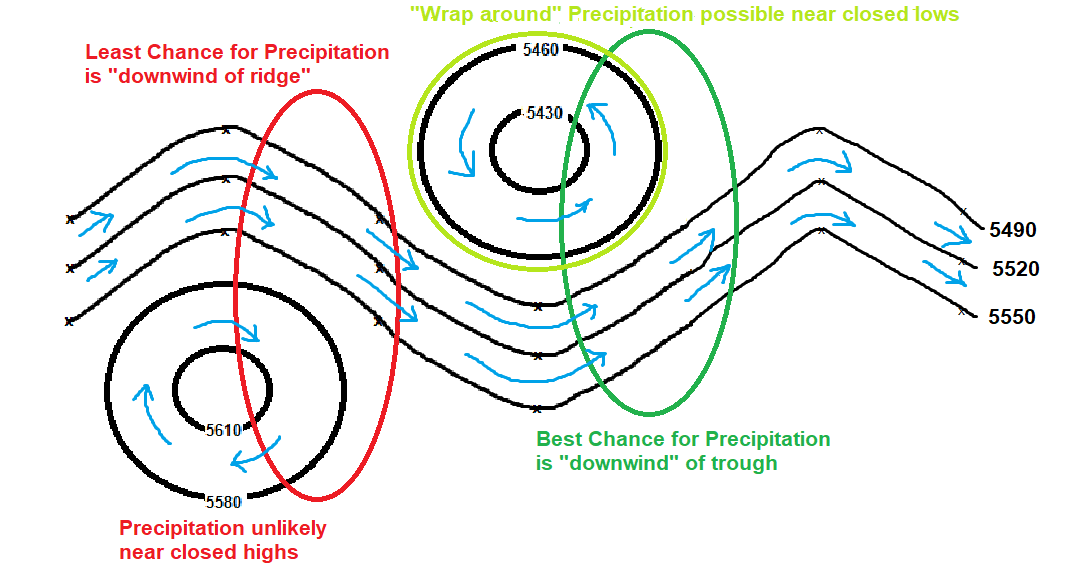
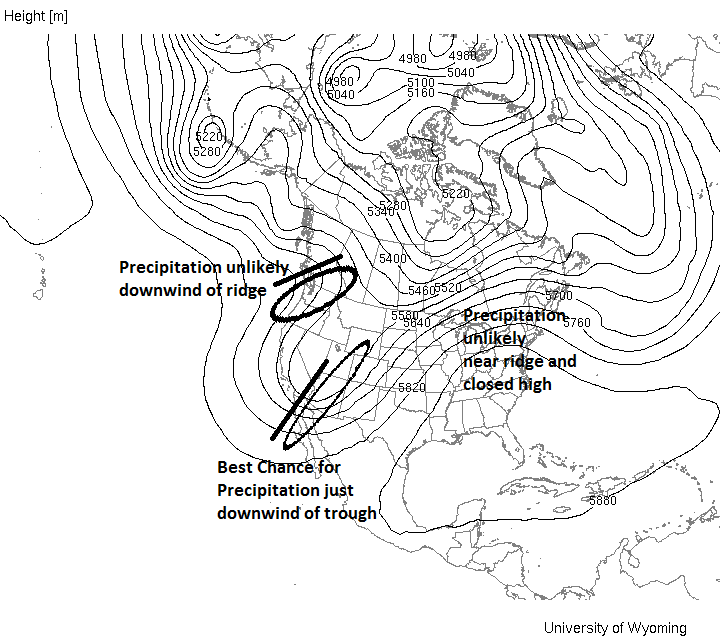
Combining the precipitation guideline in the last paragraph with the definition of a troughs and closed lows given in the section above, consider the following more general statement: Northern Hemisphere 500 mb troughs can be identified as regions where the air flow makes a counterclockwise turn. Where the 500 mb air flow transitions from a counterclockwise curve to a straighter (less curved) flow (typically just after the air has gone through a trough), is the region where rising air motion happens, which favors the development of clouds and precipitation. Note that the 500 mb air flow is counterclockwise around closed lows. Thus, it is common for there to be areas of precipitation that "wrap around" the counterclockwise circulation associated with closed lows. While the major regions of precipitation are most often found just beyond 500 mb troughs, it is fairly common for some precipitation to be happening underneath and around closed 500 mb lows. An idealized diagram is shown below.
|
| Idealized wavy 500 mb height pattern with a closed high and a closed low. 500 mb height contours are labeled in black. Blue arrows show the trajectory of the 500 mb wind. Dark green oval outlines the most likely region for precipitation is downwind of a trough. The light green oval outlines a weaker region of "wrap around" precipitation that is commonly found near closed lows. The red oval outlines the least likely region for precipition is downwind of a ridge. Precipitaiton is also unlikely near closed highs. |
The 500 mb height map for 12Z, December 9, 2017 is shown again below on the left, but this time highlighting regions that are favorable and unfavorable for precipitation. The best chance for precipitation occurs just downwind from the center of the large 500 mb trough in the eastern United States. The least favorable region for precipitation is the area just downwind of the large 500 mb ridge and closed high over the western United States. Below on the right is the 500 mb height map for 12Z, September 25, 2017. The best chance for precipitation occurs just downwind from the center of the 500 mb trough that runs through Arizona. Another area of potential precipitation occurs near the closed low centered over the state of Wyoming. Meteorogists often call this "wrap-around" precipitation since areas of precipitation are observed to move counterclockwise around closed lows. The areas least favorable for precipitation are marked just downstream of 500 mb ridges. Here is a link to Another example 500 mb height map showing precipitation areas.
Typically rain or snow is not simultaneously happening over the entire region favorable for precipitation. Often small areas of precipitation form within the favored region. These small areas of precipitation move in the direction of the 500 mb winds (the "steering level" winds). Thus, it is common for locations in the favored areas for precipitation to get periods of rain or snow, rather than continuous precipitation over the entire favored region.
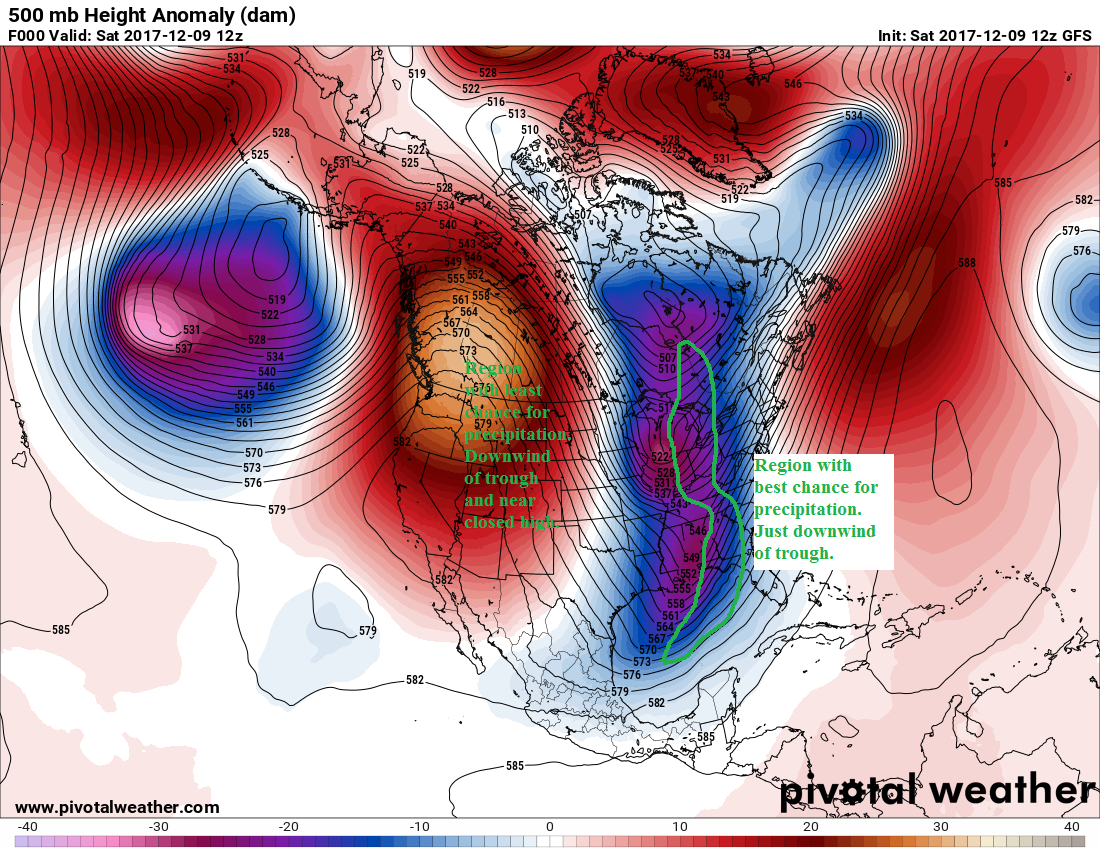 Map of the 500 mb height pattern for December 9, 2017 at 12Z highlighting regions that are favorable and
unfavorable for precipitation.
Click on the image
above to open a larger version.
Map of the 500 mb height pattern for December 9, 2017 at 12Z highlighting regions that are favorable and
unfavorable for precipitation.
Click on the image
above to open a larger version.
|
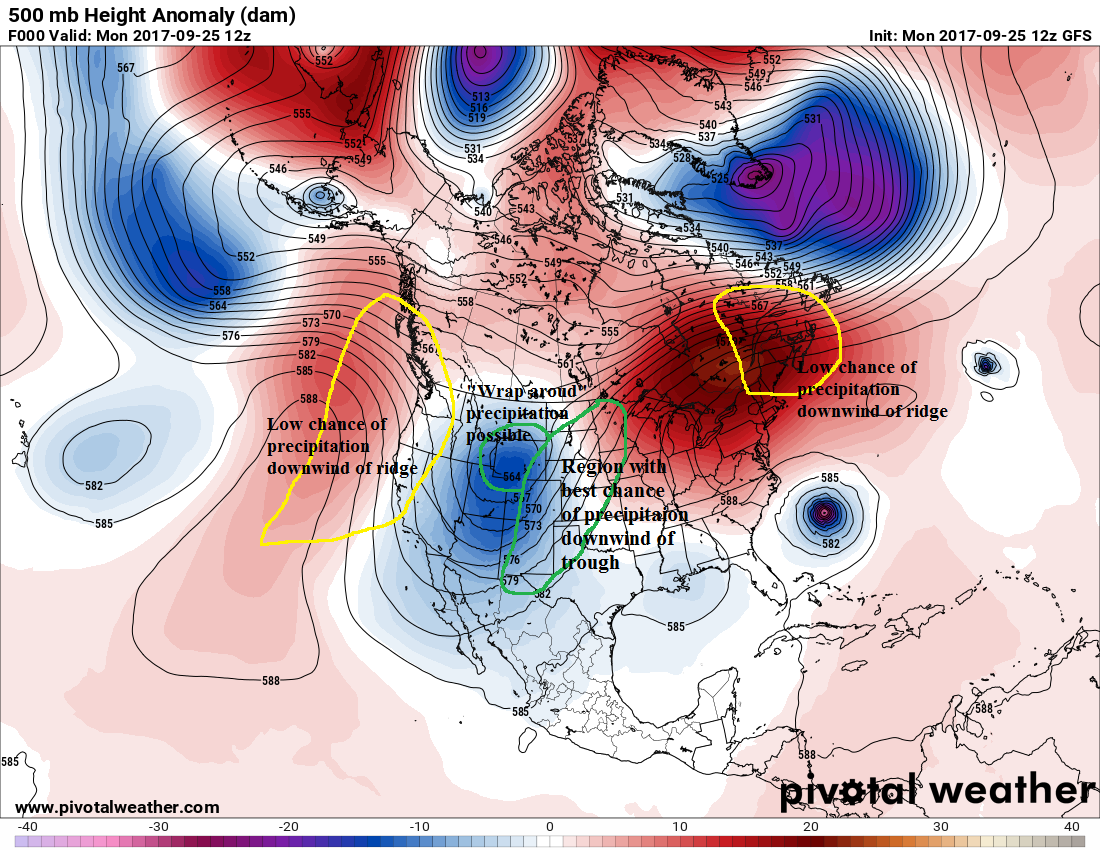 Map of the 500 mb height pattern for September 25, 2017 at 12Z highlighting regions that are favorable and
unfavorable for precipitation.
Click on the image
above to open a larger version.
Map of the 500 mb height pattern for September 25, 2017 at 12Z highlighting regions that are favorable and
unfavorable for precipitation.
Click on the image
above to open a larger version.
|
This is somewhat simplistic and will not always give you all the details of where it is and is not raining. One problem is that the 500 mb height map does not contain any information about the amount of moisture or water vapor that is present in the atmosphere. Therefore, even a strong trough, which forces strong upward air motions, may not produce any precipitation (or even clouds) if there is not enough water vapor in the air. In fact it is fairly common here in the desert to have troughs move through without much in the way of clouds or rain. Since this is not strictly a weather class, we do not have time to cover details like this. The use of 500 mb maps allows you to make a quick (and often decent) assessment of the large-scale temperature and precipitation patterns.
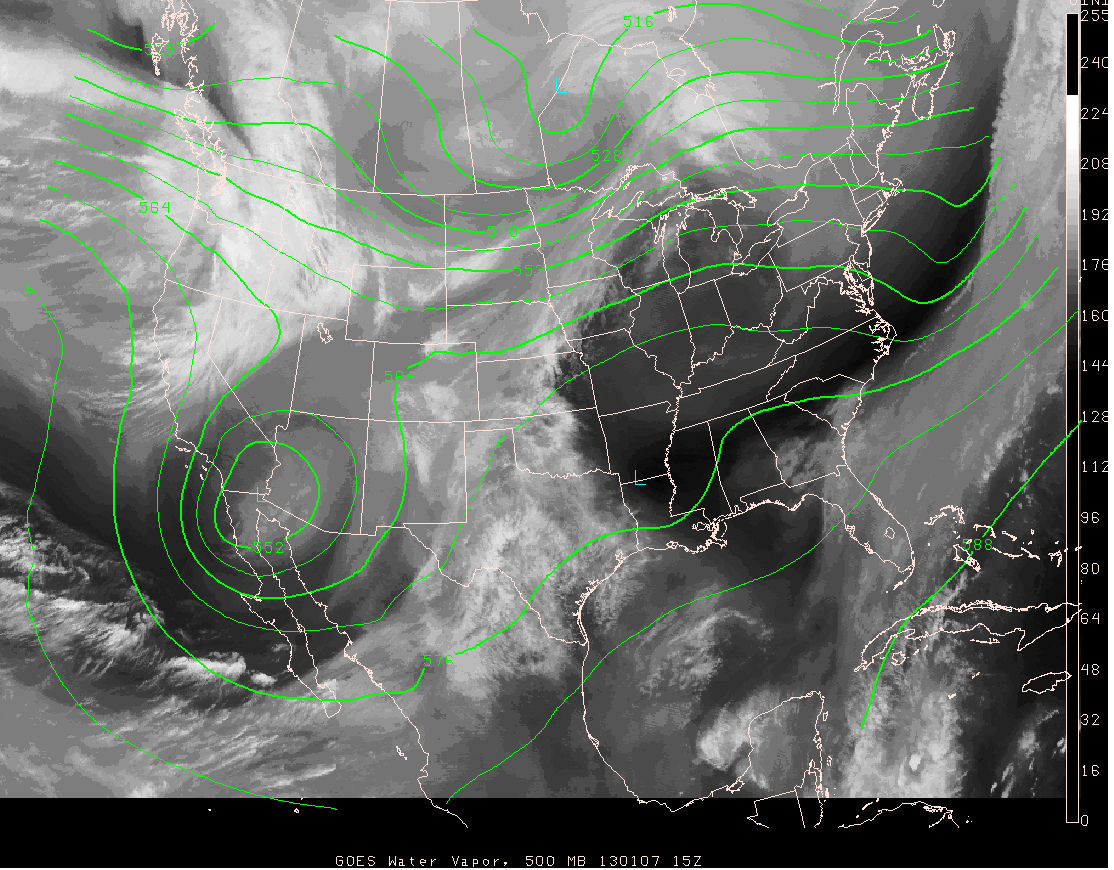
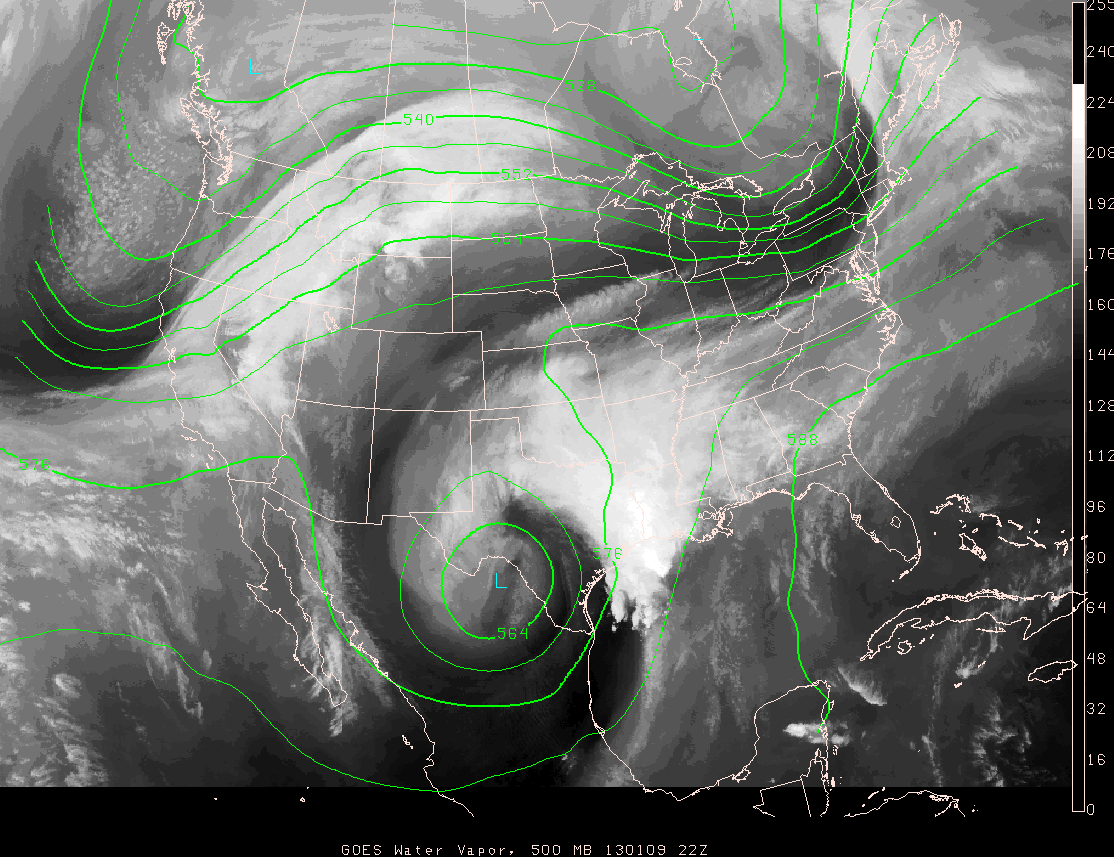
An example of a trough and closed low that did not produce precipitation until sufficient moisture was drawn into the system happened in January 2013 with the passage of a trough and closed low over Tucson. The problem as too often happens in the desert southwest, is that there was not enough moisture in the air to produce much in the way of clouds or precipitation. Link to 500 mb pattern at 15Z, 01/07/13 with satellite water vapor overlaid Notice the lack of clouds in the region just downstream of the trough and to the east of the closed low. The time on the image is 15Z, Monday, January 7, 2013, Local time 8 AM. By the way, if you were asked to analyze the weather based on the 500 mb height pattern shown, I would expect you to predict a good chance of precipitation happening in Tucson. The closed low slowly moved eastward and by Wednesday at 22Z, Local time 3 PM, it is centered just south of the Texas Big Bend area. Link to 500 mb pattern at 22Z on 01/09/13 with satellite water vapor overlaid. Now that low level water vapor mainly from the Gulf of Mexico is brought into play, widespread precipitation is happening. There are thunderstorms and heavy rain in eastern Texas and western Louisiana. Precipitation has wrapped around the counterclockwise circulation surrounding the closed low and heavy rain is also falling in western Texas.
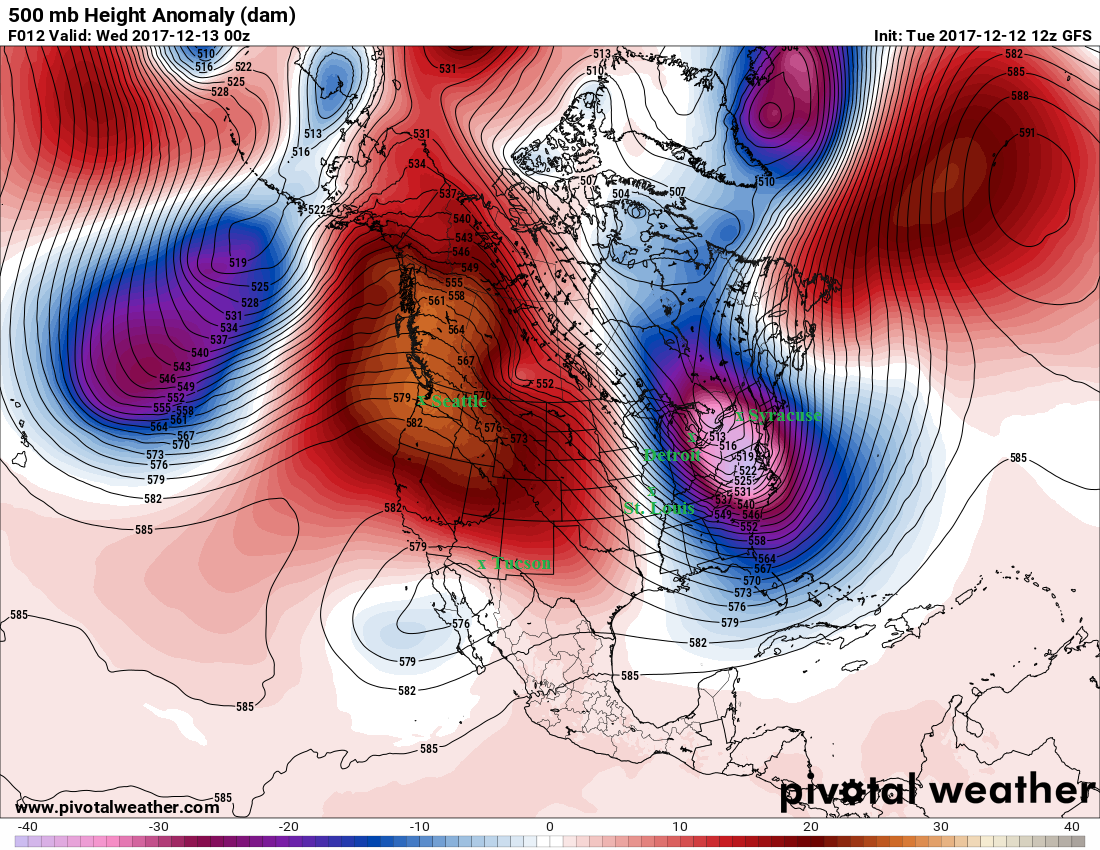
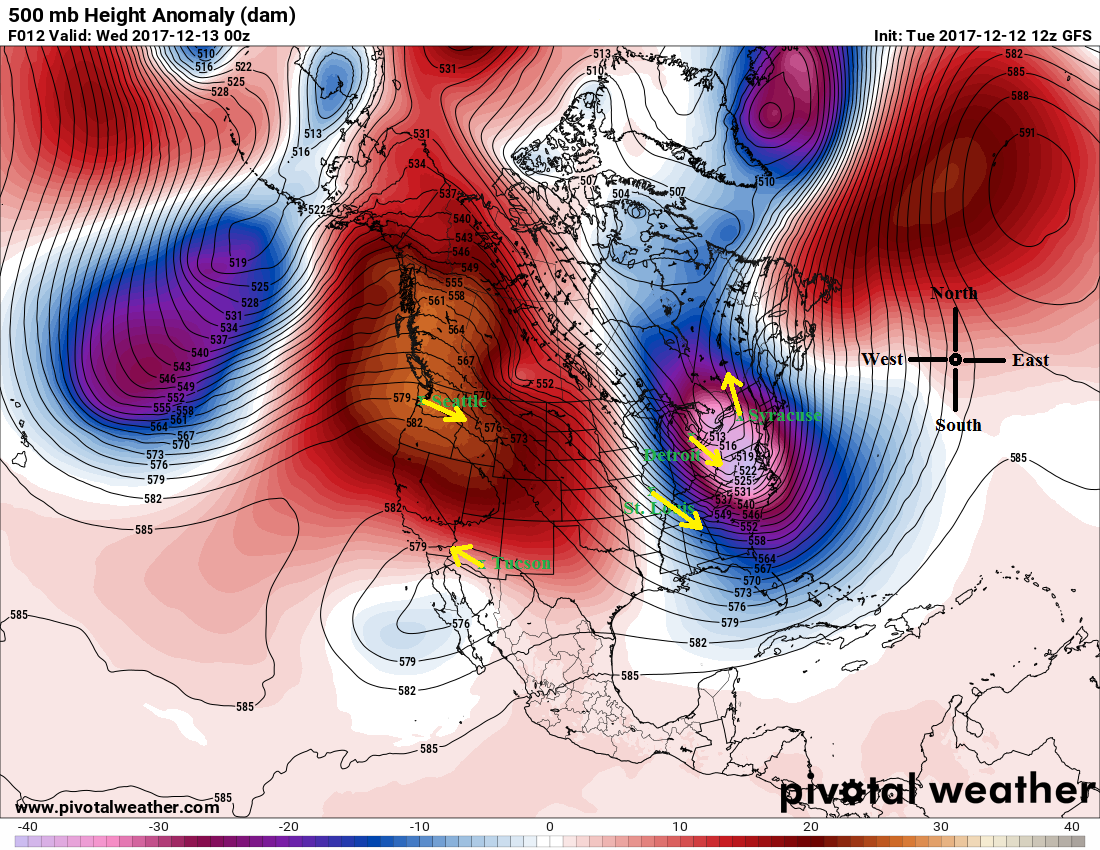
The 500 mb height anomaly map shown below was obtained from Pivotal Weather. More details about how to obtain 500 mb forecast maps is provided on the next reading page. Below the map is a weather analysis based on the map. This is an example of the type of analysis that I expect you to be able to provide.
|
|
According to the time stamp at the top of the map, this map is valid for Wednesday, December 13, 2017 at 00Z. The time stamped on weather products is the GMT (or UTC or Zulu) time as discussed on the previous page. 00Z is midnight GMT. You should know that the local time in Tucson is 7 hours earlier, which for this map is 5 PM on Tuesday, December 12, 2017.
There is a ridge with well above average 500 mb heights centered over the northwestern part of the country. There is a trough with a closed low that runs from the eastern great lakes off the middle Atlantic coast with much below average 500 mb heights. Finally, there is a closed low, which is centered in northwest Mexico, but extends into the extreme southwest portion of the United States.
The locations of 5 cities are marked with x's on the map above. For each, make a temperature and precipitation forecast based on the 500 mb height pattern and height anomaly.
Stronger (or faster) 500 mb winds are found where the height contour lines are close together (tightly packed), while weaker (or slower) 500 mb winds are found where the height contour lines are farther apart. Based on this, stronger 500 mb winds are expected for St. Louis, Detroit, and Syracuse with weaker 500 mb winds for Seattle and Tucson. The wind direction at 500 mb is parallel to the contours with lower contour values to the left of the wind direction as described above. Following meteorological convention, the wind direction is specified as the direction from which the wind is blowing. 500 mb wind directions for each city are given below. Link to 500 mb height map with wind arrows at selected cities.
![]()
![]()
![]()
![]()