![]()
![]()
![]()
![]()
Throughout much of the earth's history, long before humanity came onto the scene (from say 2,000 million years ago to 2 million years ago), the global climate was much warmer than now, with the global mean temperature as much as 8°C to 15°C warmer than it is today. During most of this time, the polar regions were free of ice. For example, during the mid-Cretaceous Period, around 100 million years ago, lush ferns and alligators resided in what is now Siberia. Dinosaur skeletons have been recovered from north of the Arctic circle in Alaska. These and other pieces of evidence indicate that the mid-Cretaceous climate was on the order of 3-11°F (1.6 - 6.1°C) warmer at the equator and 30-110°F (16 - 61°C) warmer at the poles compared to the present with no permanent polar ice caps.
These comparative warm conditions, however, were interrupted by several periods of glaciation. Geologic evidence suggests that one glacial period occurred about 700 million years ago (or million years before present, MyBP) and another 300 MyBP.
The most recent glacial period — the Pleistocene Epoch — began about 2 MyBP (2 Million years Before Present).
About 2 MyBP, continental glaciers appeared in the Northern Hemisphere, marking the beginning of the Pleistocene epoch. The Pleistocene, however, was not a period of continuous glaciation but a time when glaciers alternately advanced and retreated (melted back) over large portions of North America and Europe.
The Pleistocene experienced the most important single environmental event since the human species has been on Earth: The oscillation between glaciation and interglacial periods. The Pleistocene Epoch is remarkable not just for the alternation of warm and cold phases but for the scale and rapidity of the changes. There were at least 20 glacial/interglacial cycles during the Pleistocene. The average period of the ice age cycles is about 100,000 years. This means that the time from the start of one ice age through the interglacial warm period to the start of the next ice age is about 100,000 years.
You should realize that an Ice Age does not mean the entire Earth is a frozen snowball. During the lead up to an Ice Age, there is more accumulation of ice each year than melt off. This results in glaciers spreading southward from the north pole. Over a period of many years, the glaciers can extend as far south as the northern parts of the United States, but do not reach into the tropics. In fact the tropics are probably still warm during ice ages. Scoll down to the figure below showing the coverage of ice at the peak of the last ice age.
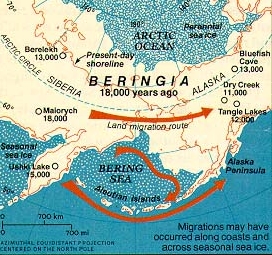 Figure 2. Alaska and Siberia and the Bering strait |
Coastal environments during the Pleistocene were controlled in large part by the fluctuating level of the sea. As a result of the many glaciations on land and the subsequent release of melt-water during interglacial times, sea level has fluctuated almost continuously between interglacial levels, like those of today, and levels during times of maximum glaciation, such as 18,000 years ago when sea level was more than 100 meters (over 300 feet) lower.
During glacial periods, the sea level is lowered as water accumulates as ice on continental land areas and the continental land areas are larger. The Bering Shelf was exposed at the time of the last glaciation and Siberia was connected to Alaska by a land bridge, thus allowing intercontinental migration of animals, including early humans. Ancestors of the American Indians were able to walk across the Bering Strait linking Alaska and Siberia. Today, we are in an interglacial period, sea level is more than 100 meters higher than it was during the glacial period, and the land bridge is again covered by water.Significant climate changes are observed over the entire Earth during these glacial/interglacial oscillations. In areas of the Earth not covered by glaciers, climate differences during the ice age cycles include:
The last Pleistocene ice age reached a maximum 22,000-14,000 yBP. During this period two large ice sheets have been identified in the Northern Hemisphere: the Laurentide Ice Sheet covering parts of Eastern North America, and the Scandinavian Ice Sheet covering parts of northern Europe (see figure below). The cordilleran Ice Sheet over western North America achieved a maximum somewhat later than these, about 14,000 years ago.
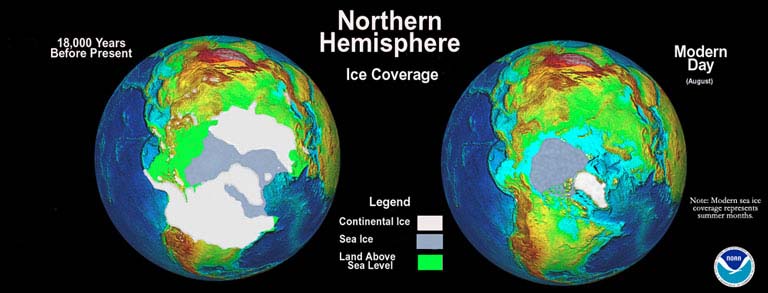 |
| This image compares modern day glacier and ice coverage of the Northern Hemisphere with the same region 18,000 years before present. Note that the modern sea ice coverage is during the summer months; winter coverage is more extensive. |
During this last ice age, the maximum area of the Northern Hemisphere ice sheets was equal to approximately 90% of the maximum achieved during the last million years of the Pleistocene. At the glacial maximum the sea level dropped by approximately 85 meters and sea-surface temperature fell by as much as 10°C in mid-latitudes of the North Atlantic and 3°C in the Caribbean.
The classic Antarctic Vostok Ice Core graphs were originally produced the 1990s. Ice cores are cylinders of ice drilled out of glaciers and ice fields. The longest cores extend to 3 km in depth. Ice cores contain information about changes in past temperatures and atmospheric composition. The ice traps small bubbles of air that contain a sample of the atmosphere at the time the ice formed. The oldest ice cores in Antarctica date back 800,000 years. Ice core data has been used to make graphs of the change in temperature and changes in greenhouse gas concentrations.
The image below shows the inferred changes in CO2 concentration and air temperature over the last 400,000 years (4 ice age cycles) based on the Vostok ice cores. The time axis runs from 400,000 years before 1950 to 1950. Notice how abruptly ice ages end (from cold to warm) at approximately 330,000 years ago, 240,000 years ago, 140,000 years ago, and 14,000 years ago, which is the end of the most recent ice age. A striking feature of this graph is the apparent correlation between changes in temperature and changes in CO2 concentration. Notice that when the air temperature is relatively warm (peaks in the temperature plot) there are correspondingly high concentrations of CO2 and when the air temperature is relatively cool, there are correspondingly low concentrations of CO2. This correlation was initially pronounced as "evidence" that increases in CO2 concentration cause the temperature to go up and that decreases in CO2 concentration cause the temperature to do down. In his 2006 movie, "An Inconvient Truth," Al Gore claimed that this correlation is proof that human-caused increases in greenhouse gases will cause significant increases in global average temperature. Note that the concentration of CO2 was below 300 ppm for over 400,000 years prior to 1950. In 2006, the CO2 concentration in the atmosphere reached 380 ppm (it is now over 410 ppm). The message was that this graph proves that the air temperature is headed toward its warmest values in over 400,000 years, since the CO2 concentration is the highest that it has been in over 400,000 years.
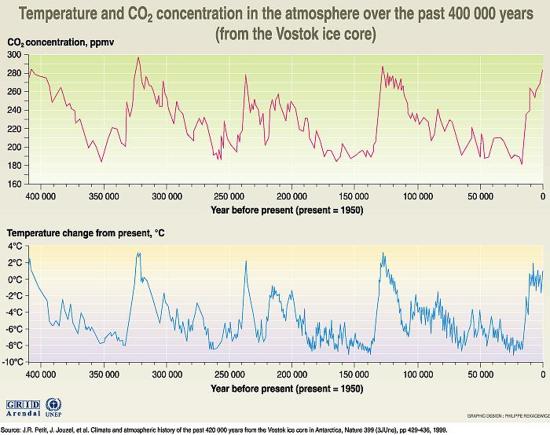 |
| Figure taken from Petit, J., Jouzel, J., Raynaud, D. et al. (1999). Climate and atmospheric history of the past 420,000 years from the Vostok ice core, Antarctica. Nature 399, 429–436. https://doi.org/10.1038/20859 |
The problem with using this graph to draw conclusions is that a cause and effect mechanism between changes in past temperature and changes in CO2 concentration was not established. It is always important to keep in mind that correlation does not prove cause and effect. The most recent evidence suggests that the past temperature changes caused the carbon dioxide to change, not the other way around. This was discovered after more precise dating methods were applied to the ice cores that allowed finer-scale dating of the temperature and CO2 changes. It was found that the changes in the greenhouse gas carbon dioxide actually lags (comes after) the changes in temperature by hundreds of years, which refutes the hypothesis that increases in greenhouse gases caused the temperature changes. A possible physical reason for this is thought to be largely due to a feedback mechanism in which as the oceans warm, the amount of dissolved gases they can hold decreases. As ocean waters warm, less carbon dioxide can remain dissolved in the water, so carbon dioxide is released from the oceans into the atmosphere, and level of CO2 in the atmosphere increases. On the other hand, as ocean waters cool, they are able to hold more dissolved carbon dioxide, with the result that more and more carbon dioxide in the atmosphere gets dissolved in the oceans, which lowers the concentration in the atmosphere. In spite of the latest research, figures like the one below are still cited as "evidence" that past increases in greenhouse gases caused past warming events.
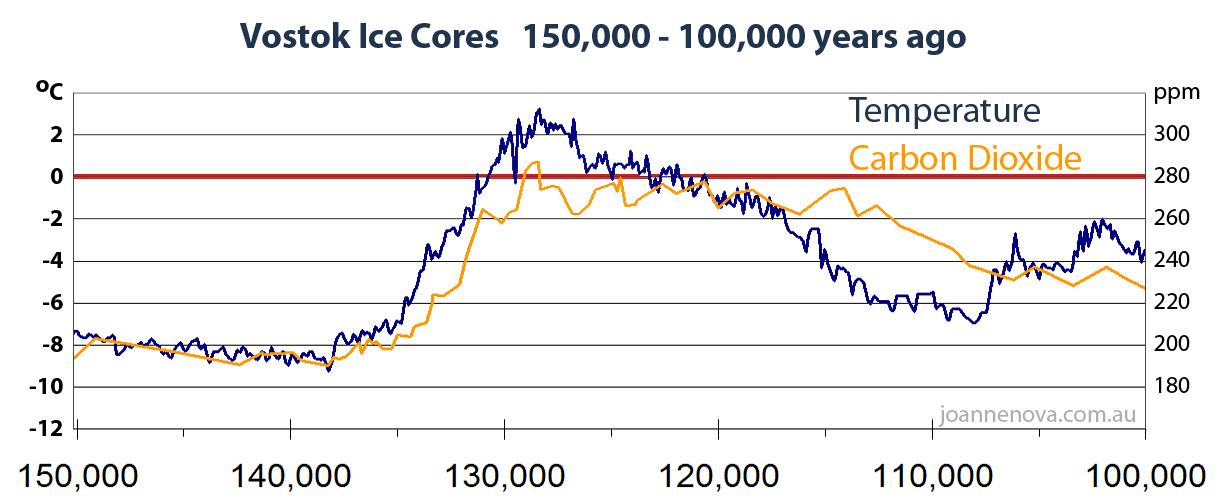
To be fair to Al Gore, at the time "An Inconvenient Truth" was made there was still much debate about a possible cause and effect mechanism for the correlation between past temperture changes and past changes in carbon dioxide. However, that does not excuse him from continuing to cite this "evidence" as proof that human emissions of greenhouse gases will lead to catastrophic warming of the Earth's surface. This and similar misleading graphs are still presented all over the internet and even in college courses on climate change. The time lag between changes in temperature (cause) and changes in past concentrations of CO2 (effect) is estimated to be about 800 years. This is difficult to see in the 400,000 year plots above, but it is easier at higher time resolution. Here is a link to a plot that zooms in on the time period from 150,000 to 100,000 years ago to make it easier to see the time lag. Ice core graph 150,000 to 100,000 years ago (source The 800 year lag in CO2 after temperature – graphed).
Does this prove that human emissions of greenhouse gases will not cause global warming? No. Only that the temperature changes through the ice age cycles were not driven by changes in CO2. Note that the current CO2 concentration in the atmosphere is over 410 ppm. This is much higher than has been inferred from anytime over the last 400,000 years of ice core data. In that sense, we are in uncharted territory. What we can say is that past, natural temperature changes in the ice core data were not caused by changes in CO2 ... thus, it is incorrect to conclude that the ice core data proves that increasing CO2 in the atmosphere must cause strong increases in temperature.
![]()
![]()
![]()
![]()