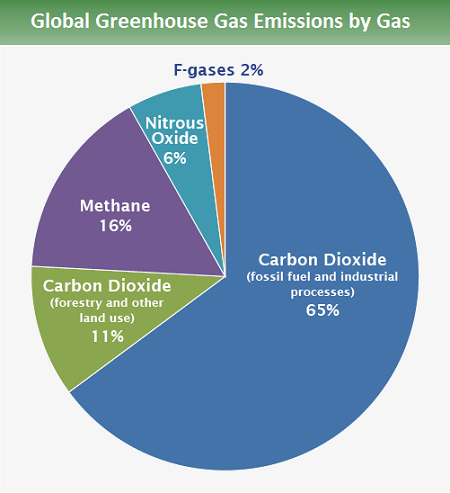
One thing about the global warming debate that we know for sure is that concentrations of several greenhouse gases in the atmosphere are increasing due to the activities of man. The table below lists the greenhouse gases that are increasing due to human activity as well as the percentage increases since 1750. The last column indicates the major natural and anthopogenic sources for each of the gases. Note that some of these greenhouse gases produced by humans have no natural sources. As mentioned previously, the production and use of ozone-depleting CFCs has been greatly reduced in recent years, and the concentrations of these chemicals in the atmosphere have started to decline. However, the the ozone-friendly chemical substitutes that are now used for air conditioning, HFCs are also greenhouse gases. Human activities release other greenhouse gases, such as PFCs, and SF6. Another greenhouse gas, ozone, has recently gotten some attention as a potential contributor to global warming and climate change. The concern is over increasing concentrations of ozone in the troposphere related to photochemical smog. In the table below, greenhouse gas concentrations are given in either ppm (parts per million), ppb (parts per billion), or ppt (parts per trillion), where, for example, one ppm means one molecule of greenhouse gas per one million gas molecules in the atmosphere. The figure below the table on the left shows that carbon dioxide makes up 76% of all human emissions of greenhouse gases, with methane and nitrous oxide making up another 22%. The F-gases, which include the other gases in the table, except ozone, only make up about 2% of the total greenhouse gas emissions. The figure on the right shows the percentage of greenhouse gas emissions that are associated with different economic sectors.
|
Greenhouse Gas |
Concentration 1750 | Present Concentration | Percent Change |
Natural and Anthropogenic Sources (in bold) |
|---|---|---|---|---|
| Carbon Dioxide (CO2) | 280 ppm | 418.56 ppm | 49.5 % | Organic decay; Ocean outgassing; Forest fires; Volcanoes; Burning fossil fuels; Deforestation; Land-use change |
| Methane (CH4) | 0.722 ppm | 1.924 ppm | 166 % | Wetlands; Organic decay; Termites; Natural gas & oil extraction; Biomass burning; Rice cultivation; Cattle; Refuse landfills |
| Nitrous Oxide (N2O) | 270 ppb | 336.2 ppb | 24.5 % | Forests; Grasslands; Oceans; Soils; Soil cultivation; Artificial Fertilizers; Biomass burning; Burning of fossil fuels |
| Chlorofluorocarbons (CFCs) and Hydrochlorofluorcarbons (HCFCs) | 0 | 1106 ppt | Not Applicable | Refrigerators; Aerosol spray propellants; Cleaning solvents; Banned to protect Ozone layer |
| Hydrofluorocarbons (HFCs) | 0 | 84 ppt | Not Applicable | Ozone-friendly CFC substitute used mostly for refrigeration and air conditioning |
| Perfluorocarbons (PFCs) | 34 ppt | 82 ppt | 141% | Minute quantities exist naturally; Aluminum smelting; semiconductor industry |
| Sulfur hexafluoride (SF6) | 0 | 10.66 ppt | Not Applicable | Used in equipment for transmission of electricity, and various industrial applications |
| Tropospheric Ozone (O3) | 237 ppb | 337 ppb | 42 % | Created artificially through photochemical smog production |
 |
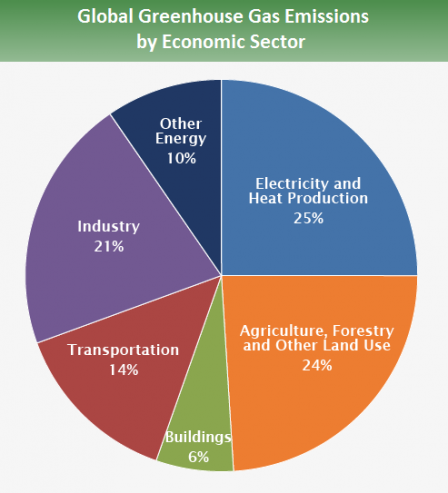 |
| Percentage of total greenhouse gas emissions by individual gases. Source (IPCC, 2014) | Percetage of total greenhouse gas emissions by economic sector. Source (IPCC, 2014) |
Six of the greenhouse gases listed in the table above, carbon dioxide, methane, nitrous oxide, HFCs, PFCs, and sulphur hexafluoride, were targeted for reduction by the Kyoto Protocol of 1997. Countries that signed the Protocol agreed to reduce their cumulative emissions of these gases to 5% below 1990 levels over the period from 2008 to 2012. The reductions are based on CO2 equivalents (see global warming potential table below). The Protocol did allow flexibility to countries to apply carbon offseting and market-based mechanisms, such as carbon trading, to meet their overall emission reduction goals. Some of the countries, which signed the Protocol, did meet their pledge to limit emissions, while others actually continued to increase their emissions. The successful and failing countries are shown in Has the Kyoto protocol made any difference to carbon emissions? The article concludes that there were more successes than failures and that total emissions from countries that signed the Kyoto Protocol decreased from 1990 to 2012. However, overall global emissions have significantly increased over that period, especially due to increases from China and other emerging economies. One should also consider the fact that some of the emissions from places like China were produced while manufacturing goods that were shipped to economies that signed the Protocol. Note that the United States did not sign or agree to the emission reductions set by the Kyoto Protocol.
While most agree that the modest emission reductions agreed to in the Kyoto Protocol will have only a very slight impact on the rate of global warming, some say it was an important first step in getting the global community to recognize the issue and work together on possible solutions. The Kyoto agreement expired in 2012. World climate conferences held in Copenhagen, Denmark in 2009, Cancun, Mexico in 2010, and Durbin, South Africa in 2011 did not lead to any significant agreements for futher reductions in greenhouse gas emissions.
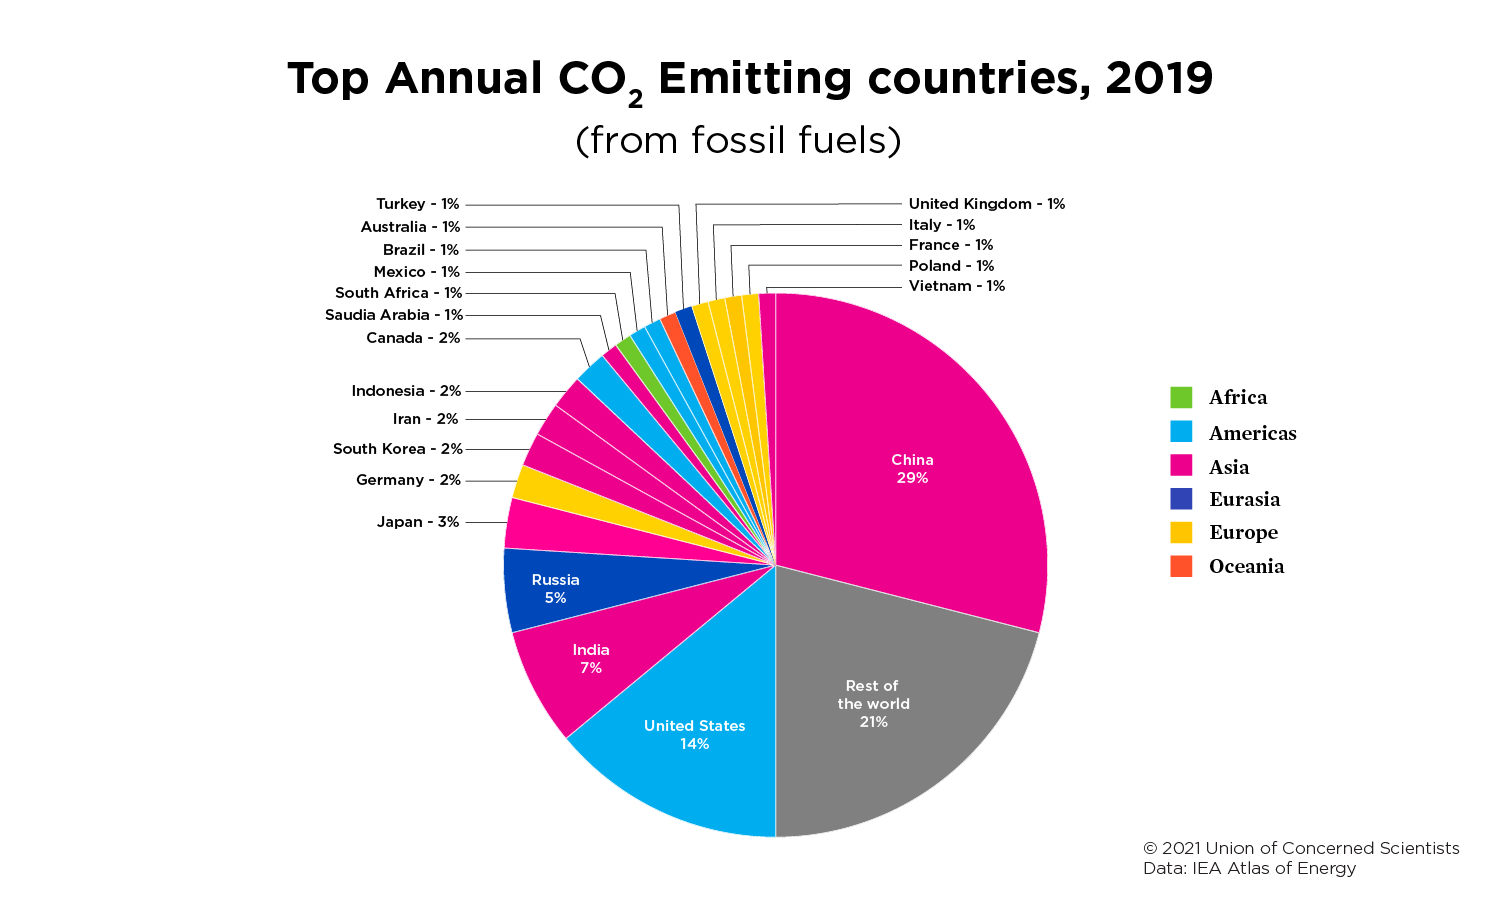
An important on-going consideration is that the largest increases in greenhouse gas emissions are coming from developing countries like China and India. In fact China has far surpassed the U.S. as the #1 emitter of greenhouse gases as shown in the figure below. (Note: This is for the entire country, the U.S. still has the most Greenhouse Gas emissions per person). Some developing countries have shown little interest in agreeing to emission reductions, arguing that they are only trying to achieve the standard of living enjoyed in the developed world, which only seems fair. If China will not agree to emission reductions, then there will be those in the U.S. and other developed countries who will argue that they should not agree to reductions either, mainly because emission controls will lead to higher energy prices and put the signing countries at an economic disadvantage. The other big reason holding up an international agreement is uncertainty about the ultimate effects of higher greenhouse gas levels on climate change.
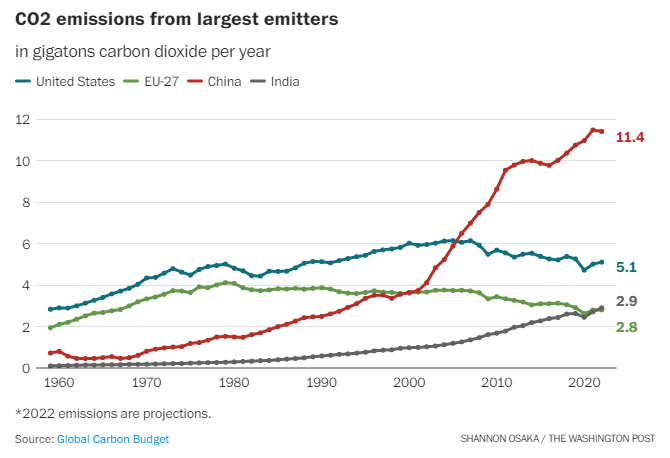 |
Annual CO2 emissions from the US, the European Union, China, and India from 1960 - 2022. (Source: Washington Post) |
In December 2012, the Doha Amendment to the Kyoto Protocol was adopted. Most of the countries that agreed to the original Kyoto Protocol committed to reduce their carbon equivalent emissions of greenhouse gases to levels at least 18% below 1990 levels during the period from 2013 to 2020. Once again the US did not agree to the Protocol. Two important countries that were part of the original Kyoto Protocol, Canada and Japan, decided to opt out of the Kyoto Protocol at the end of 2012 and did not agree to the new emission reductions. The new agreement includes one additional greenhouse gas, nitrogen trifluouride (NF3).
In December 2015, at the Paris Climate Summit, 195 countries, which covers over 90% of the global emissions of greenhouse gases, voluntarily pledged to reduce greenhouse gas emissions during the decade of the 2020s. This covers the period after the Doha Amendment to the Kyoto Protocol. The stated overall goal is to limit the increase in global average surface temperature to less than 2°C above the pre-industrial average temperature and to less than 1.5°C if possible. (Instructor's Note. There is no certainty that this goal would be met if all countries meet their pledged greenhouse gas emission reductions. In fact the connection between temperature changes and greenhouse gas emissions is highly uncertain as there is much that we do not understand about climate and climate change. A better overall goal would be to set a limit on the future amount of greenhouse gases in the atmosphere as we have more direct control over that).
A summary of each of the countries' pledges to reduce emissions is published in Paris 2015: Tracking country climate pledges. In March 2015 the United States, under president Obama, pledged to reduce its emissions of greenhouse gases by 26-28% by 2025 relative to US emissions in 2005. In other words, the US pledged that greenhouse gas emissions from the US in 2025 would be 26-28% lower than US greenhouse gas emissions were in the year 2005. China pledges to reach it peak in greenhouse gas emissions by the year 2030. During the 2020s China pledges to reduce it emissions per unit of GDP. Even in signing the PCA, China projects that their emissions will continue to rise until 2030. The reaction to Paris Agreement has been mixed. It is praised in the New York Times, see Nations Approve Landmark Climate Accord in Paris. However, others are worried that the agreement consists mostly of promises and goals, but no firm or legally-binding commitments, e.g., James Hansen, father of climate change awareness, calls Paris talks 'a fraud' published in The Guardian.
On June 1, 2017, under former president Trump, the United States announced its intention to withdraw from the Paris Agreement. Here is Trump's Speech on Withdrawing from the Paris Climate Accord.
On January 20, 2021, President Biden announced that the United States has rejoined the Paris Climate Accord reaffirming all of the original pledges made by the Obama Administration in 2015.
One alarming aspect about the observed rate of increase of CO2 is that the rate of increase itself has been increasing since 1960. Mathematically, this type of growth rate is described as growing exponential rather than linear. For a linear increase the amount of CO2 in the atmosphere would increase by the same amount each year, for example 2 ppm per year. For linear growth the year to year percentage increases relative to the total amount of CO2 in the atmosphere will get smaller as the total increases. But for an exponential increase with a constant rate of increase, the percentage increase from year to year remains the same, which means the year to year increases get larger each year.
The table below shows the concentration of CO2 in the atmosphere every 20 years from 1900 to 2020. Obviously CO2 has been increasing over this entire period. Up until 1960, though, the percentage increase over the previous 20 years was less than 3% and actually decreasing with time. However, this changed after 1960. From 1960 to 1980, the concentration of CO2 increased by 7%. It then increased by 9% from 1980 to 2000, and the increase from 2000 to 2020 is over 12%. Since 1960, not only has there been continued increases in the amount of CO2 in the atmosphere, but the overall percentage increase from over 20 year periods has also been increasing. This is an exponential function with an increasing growth rate. Do not worry if you do not understand the mathematical terms. The point is that the increase in CO2 in the atmosphere has been accelerating since 1960. Thus, it is easy to conclude based on these observations that little if any progress had been made in reducing greenhouse gas emissions worldwide since at least 1960.
|
Year |
CO2 concentration (ppm) |
% increase in 20 years |
1900 | 295.67 | ----- |
|---|---|---|
| 1920 | 304.25 | 2.9% | 1940 | 311.36 | 2.3% |
| 1960 | 316.63 | 1.7% |
| 1980 | 338.7 | 7.0% |
| 2000 | 369.12 | 9.0% |
| 2020 | 414.01 | 12.2% |
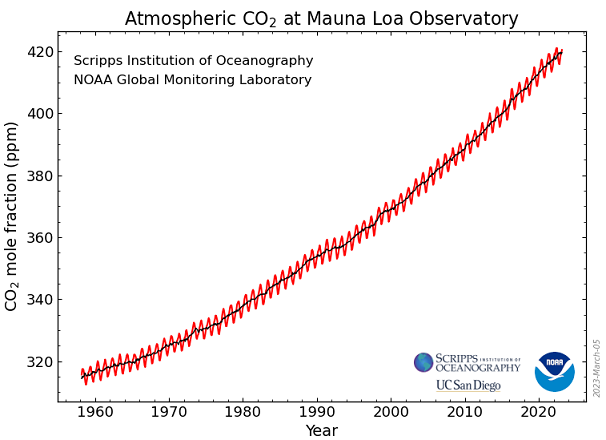
Accurate measurments of the carbon dioxide concentration in the atmosphere have been taken from the observatory on Mauna Loa, Hawaii since 1958. The remote location of Manuna Loa was selected to avoid contamination from most human sources of CO2. The figure below on the left shows the full record of observations. Shown on the right are the year to year increases in carbon dioxide. The horizontal black lines show the average increase for each decade, i.e., 1961-1970, 1971-1980, 1981-1990, 1991-2000, 2001-2010, and 2011-2020. The average rate of annual increase in CO2 grew significantly from the 1960s through the 1970s and 1980s. The 1990s had a slight decrease compared to the 1980s, but then increased again to an annual average increase of nearly 2 ppm per year for the period 2001 to 2010. The annual average for the last decade 2011 to 2020 is about 2.43 ppm per year. While the decadal trends in average annual CO2 growth continue to be increase, there is quite a lot of variability from year to year. The year to year variations are much larger than the year to year changes in CO2 emissions. This indicates that there are natural geophysical factors that modulate how much of the yearly CO2 that remain in the atmosphere. One big factor is the El Nino and La Nina climate cycles. The years with the largest annual increase (1998, 2015, and 2016) were strong El Nino years. Note the large drop in annual growth in the year immediately following these events after the strong El Nino transitioned to the La Nina phase of the cycle.
 |
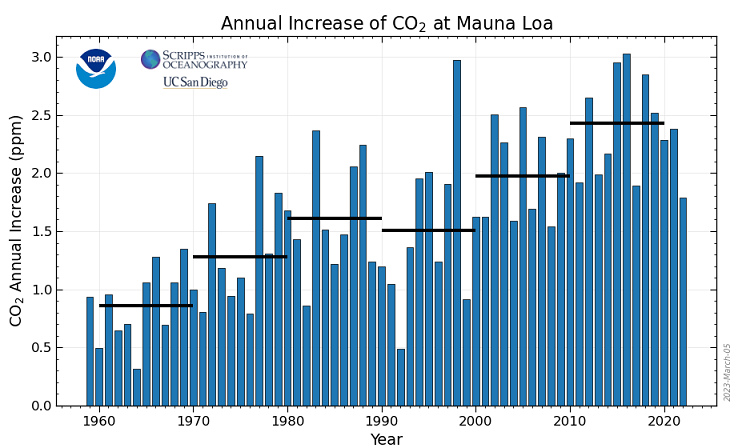 |
| Concentration of CO2 from 1958 to March 2023 as observed from Mauna Loa, Hawaii. Red curve shows the measurements. Black curve smooths out seasonal variations to highlight long-term trend. | Increase in CO2 relative to previous year from 1960 to 2022. |
Although CO2 concentrations continue to increase in Earth's atmosphere, there is some potentially good news on this issue. The emissions of greenhouse gases from energy combustion and industrial processes from several countries with "advanced economies" have decreased following the global economic slowdown in 2007 and remain lower today. Countries with "advanced economies" include the European Union, The United States, and Japan. Other reasons for the recent declines from these countries include the largescale shift to natural gas power generation, more fuel-efficient vehicles, and the development of renewable energy. The decline in annual emissions from these countries is shown in interactive graph of CO2 emissions in selected advanced economies, 2000-2021 produced by the IEA. These "advanced economies" had peak emissions for energy and industrial processes in 2007 with lower annual emissions after 2007. Note the clear low point in 2020 due to COVID and the rapid increase in 2021 following COVID.
Unfortunately, increases in emissions from the rest of the world have been larger than these reductions. Thus, worldwide greenhouse gas emissions continue to increase each year. This is shown for China and India in this interactive graph of CO2 emissions in selected emerging economies, 2000-2021 produced by the IEA. The increases in CO2 emissions from China and India are much larger than the reductions from the US, EU, and Japan. The overall result as discussed above is that the annual increase in the atmospheric concentration of CO2 continues to grow, though there are year to year fluctuations depending on factors such as El Nino and La Nina. Projected future increases in energy-related carbon emissions are expected to come mostly from developing countries, Projected growth in CO2 emissions driven by countries outside the OECD.
Only time will tell how CO2 emissions will actually change in the future. Most of the emission reduction pledges made by participating countries in the Paris Agreement do not kick in until 2025 or later. Cuts made by developed countries will likely be more than offset by expected increases in emissions from developing countries. For example, China and India, which are two of the top three emitters by country (See image below), are considered developing countries in the 2015 Paris Climate Agreement, and have stated that they expect to increase emissions until at least 2030 before starting to reduce them. Other developing countries that currently have very low emissions are also expected to have large percentage increases in their emissions. There are also questions about whether participating countries will actually meet their voluntary pledges for emission reduction. Some argue that the modest emission cuts promised do not go far enough to make a significant difference. For example, the US' original pledge to reduce emissions in the year 2025 to a level 26-28% below 2005 emissions still means the US would be emitting lots of greenhouse gases (28% lower than a large number is still a large number). US emissions in 2018 were already 9% lower than the emissions in 2005. While meeting these pledges would slow down the rate of greenhouse gas increases, greenhouse gas concentrations would continue to rise in the atmosphere. Perhaps the biggest factor in our ability to reduce worldwide greenhouse gas emissions will be the potential development and implementation of relatively cheap alternative energy generation. In the long run, advancements in energy technology are required to replace fossil fuel usage and still meet the growing energy demands of the world.
On a per molecule basis, not all greenhouse gases are equal in their enhancement to the greenhouse effect. The table below defines something called the global warming potential (GWP). The GWP estimates the relative enhancement to the atmospheric greenhouse effect on a per molecule basis. Carbon dioxide is assigned a GWP of 1 so that all other greenhouse gases emitted by humans can be compared with carbon dioxide. For example, one molecule of nitrous oxide is about 310 times more effective than carbon dioxide in its enhancement to the greenhouse effect on Earth. Some CFCs and their substitutes are up to 10,000 times more effective. According to the table below, one molecule of sulfur hexaflouride is 23,900 times more effective than one molecule of carbon dioxide in enhancing the greenhouse effect on Earth.
|
Gas |
GWP |
|---|---|
| Carbon dioxide (CO2) | 1 |
| Methane (CH4) | 21 |
| Nitrous oxide (N2O) | 310 |
| Hydrofluorocarbons (HFCs) | 560-12,100 |
| Perfluorocarbons (PFCs) | 6,000-9,200 |
| Sulfur hexafluoride (SF6) | 23,900 |
Note: Typical GWP uncertainties are about ±35 percent.
Be careful not to be mislead by the table. The total enhancement to the greenhouse effect depends on the per molecule global warming potential times the number of molecules added to the atmosphere. Overall, carbon dioxide is still the largest contributor to global warming (enhanced greenhouse effect) because there is so much more of it emitted. A figure presented above shows that of all the greenhouse gases emitted worldwide, about 76% is CO2, 16% is CH4, 6% is N2O, and the remaining 2% includes all of the HFCs, PFCs, and sulfur hexafluoride.
Again, even though carbon dioxide has the lowest global warming potential per molecule added to the atmosphere, the enhancement to the overall greenhouse effect caused by CO2 is still greater than the enhancements caused by all other human added greenhouse gases combined. Researchers have computed a number called "radiative forcing" that is meant to account for the influence that human-added greenhouse gases have had in altering the incoming and outgoing radiation energy for the planet Earth. The figure below shows the calculated radiative forcing for many human-added greenhouse gases from 1979 to 2015. Note that the largest radiative forcing (or warming influence) is due to carbon dioxide, even though it has the lowest global warming potential per molecule. Note also that the normalized annual index, which was set to 1 in 1990 has increased to nearly 1.4 by the end of 2015, which equates to a 40% increase since 1990.
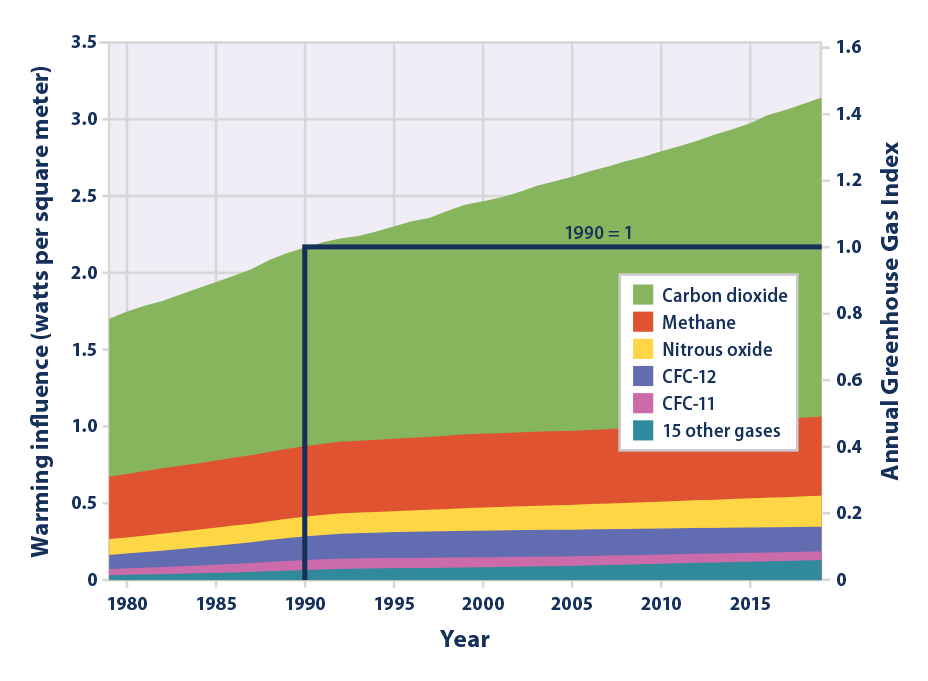 |
The amount of radiative forcing caused by various greenhouse gases, based on the change in concentration of these gases in the Earth's atmosphere since 1750. Radiative forcing is calculated in watts per square meter, which represents the size of the energy imbalance in the atmosphere. On the right side of the graph, radiative forcing has been converted to the Annual Greenhouse Gas Index, which is set to a value of 1.0 for 1990. (source US EPA). [Instructor's note: This calculation assumes that there have been no changes in other components of climate that impact the radiation budget, such as water vapor and clouds, so the actual change in overall radiative forcing relative to 1750 could be much different.] |
There is no arguing that the concentrations of several greenhouse gases are increasing due to the activities of man. We can measure the increases. This increase in greenhouse gases is a perturbation or forcing to the climate system. Based on our discussion of the energy budget for the Earth, adding greenhouse gases should act to warm the surface of the Earth by enhancing the natural greenhouse effect. However, the way in which the climate system will ultimately respond to this perturbation of adding greenhouse gases is uncertain because the climate system is so complex. We simply do not understand all of the complex interactions and feedbacks that operate in the climate system. One source of uncertainty that we will discuss next is called the "Missing CO2 Sink". Even though we know how much CO2 is being released into the atmosphere, we do not know where it all goes. How can we expect to accurately predict future climate changes when we don't even know what happens to all of the CO2 that we add to the atmosphere? This is just one of many sources of uncertainty related to predictions of future climate changes.