![]()
![]()
![]()
![]()
The North American Monsoon (sometimes called the Mexican Monsoon or the Arizona Monsoon or the Southwest United States Monsoon) is experienced as a dramatic increase in rainfall from an extremely dry late spring season to a rainy summer season. The North American Monsoon region includes northwestern Mexico and parts of the US desert southwest. While the most notable change in our weather is the increase in moisture and precipitation during the monsoon season, it should be pointed out the meteorological definition of a Monsoon is simply a seasonal shift in wind direction. Monsoonal shifts in winds around the world are often associated with changes in precipitation, but they need not be.
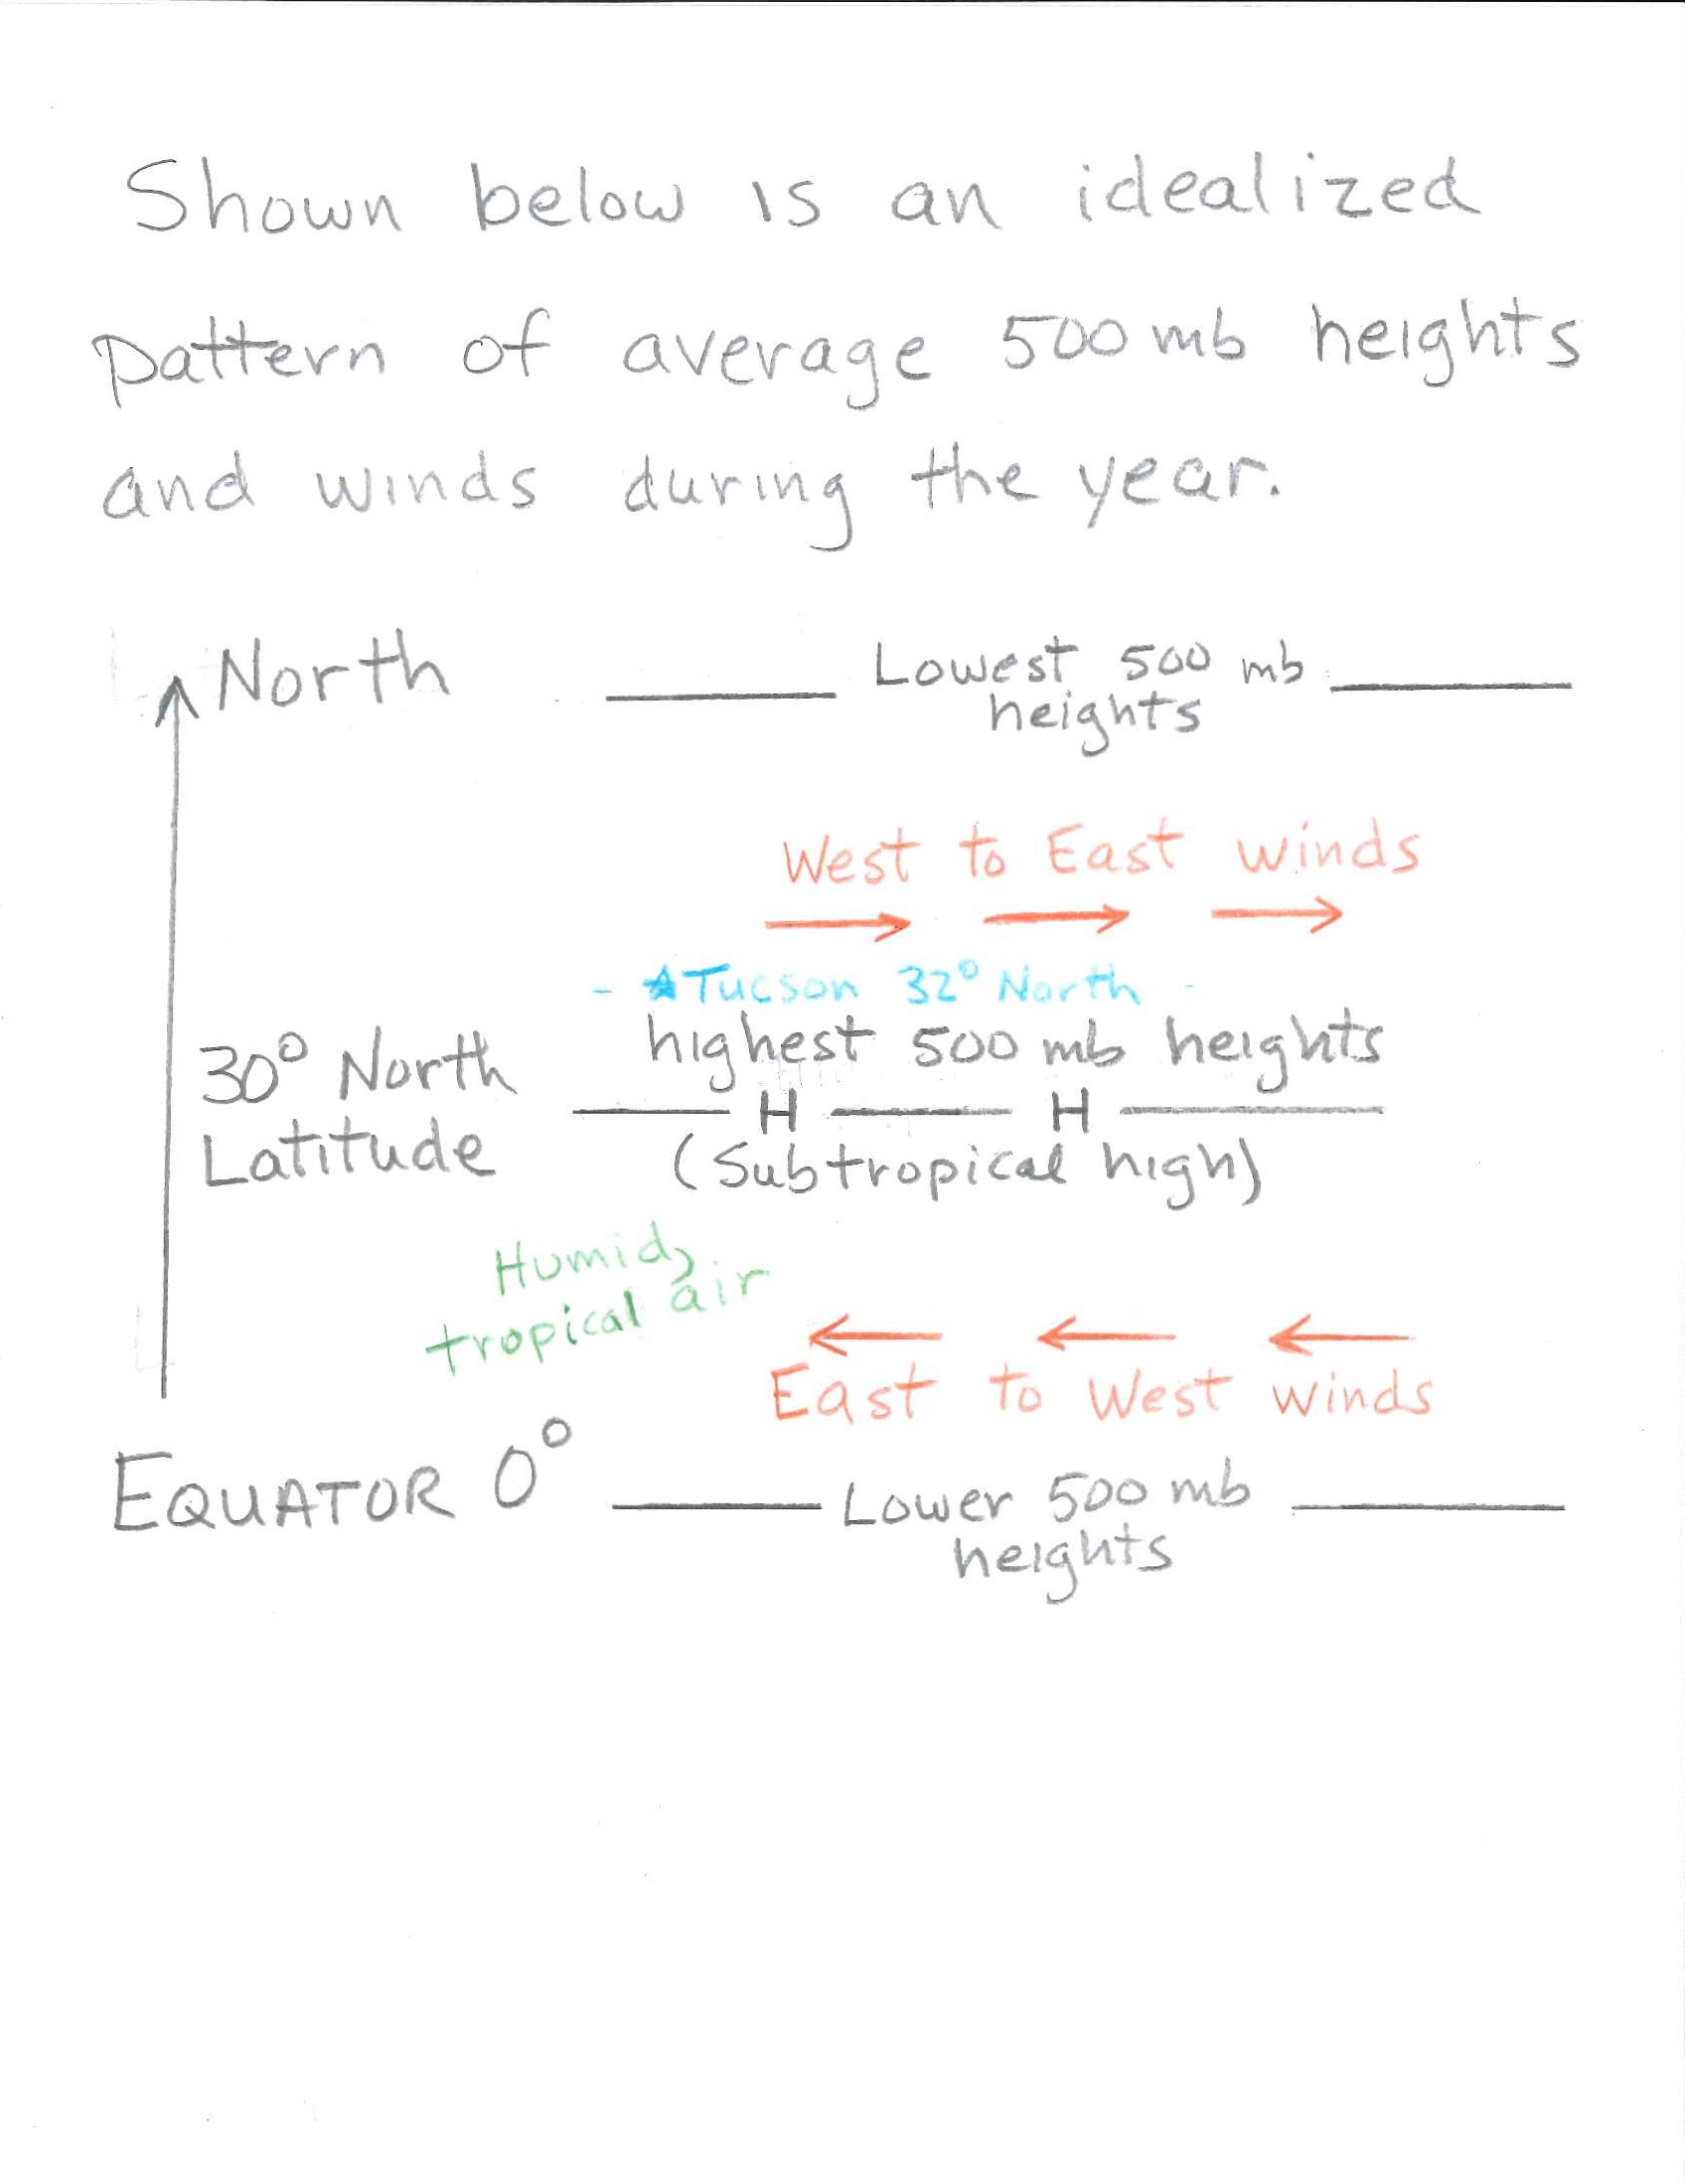
On average, the climate of Earth is characterized by a belt of high 500 mb heights at around 30° North latitude. This semi-permanent ring of high 500 mb heights is called the subtropical high. Lower 500 mb heights are found both to the north and to the south of the subtropical high region. The wind flow at 500 mb is parallel to the height contour pattern, with lower heights to the left of the wind direction. This means the 500 mb winds are generally west toward east north of the subtropical high and east toward west south of the subtropical high as shown in the figure below on the left. (Here is a link to a similar hand-drawn figure.) For most of the year, Tucson, which is located at 32°N latitude, is north of the subtropical high and the 500 mb winds over Tucson are generally west to east. At lower levels in the atmosphere, the air south of the subtropical high is typically humid, tropical air containing a lot of water vapor, while the air near the subtropical high is typically much drier and contains much less water vapor.
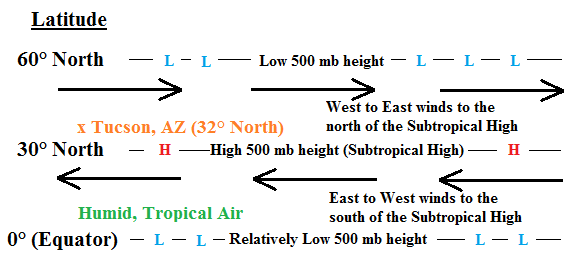
Typical pattern of 500 mb height and winds in the Northern Hemisphere. The highest 500 mb heights are typically centered at about 30° latitude, with lower 500 mb heights to the north (at 60° latitude) and to the south (at 0° latitude). Arrows show the 500 mb wind direction. 500 mb winds are west to east on the north side of the Subtropical High and east to west on the south side of the Subtropical High. Note that Tucson, which is at 32° latitude, is north of the subtropical high within the zone of west to east 500 mb winds. |
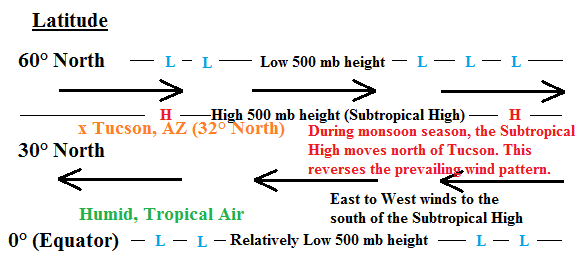
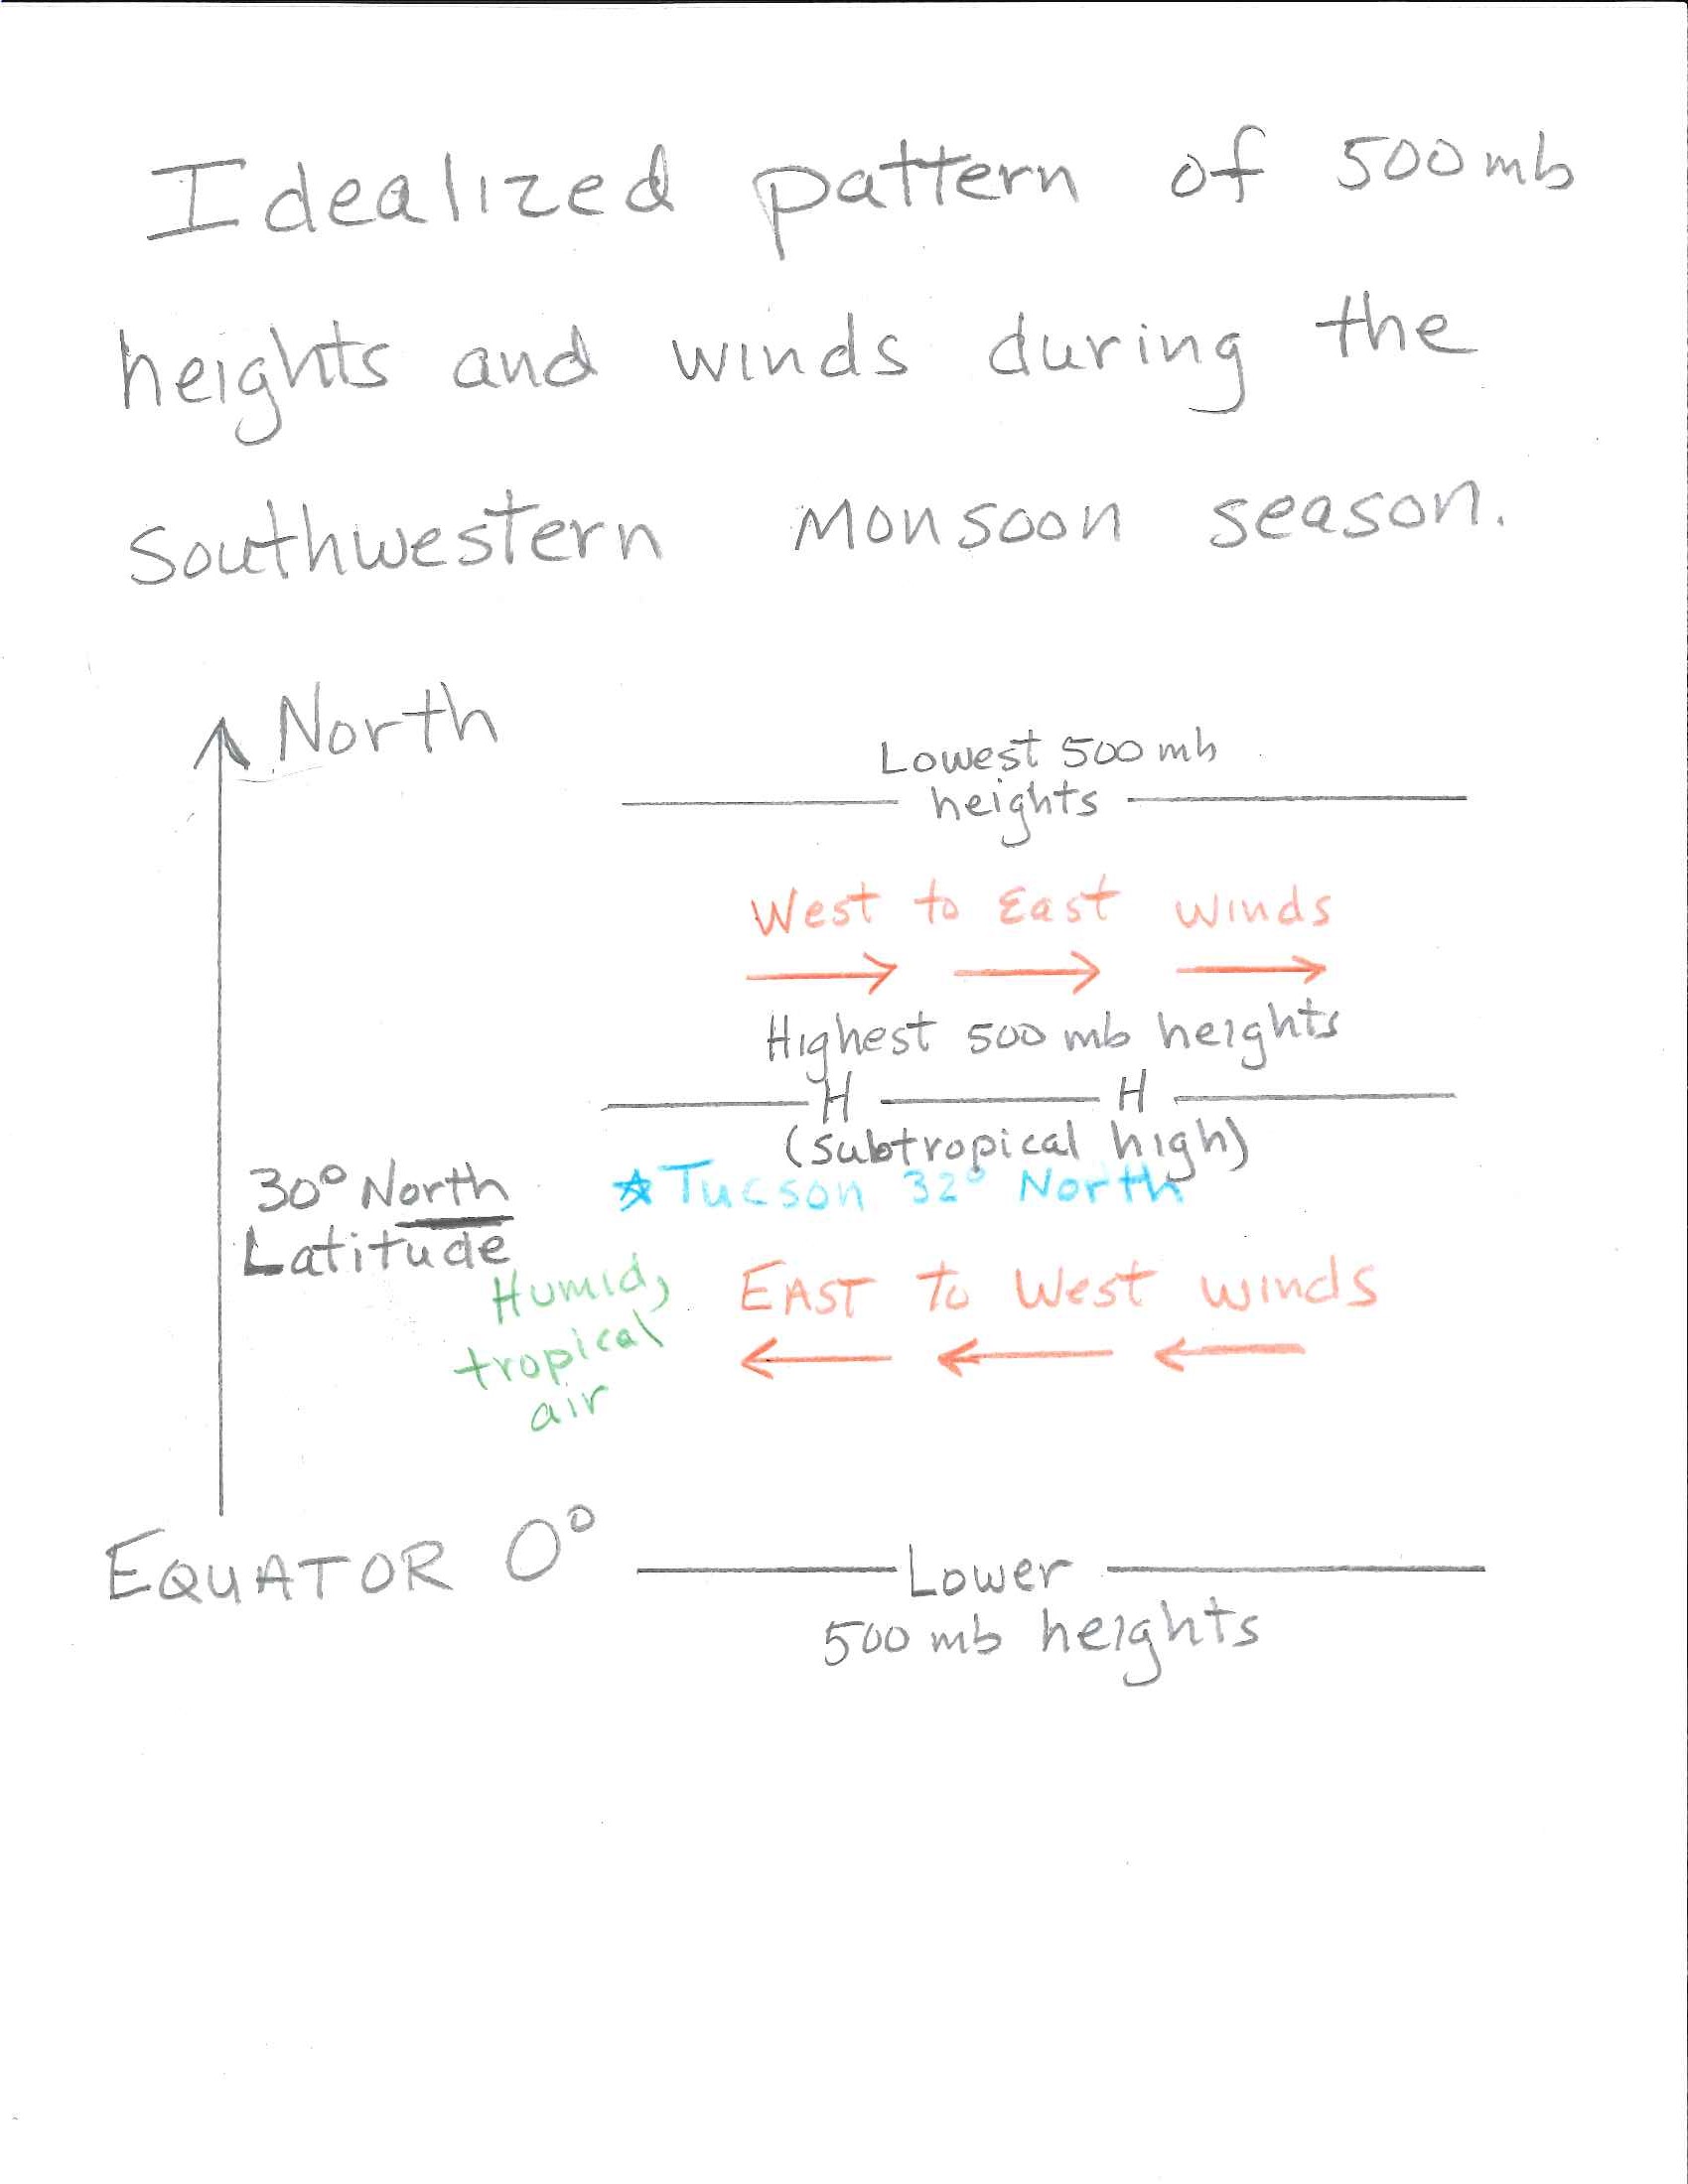
Pattern of 500 mb height and winds in the Northern Hemisphere during the North American Monsoon season. The position of the highest heights, the Subtropical High, has shifted north. Arrows show the 500 mb winds for this 500 mb height pattern. Note that during the monsoon season, the Subtropical High is north of Tucson, which places Tucson within the zone of east to west 500 mb winds. The air in this zone is more humid and tropical, which results in local thunderstorms during the monsoon season. |
The North American Monsoon is associated with the northward movement of the position of the subtropical high that occurs from June through September. As the center of the subtropical high moves to the north of Tucson, the 500 mb winds shift direction to become east to west. This is an indication of the monsoonal wind shift that happens over the southwestern US and northern Mexico. This is shown in the right panel of the figure above. (Here is a link to a similar hand-drawn figure.) During the spring months of the year, the subtropical high pressure cell is south of Arizona, and Arizona experiences generally westerly air flow with generally dry air masses. During the summer monsoon season, the center of the 500 mb subtropical high moves north of Arizona. This places Arizona in generally easterly air flow with much more humid, tropical air masses. The specific center of high heights that forms in this part of the world during the summer season commonly shows up as a closed high on a 500 mb height map and is often called the monsoonal high. Rainfall during the monsoon season is not continuous. It varies considerably, depending on a variety of factors. There are usually distinct "burst" periods of heavy rain during the monsoon, and "break" periods with little or no rain. Monsoon precipitation, however, accounts for a substantial portion of annual precipitation in northwest Mexico and the Southwest U.S. Most of these areas receive over half their annual precipitation during the monsoon season.
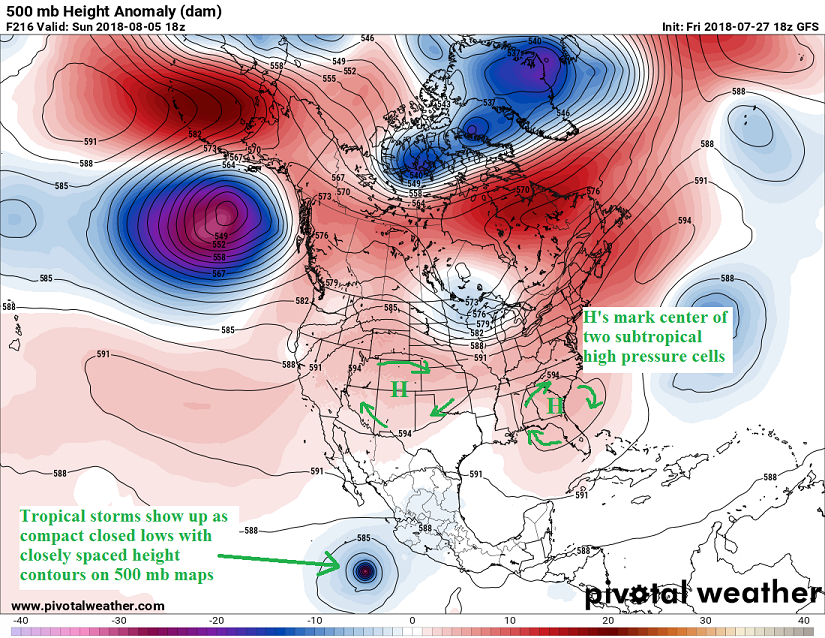
While the images above show the average position of the subtropical high pressure region, most often closed centers of high height, which are known as subtropical high pressure cells, are seen on day to day weather maps as indicated in the example below. The position of these cells are important in determing the character of the monsonal wind pattern in the southwestern United States. Based on the map shown below, the 500 mb winds over Tucson are from the southeast, which is favorable direction for monsoon rain. In addition, the 500 mb winds steer around individual thunderstorms, so any thunderstorms forming near Tucson would likely move from southeast toward northwest. 500 mb winds also help to steer the direction that hurricanes move. As we will see shortly, the position of the subtropical high pressure center near the southeast coast of the United States is a huge factor in determining the path traveled by Atlantic hurricanes and where they may be directed onto the coast. Based on the location of the subtropical high cell over the southeastern US, if there were a tropical storm approaching the United States, it would likely be steered across south Florida and then turn toward the central Gulf coast region. There is not a tropical storm located near the east coast of the US, but there is a tropical storm just off the west coast of Mexico. Tropical storms and hurricanes are reflected as compact closed lows closed lows on 500 mb maps, though the most intense winds usually occur at lower altitudes than the 500 mb level. An example of a tropical storm on a 500 mb height map is indicated over the Pacific Ocean off the Mexican coast on the map below.
|
| Forecast of a 500 mb height pattern for August 8, 2018. |
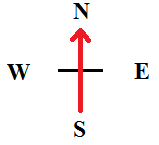
In meteorology, the wind direction is specified as the direction from which the wind is coming, not the direction toward which it is heading. For example, a west wind moves from west toward east. We will often draw arrows on maps showing the 500 mb wind direction. A few examples are shown below.
| 
| 
| 
|
| A south wind (south toward north) | An east wind (east toward west) | A southeast wind (southeast to northwest) | A northeast wind (northeast to southwest) |
A monsoon flow pattern for the southwestern United States is one that has an easterly component to the wind direction. The last three pictures above are examples of a monsoon wind direction for southern Arizona when these wind directions are observed during the months of June through September.
As mentioned above, the typical 500 mb flow over the southwestern United States is generally westerly (west to east). One indicator of the southwest monsoon is to have higher 500 mb heights form to the north of southern Arizona. This results in a wind shift at 500 mb, resulting in 500 mb winds that have an easterly component, i.e., winds from east toward west. This can be understood by applying the rule for 500 mb wind direction. With higher 500mb heights to the north of Tucson and lower 500 mb heights to the south of Tucson, the 500 mb wind direction will be generally east to west.
The meteorological definition of a Monsoon is simply a seasonal shift in wind direction. Often a monsoon season
is also characterized by a shift in precipitation (as it is in the southwestern United States and India), but it need not be.
The term monsoon is often misused, even by many TV weather reporters. It is incorrect to call a summer thunderstorm
a "monsoon" or to say it is "monsooning" outside during a summer thunderstorm. There is a monsoonal shift in winds that
happens every year in the southwestern United States and northwestern Mexico though. This shift in wind patterns is most
easily seen by looking at the seasonal shift in wind direction that occurs at the 500 mb pressure level. Below are links to
higher resolution monthly average 500 mb height maps that have been annotated to show the monsoonal shift in wind direction
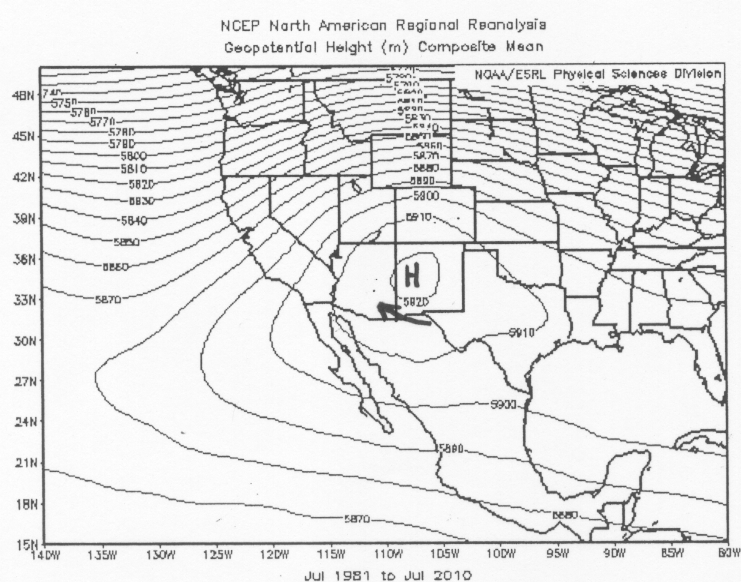
that takes place during the months of July and August over the southwestern United States. In the figures below the 500 mb
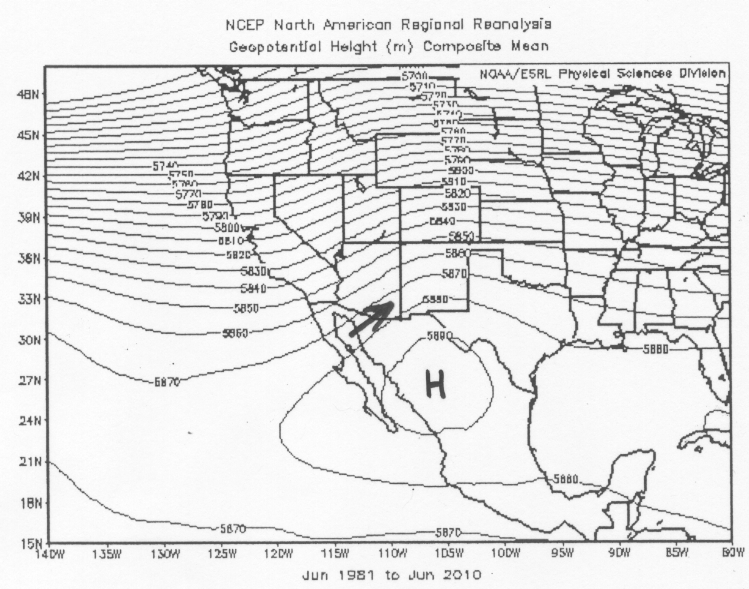
height contours are shown every 10 meters to better show the wind
direction at 500 mb in Tucson. The bold 'H' indicates where the highest 500 mb heights are located in the vicinity of
the southwestern
United States. The bold arrow indicates the 500 mb wind direction in Tucson based on the average height pattern shown.
Notice that the average wind direction is southwest (from the southwest) during the month of June. This is prior to
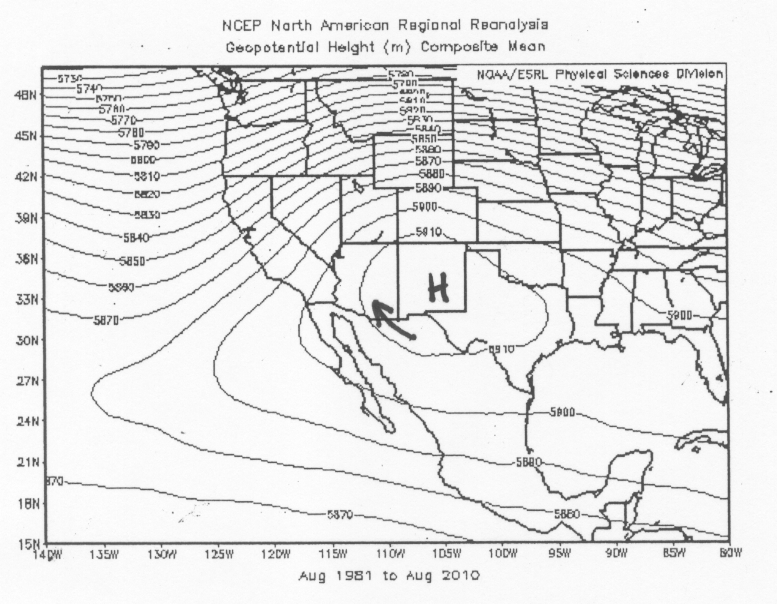
the monsoon season. During the monsoon months of July and August, the 500 mb high moves to the north and
east of Tucson and the average wind direction is from the east and
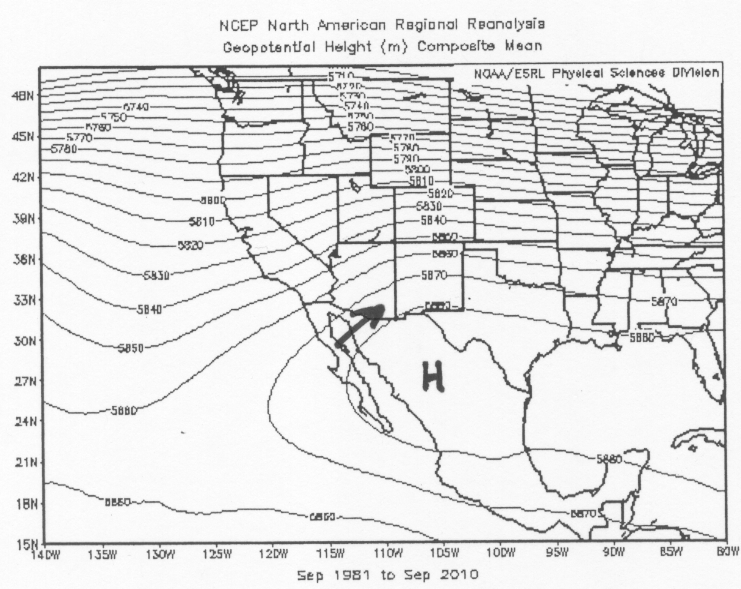
southeast. In September, the high center moves back to the south of Tucson, the wind direction shifts back to southwest,
which indicates the end of the monsoon season.
June Average 500 mb heights and Tucson wind direction
July Average 500 mb heights and Tucson wind direction
August Average 500 mb heights and Tucson wind direction
September Average 500 mb heights and Tucson wind direction
Please also read over the following link, North American Monsoon article by the NWS. You should understand graphics 2 and 3, which show the monsoonal wind shift at the 500 mb height levels (Graphic 1 shows typical wind patterns just above the ground surface during the monsoon season, which we are not covering in this course). Graphic 3 shows one favorable position for the "monsoon high" in the sense that there are southeast winds at 500 mb over Tucson. As long as there is an easterly component to the 500 mb wind direction, Tucson will generally be favored for thunderstorms. Basically if the high center is north of Tucson, there will be an easterly component to the 500 mb wind direction. The chance for thunderstorms also depends on whether or not there is sufficient water vapor in the atmosphere as discussed in the later section.
In reality, the local 500 mb height pattern changes from day to day and a monsoonal height and wind pattern comes and goes throughout the months of June through September. The officially defined monsoon season runs from June 15 through September 15, though the center of the monsoon high shifts around and is not expected to be north of Tucson during this entire period. It is common for there to be periods of several days to a week with favorable conditions for thunderstorms followed by several days to a week of unfavorable conditions. When the center of highest heights is south of Tucson, rain generally does not fall in Tucson. Worse yet, when the high center is directly overhead, not only is it generally rain-free, but also quite hot as the core of warmest air is right over us. The best chances for summer rains in Tucson happen when the 500 mb high center is north of our area. This 500 mb map from June 26, 2017 is an example of a 500 mb height pattern that is unfavorable for summertime thunderstorms in Tucson. On that map, there is a high center located to the southwest of Tucson, and the 500 mb windflow over Tucson is from the northwest, which is not favorable for clouds and rain, since the wind is coming from a westerly direction. Notice that the 500 mb height over Tucson is about 5930 meters, which is above the June average of 5870 meters. Thus, we expect above average temperature and no rain for Tucson based on the map for June 26.
An example of a 500 mb height pattern which is more favorable for thunderstorms in Tucson is shown in the 500 mb map for July 9, 2017 . On that map a huge closed high is located over the center of the country, which is well north of Tucson. The huge 594 decameter closed contour runs right across Arizona. The 500 mb wind direction over Tucson is from an easterly direction, which is a monsoon flow. The 500 mb height over Tucson is about 5930 meters on this map. This is slightly above the average height of 5920 meters for July. Thus, we expect near to slighlty above average temperature with a chance of monsoon season rain for Tucson based on the map for July 9.
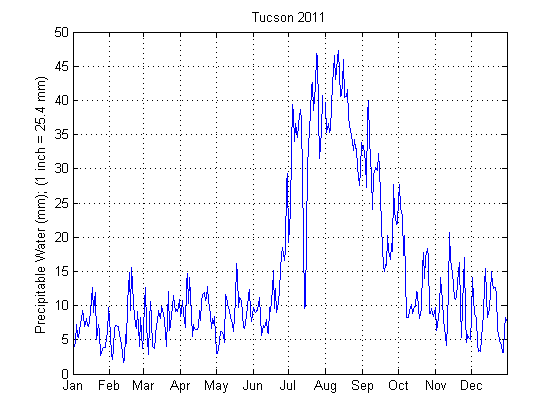
The monsoon season happens every year in the southwestern United States. While a monsoon is defined by the seasonal change in winds, monsoons are often associated with changes in humidity and precipitation. The change in water vapor content during the North American Monsoon is obvious when looking at the changes in precipitable water over a year, for example, Tucson daily average precipitable water for 2011.
The monsoon season in southern Arizona runs roughly from June 15 through September, so this is not something we can do in real time during the spring semester. If you are interested in what you may want to look for on 500 mb height maps for monsoon season forecasting, please read the remainder of this section.
Two example 500 mb maps from summer 2017 are shown below. The 500 mb pattern on the left is unfavorable for monsoon season storms in Tucson, while the 500 mb pattern on the right is a favorable pattern for monsoon season storms in Tucson as explained in the text following the images.
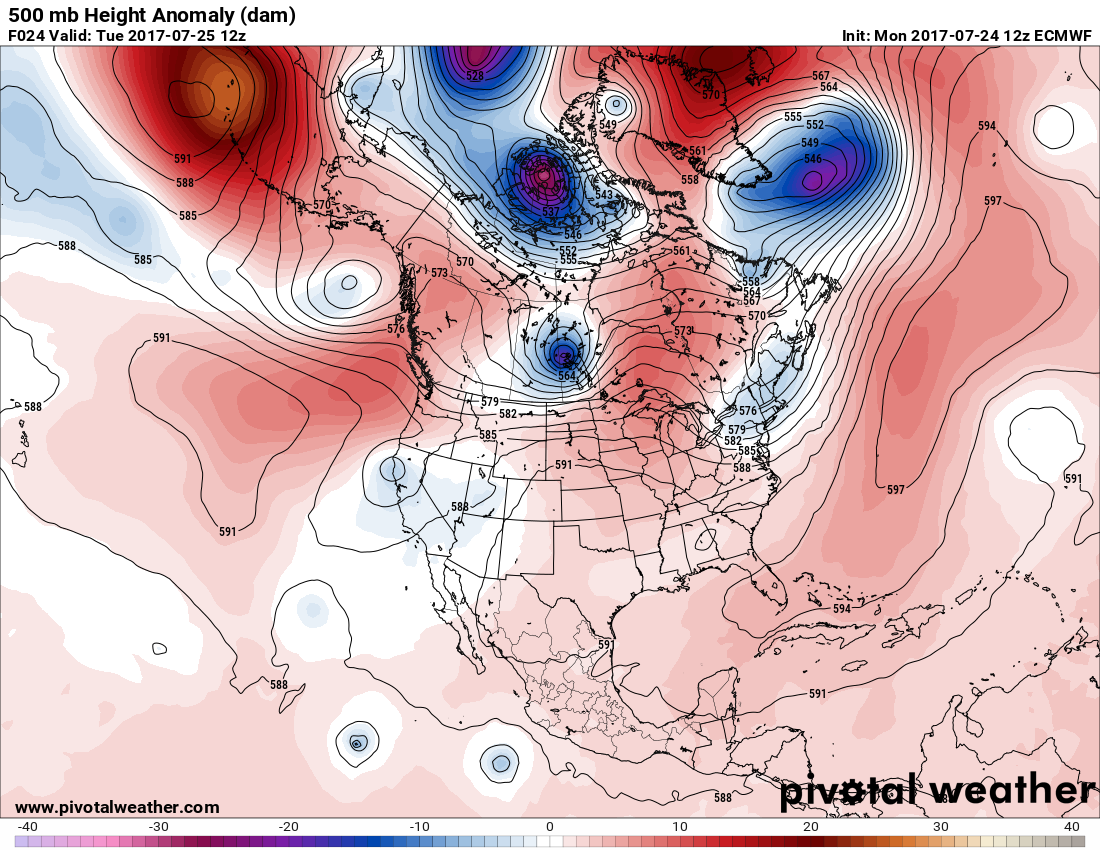
Map of the forecast 500 mb height pattern for July 25, 2017 at 12Z. This is an example of an unfavorable pattern for monsoon storms in Tucson. Click on the image above to open a larger version. |
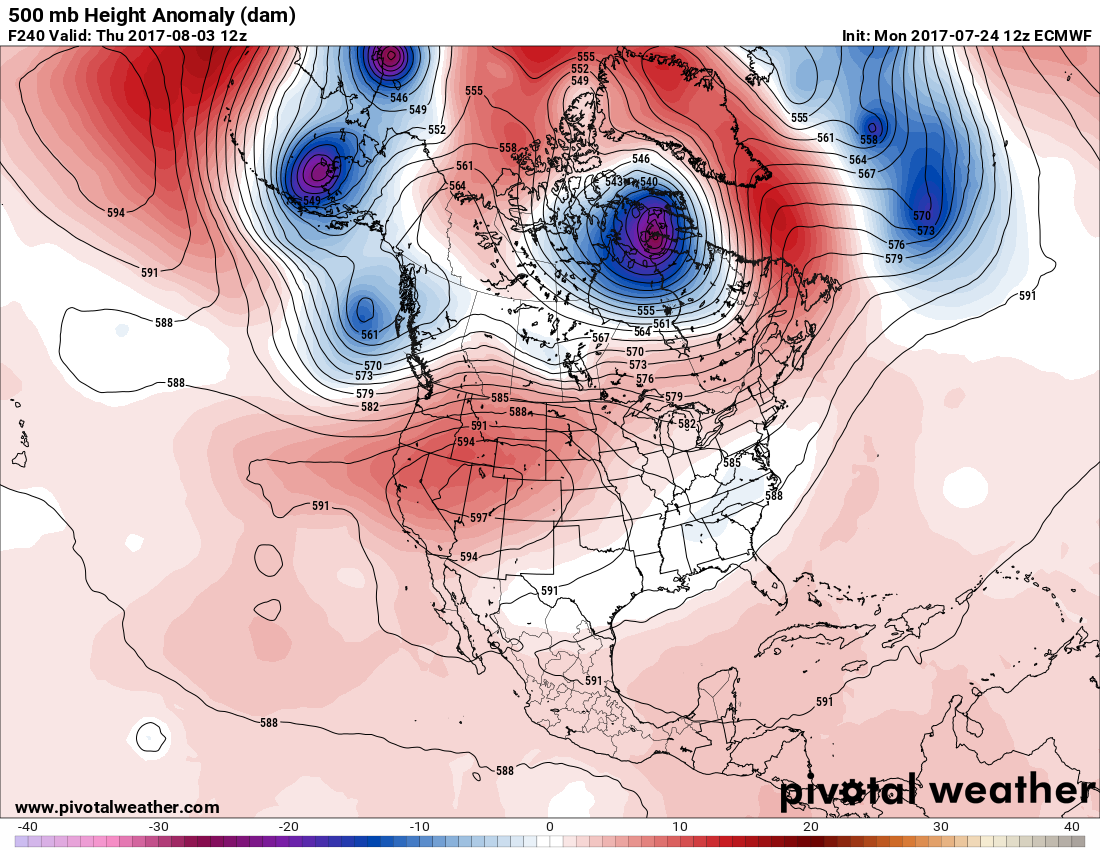
Map of the 500 mb height pattern forecasted for August 3, 2017 at 12Z. This is an example of a favorable pattern for monsoon storms in Tucson. Click on the image above to open a larger version. |
As mentioned above, the 500 mb wind direction over Tucson is used to determine if the weather pattern is favorable for monsoon season storms in Tucson. The pattern is favorable when the 500 mb wind over Tucson is from an easterly direction and unfavorable when the 500 mb wind over Tucson is from a westerly direction. Favorable directions are from the northeast, east, or southeast, while unfavorable directions are from the northwest, west, or southwest. Keep in mind that this simple rule is only valid during the summer monsoon season, which runs from the middle of June through the middle of September, and does not apply to rain chances during the cooler seasons.
The map on the left for July 25, 2017 is unfavorable for monsoon season storms because the 500 mb wind direction over Tucson is from the southwest. The 500 mb wind is parallel to the height contour with lower heights to the left of the wind direction and higher heights to the right. The 5910 meter contour line is directly over Tucson with lower 500 mb heights to the left (west) and higher 500 mb heights to the right (east). The wind direction is along the 5910 contour line from the southwest toward the northeast. (NOTE. This direction is close to south to north, but there is a clearly a westerly component to the direction, which makes it unfavorable for monsoon season storms in Tucson). Another indication that this 500 mb height pattern is not a favorable monsoon pattern is that there are not higher 500 mb heights to the north of Tucson. Moving northward from Tucson (where the 500 mb height is about 5910 m), the 500 mb height trends lower than 5910 meters.
The map on the right for August 3, 2017 is favorable for monsoon season storms because the 500 mb wind direction is from the northeast. This map has a large closed high over the state of Utah. The 500 mb wind flow around a closed high is clockwise, which results in a wind flow from the northeast toward the southwest over Tucson. Because there is an easterly component to the 500 mb wind over Tucson, this is a favorable weather pattern for monsoon season storms. Note that in this case, there are higher 500 mb heights to the north of Tucson, which indicates a favorable monsoon pattern.
We can also make estimates for the air temperature in Tucson relative to average based on the 500 mb height pattern. The average 500 mb height over Tucson for late July and early August is about 5920 meters. The map for July 25 has a 500 mb height of about 5910 meters over Tucson. This is slightly below the average of 5920 meters, so expect the air temperature to be near to slightly below average based on the 500 mb height. The map for August 3 has a 500 mb height of about 5930 meters over Tucson. This is slightly above the average of 5920 meters, so expect the air temperature to be near to slightly above average based on the 500 mb height.
As mentioned above, beside the wind pattern, the amount of available water vapor in the atmosphere, the precipitable water, is important to whether or not thunderstorms will form and how much rain may fall. The use of precipitable water forecasts will not be emphasized in this course, but if you are interested here is a link to the lastest GFS forecast of precipitable water vapor from Pivotal Weather. On these maps, the precipitable water is indicated with color contours (key at bottom of images). The labeled contours are isobars, which show the pattern of sea level air pressure.
As you may know if you are from Tucson or as you may learn if you follow local weather during the monsoon season, accurately predicting whether or not Tucson will get thunderstorms on a given day is very difficult. Looking at forecasts of the 500 mb height pattern, we can determine if the large scale weather pattern and winds are favorable for monsoon season thunderstorms, but making precise forecasts for exactly where thunderstorms will form and move is much more difficult. The department of Atmospheric Sciences runs a local weather model, which makes forecasts for a portion of the southwest US and northwest Mexico. If you are interested in an alternative weather forecast for Tucson, check out Regional Weather Forecast Models and Products for southeast Arizona from ATMO WRF Model. Keep in mind that we have only covered a few aspects about thunderstorm formation during the monsoon season. There is much more to consider when forecasting the possibility of thunderstorms on a given day. Some of these, such as instability in the atmosphere, which is required for thunderstorms and favorable wind shear profiles, which is how the horizontal winds change with increasing height, will be covered later in the semester.
![]()
![]()
![]()
![]()