Once the
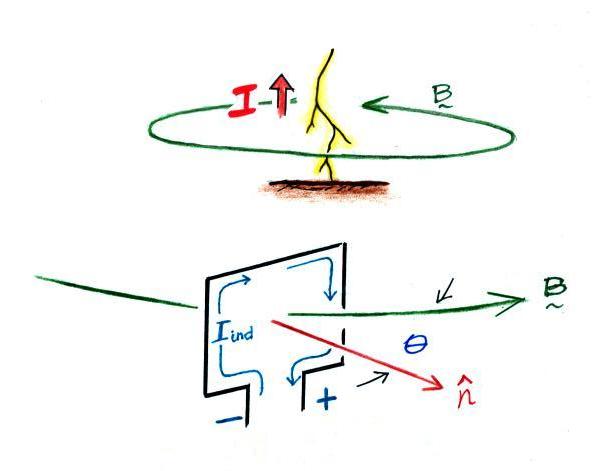
distance to the discharge is determined, the B
field amplitude (assumed to be purely
radiation field) can be used, together with an
assumed return stroke propagation velocity, in
the transmission line model to estimate the
peak current in the stroke. You could
also use the E field to estimate peak
current. The magnetic direction finding
technique is the only one that can provide
estimates of peak current amplitudes.
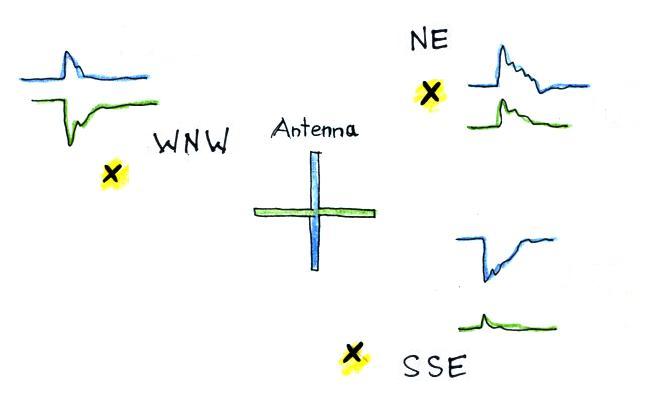
The orthogonal loop antennas used in
one of the prototype lightning locating
systems was a PVC pipe structure perhaps 8
feet tall. A picture of that antenna and
the next generation antenna, maybe only 2 or 3
feet tall is also shown in "Lightning
Direction-Finding Systems for Forest Fire
Detection," E.P. Krider, R.C. Noggle, A.E.
Pifer, and D.L. Vance, Bull. Am. Meteorol.
Soc., 61, 980-986, 1980 (link to
a PDF file). The current
sensor is considerably smaller.
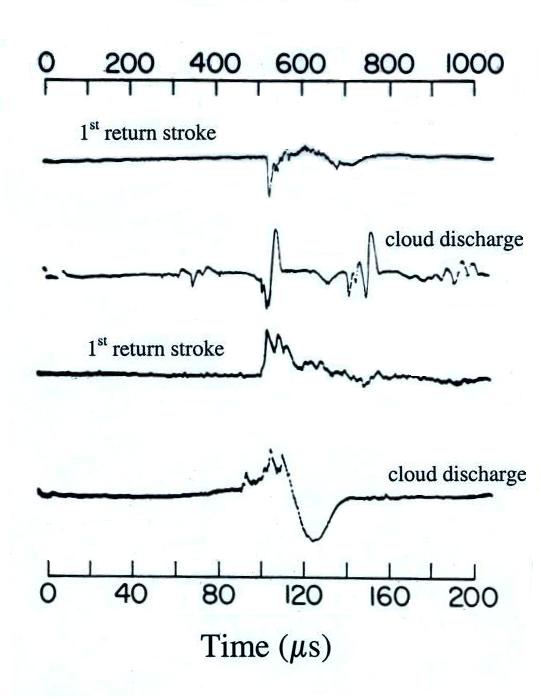
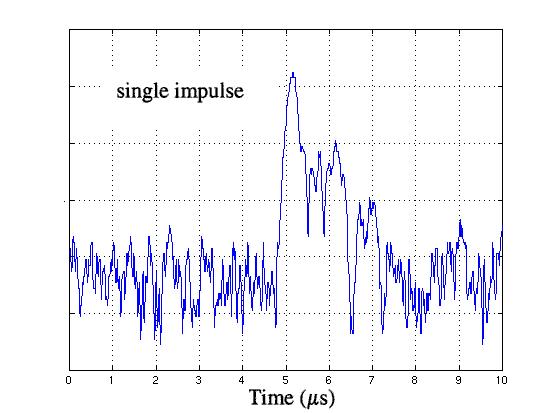
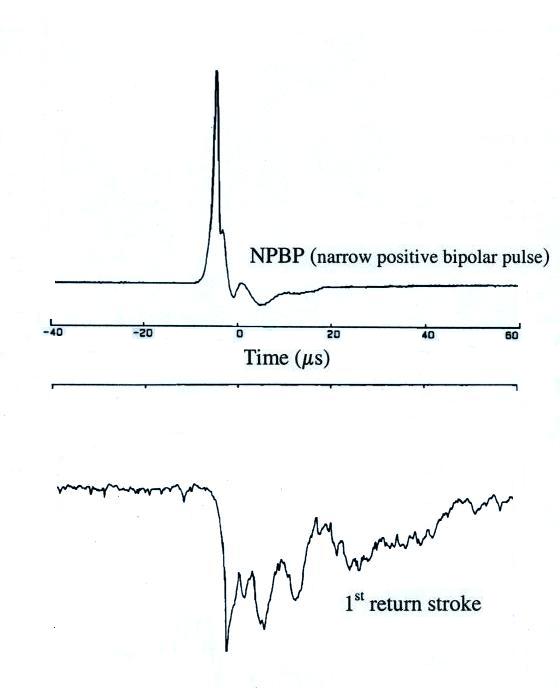
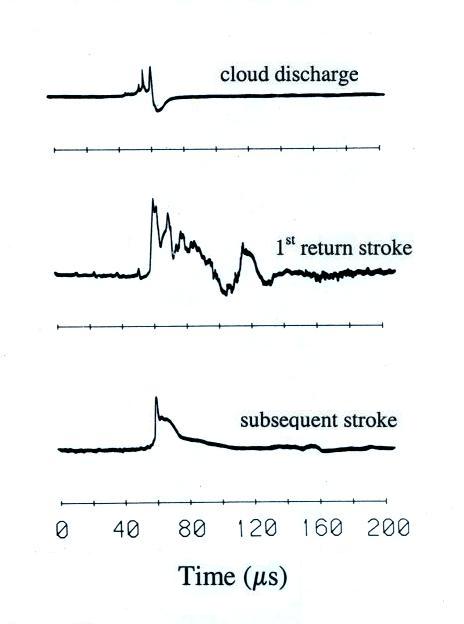
Some typical large amplitude cloud discharge
and return stroke waveforms are shown below
|
|
In the
original magnetic direction finding
systems the lightning waveform was
subjected to a series of waveshape
tests. The main objective being to
discriminate between return stroke
waveforms and waveforms from large
amplitude cloud discharges. We have
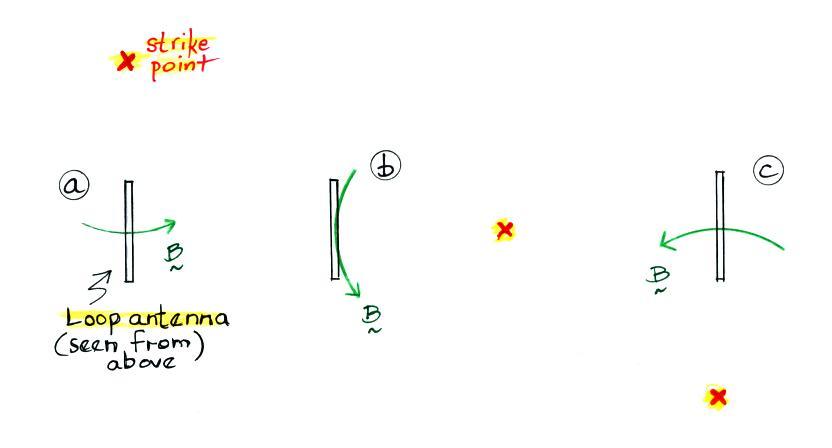
implictly been assuming in our discussion
that the lightning channel is vertically
oriented. This is a pretty
reasonable assumption for cloud-to-ground
discharges, especially at the time of peak
field when the return stroke is close to
the ground. The unknown tilt of
cloud discharge channels will add
significant errors to the estimate of
bearing angle.
The narrow positive bipolar pulse
(NPBP) shown in the figure at right
(together with a 1st return stroke
waveform for comparison) is an as yet
unidentified cloud discharge of some kind
and produces particularly strong VHF
radiation (the figure was adapted fromJ.C.
Willett, J.C. Bailey, and E.P. Krider,
"A Class of Unusual Lightning Electric
Field Waveforms with Very Strong
High-Frequency Radiation," J. Geophys.
Res., 94, 16255-16267, 1989).
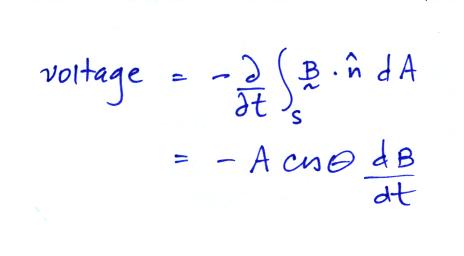
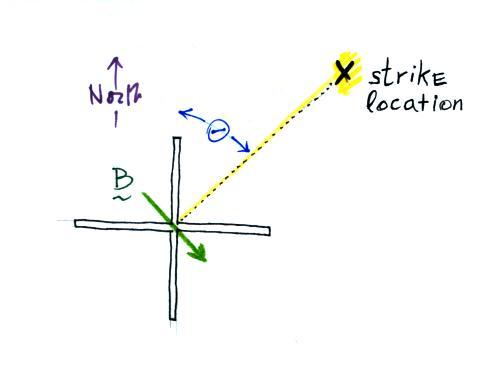
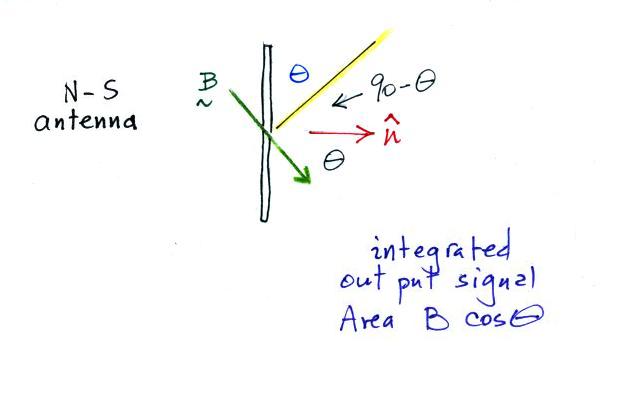
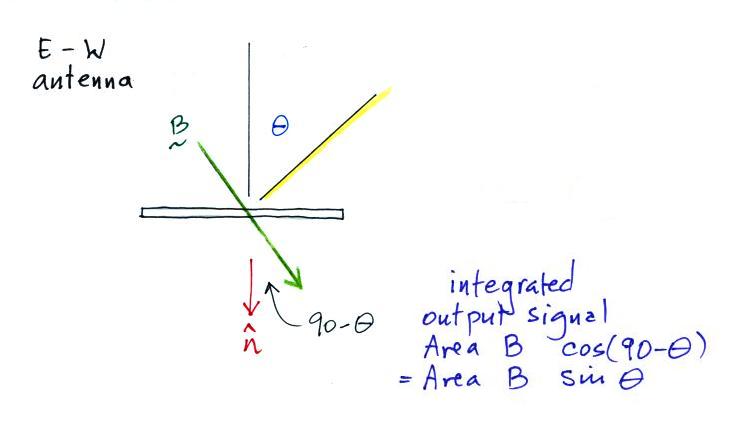
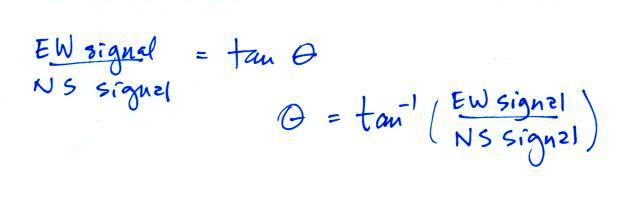
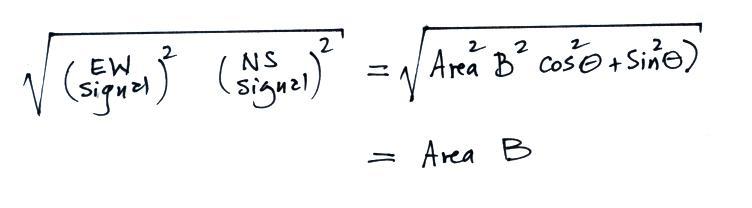
If the waveform passes the waveshape
tests, the peak amplitudes of the NS and
the EW signals are measured. At the
time of peak signal, the return stroke is
probably within about 100 m of the
ground. Estimating the bearing angle
at this time is advantageous because you
eliminate the effects of channel branches,
the channel is usually fairly straight and
vertical, and you're locating the point at
which the stroke actually struck the
ground.
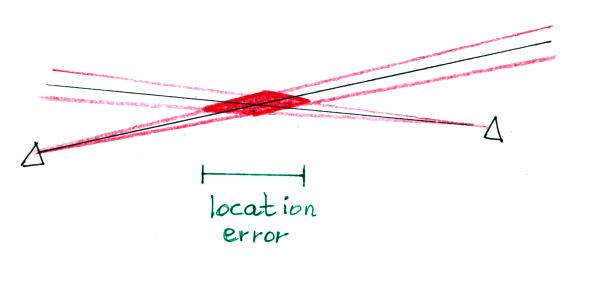
Once bearing angle estimates are made
at multiple DF sensor locations, you can
then triangulate to locate the lightning
strike point. Errors in
the bearing angle estimate of course lead
to uncertainty in the lightning strike
location.
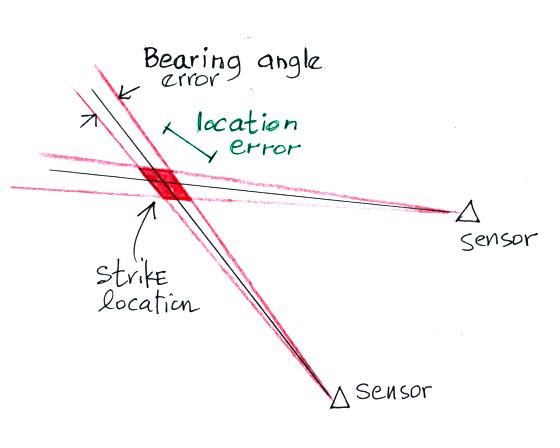
Here
we see the location determined using
bearing angles from only 2 sensors
(the minimum number required).
In the current NLDN network return
strokes with a current of 25 kA would
be detected by 6-8 sensors.
There are sophisticated methods for
determining the optimal location with
redundant data like that.
Large location errors can be
present when a lightning strike is on
or near a baseline between two
sensors.
In some of the original direction finder
networks the signal amplitudes were used to
reduce the errors in locations on or near a
baseline like this. Now, of course, most
strokes are detected at multiple
stations. Some of the other sensors
would be off the baseline and would provide
more accurate location information. As
we shall see the newer sensors also determine
the time of arrival of the lightning signal at
each sensor which provides additional
independent location data.
One of the first uses of DF systems
to locate lightning that might cause forest
fires in Alaska and the western US. For
this application, relatively larger location
errors (4 to 8 km) were acceptable.
Later as lightning location data began to be
used by the power industry and insurance
companies it became evident that
sufficient location accuracy would not be
possible using only magnetic direction finding
unless sensors were on the order of 100 km
apart. Operation of a network covering
the continental US with that kind of density
would be too expensive (in the current network
sensors are roughly 300 to 350 km apart and
there are about 100 sensors covering the
continental US).
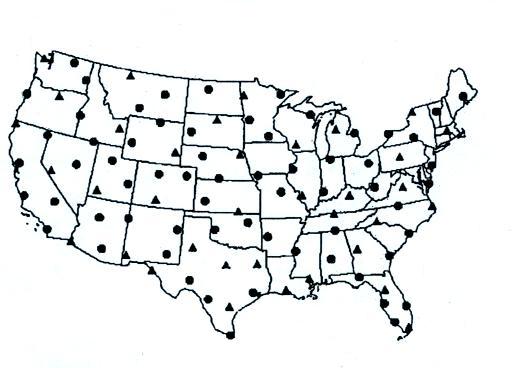
A need for greater location accuracy
eventually led to development of the so-called
IMPACT sensor (improved accuracy from combined
technology) that utilized both MDF and
TOA. The NLDN as configured in the late
1990s is shown below (from K.L.
Cummins,
M.J.
Murphy,
E.A.
Bardo,
W.L.
Hiscox,
R.B.
Pyle
and
A.E.
Pifer,
"A
Combined
TOA/MDF
Technology
Upgrade of the U.S. National Lightning
Detection Network," J. Geophys. Res., 103,
9035-9044, 1998).
IMPACT sensors are shown with
triangles, LPATS sensors with circles.
The LPATS sensors were from a
lightning location network using just the TOA
technique manufactured by Atmospheric Research
Systems (ARSI) that had been installed in the
US in the late 1980s. The IMPACT sensor
was designed and manufactured by Lightning
Location & Protection, Inc. (LLP).
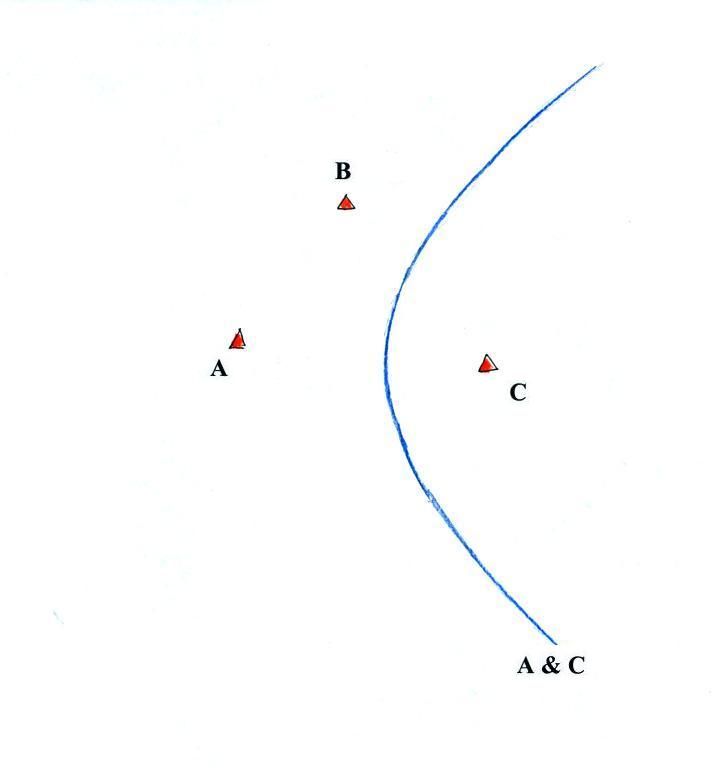
We will consider briefly the TOA technique
below. We assume that all three stations
in the figure have either precisely
synchronized clocks or accurate absolute
timing (GPS timing).
There will be a constant difference in the
time of arrival of a signal at Stations A and
C from lightning striking anywhere on the blue
curve (a hyperbola).
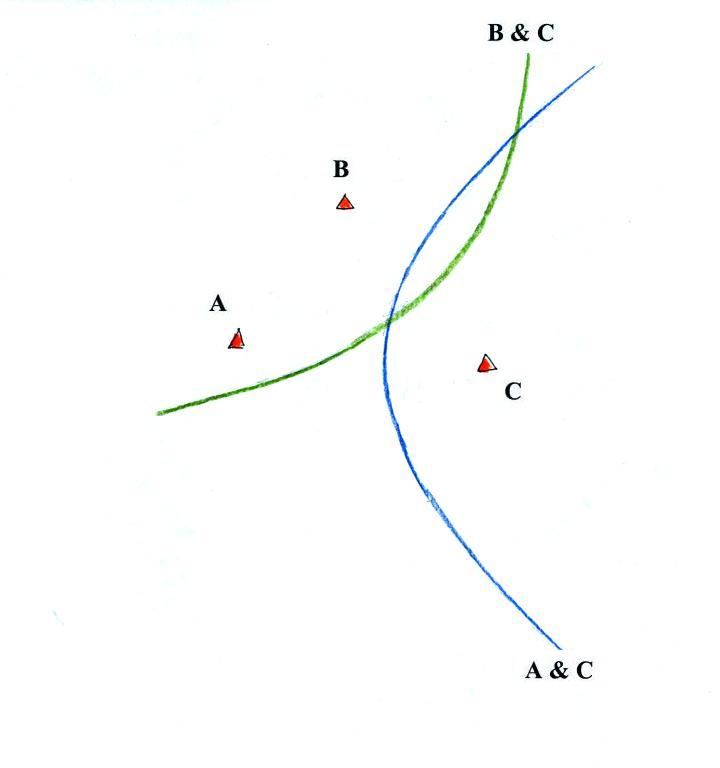
Similarly a hyperbola of constant TOA
difference for Sensors B & C can be
drawn. The two curves intersect at two
points.
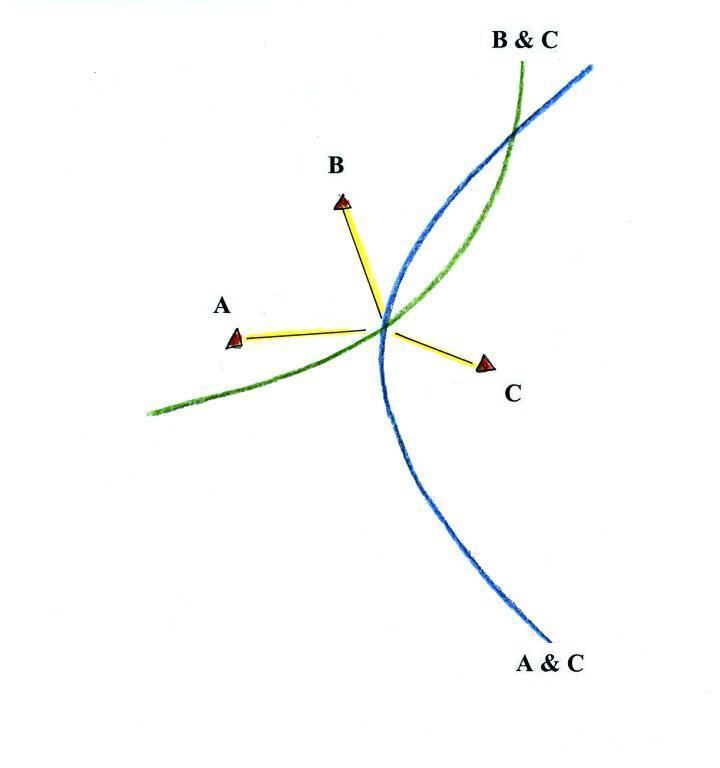
You could resolve the location ambiguity by
using magnetic bearing angles from the 3
sensors as shown above.
Note
that drawing the third hyperbola, the curve of
constant TOA difference for sensors A & B
would not resolve the ambiguity. This is
because information from stations A and B was
already used in drawing the two initial (blue
and green) hyperbolas.
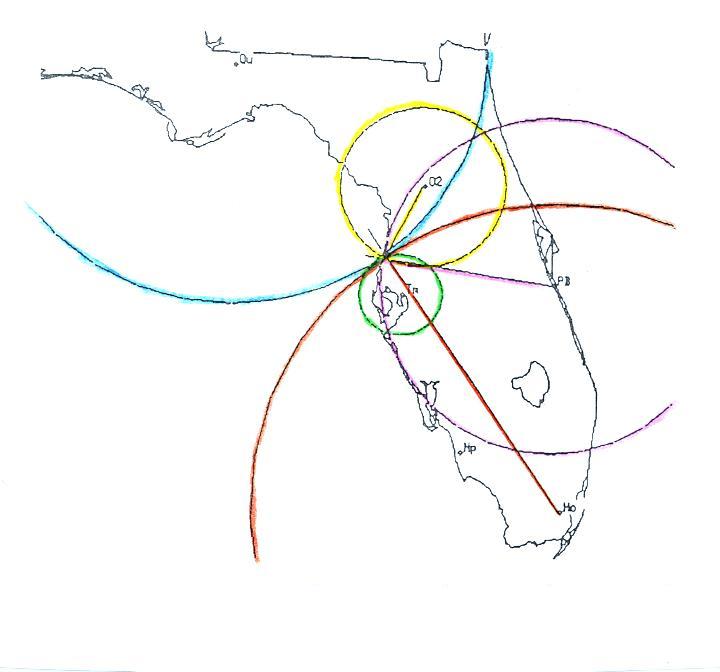
The figure below shows an actual example of
a discharge located using data from 5 stations
in the NLDN (from the Cummins et al. article
mentioned above).
Three IMPACT sensors (highlighted in brown,
purple, and yellow) provide TOA information
and bearing angle data. Two LPATS
sensors (at the centers of the blue and green
circles) provided just TOA data. Thus 8
independent pieces of information were used to
locate this discharge.
A more recent network upgrade (see Cummins
et al. in the Second Conference on
Meteorological Applications of Lightning Data,
Atlanta GA, 2006) was done in 2002 and all of
the IMPACT and LPATS sensors were replaced
with IMPACT ESP sensors. The ESP
(enhanced sensitivity and performance) sensors
provide both MDF and TOA information.
The sensors are more sensitive and have faster
processing times. These improvements
have increased the detection efficiency for
low amplitude return strokes. The new
sensors also have the capability of detecting
and locating some intracloud discharges.
Lightning location data from the
NLDN is now being used in a wide variety of
applications and it would seem appropriate to
briefly discuss some recent attempts to
measure the network detection efficiency and
location accuracy.
Video ground truth data is probably the most
common method of checking network
performance. Images of lightning strikes
captured by two or more video cameras can be
used to triangulate and determine strike
locations just as is done with data from the
MDF antennas. The table below summarizes
results collected from a small network of
cameras operated in and around Albany, NY, in
1993, 1994, and 1995 (Idone et al. 1998a
& 1998b;
full citations are given at the end of this
section). Fast E field data were also
recorded. An upgrade of the NLDN, a
switch from using just MDF to a network
combining MDF and TOA techniques, was started
and completed during the period of this
experiment. This is the network shown
above that consisted both of IMPACT and LPATS
sensors.
Albany, NY
Year
|
Flash DE
|
Stroke DE
|
Location
Accuracy
|
Comments
|
1993
|
67%
(517 flashes)
|
---
|
|
NLDN
data for individual strokes
wasn't available at this time
|
1994
|
86%
(893 flashes)
|
67%
(2162 strokes)
|
2.61 km
(median NLDN-video location
separation)
|
a
greater number of NLDN sensors in
the region
at the beginning of the upgrade may
explain the
higher detection efficiencies
observed in 1994
|
1995
|
72%
(433 flashes)
|
47%
(1242 strokes)
|
435 m
|
the
number of NLDN sensors in the Albany
area was decreased slightly in 1995
at the
conclusion of the network upgrade
|
Video data does have some limitations.
First, the time resolution is somewhat
limited. A conventional
video camera acquires 30 frames per
second. Each frame consists of two
interlaced fields which can be displayed
separately during playback. Video
is not be able to resolve two strokes that
occur within the same video field, i.e. within
a time of 16.7 ms. And, actually, two
strokes that occur on successive fields might
be judged to be the same stroke if there is a
long and luminous continuing current following
the first stroke. On the other hand a
rebrightening of the lightning channel caused
by an M component might be counted as separate
stroke. Some of these uncertainties can
be resolved using a simultaneous record of
fast E field changes. It is practical to
only cover a relatively small area with a
video camera network.
The study above shows a slight improvement in
DE after the network wide upgrade (72% vs
67%). There was a marked increase in LA
(435 m vs 2.61 km). Locations and peak E
field values were available for 92 strokes in
the study. The DE was shown to be a
function of peak stroke current:
39 of 40 strokes
with peak currents greater than 14 kA
were detected by the NLDN
18% of strokes
with peak currents between 6 and 10 kA
were detected
no strokes
with peak currents below 6 kA
were detected
During the Albany experiment lightning was
observed to strike a couple of tall buildings
and a radio tower. 11 of these strokes
were detected and located by the NLDN.
The mean difference between the known strike
location and the NLDN location was 518
m. 10 strokes to a tall radio tower were
also captured on video (1 of the strokes was
detected by the NLDN). The mean
difference between the known strike location
and the video location was 38 m; this provided
a good check on the accuracy of the video
locations.
In 2002-2003 the NLDN underwent another major
upgrade wherein all of the IMPACT and LPATS
sensors were replaced with IMPACT ESP
(enhanced sensitivity and performance)
sensors. This was done partly to
improved DE and LA near the boundaries of the
network. The table below summarizes
measurements of DE made by Biagi
et al. 2007 in southern Arizona, Texas,
and Oklahoma.
Southern
Arizona
Year
|
Flash DE
|
Stroke DE
|
Corrected
stroke DE
|
2003
|
95%
(671 flashes)
|
78%
(2290 strokes)
|
70%
|
2004
|
91%
(426 flashes)
|
73%
(1330 strokes)
|
66%
|
Overall
|
93%
(1097 flashes)
|
76%
(3620 strokes)
|
68%
|
Texas and
Oklahoma
Year
|
Flash DE
|
Stroke DE
|
Corrected
stroke DE
|
2003
|
81%
(59 flashes)
|
75%
(126 strokes)
|
|
2004
|
94%
(308 flashes)
|
87%
(756 strokes)
|
|
Overall
|
92%
(367 flashes)
|
86%
(882 strokes)
|
77%
|
Data were collected with just a single video
camera so the location accuracy was not
measured. Simultaneous fast time
resolved measurements of fast E field and
optical signals were also made. These
data were used to estimate that about 13% of
the strokes were not resolved on the video
because of the 16.7 ms video field integration
time. This was used to determine the
corrected stroke DE values above.
Clearly the increased sensitivity of the
IMPACT ESP sensors has improved the DE.
With this comes the possibility, however, that
more low amplitude cloud discharge signals
will be detected by the NLDN and mistakenly
classified as cloud-to-ground (CG)
discharges. The data of Biagi
et
al.
2007 indicate this is a problem
primarily for positive polarity signals.
Positive
Polarity (TX and OK only)
peak current
|
confirmed as
CG discharges
|
Ipk ≤ 10 kA
|
1.4 - 7%
|
| 10 kA < Ipk
≤ 20 kA |
4.7 - 26%
|
20 kA < Ipk
|
67 - 97%
|
Negative
Polarity (S. AZ, TX, and OK)
peak current
|
confirmed as
CG discharges
|
Ipk ≤ 10 kA
|
50 - 87%
|
As a final example we will give results from a
couple of studies of NLDN performance in
Florida using rocket triggered lightning (see
Jerauld
et
al.,
2005 and Nag
et al., 2011).
Jerauld
et al. study (data
from 2001-2003)
|
Flash DE
|
Stroke DE
|
Location
Accuracy
|
Overall
|
84%
(31 of 37 flashes)
|
60%
(95 of 159 strokes)
|
600 m
median (NLDN - known location)
difference
|
Nag et al. study (data
from 2004-2009)
|
Flash
DE
|
Stroke
DE
|
Location
Accuracy
|
Overall
|
92%
(34 of 37 flashes)
|
76%
(105 of 139 strokes)
|
308 m
median (NLDN - known location)
difference
|
Detection efficiency was again found
to depend on return stroke peak current.
Essentially 100% of strokes with a peak
current greater than 20 kA were
detected. Roughly 90% of the strokes
with currents between 10 and 20 kA were
detected. 60% of strokes with currents
between 5 and 10 kA were detected and no
strokes with currents less than 5 kA were
detected. These data are from the Nag et
al. study.
These studies involving triggered light also
allows a comparison between estimates of peak
stroke current derived from the NLDN data with
direct measurements of current. This was
discussed in the Wed.,
March 25 class.
List of
references cited in this section
Biagi,
C.J.,
K.L.
Cummins,
K.E.
Kehoe,
and
E.P. Krider, "National Lightning Detection
Network (NLDN) performance in southern
Arizona, Texas, and Oklahoma in 2003-2004,"
J. Geophys. Res., 112, D05208,
doi:10.1029/2006JD007341, 2007.
Cummins,
K.L.,
J.A.
Cramer, C.J. Biagi, E.P. Krider, J. Jerauld,
M.A. Uman, V.A. Rakov, "The U.S. National
Lightning Detection Network: Post-Upgrade
Status, in the 2nd Conference
on
Meteorological
Applications of Lightning Data, AMS Annual
Meeting, Atlanta GA, 2006.
Idone,
V.P.,
D.A.
Davis,
P.K.
Moore,
Y.
Wang, R.W. Henderson, M. Ries, and P.
Jamason, "Performance evaluation of the U.S.
National Lightning Detection Network in
eastern New York 1. Detection efficiency" J.
Geophys. Res., 103, 9045-9055, 1998a.
Idone,
V.P.,
D.A.
Davis,
P.K.
Moore,
Y.
Wang, R.W. Henderson, M. Ries, and P.
Jamason, "Performance evaluation of the U.S.
National Lightning Detection Network in
eastern New York 2. Location accuracy," J.
Geophys. Res., 103, 9057-9069, 1998b.
Jerauld,
J.,
V.A.
Rakov, M.A. Uman, K.J. Rambo, D.M. Jordan,
K.L. Cummins and J.A. Cramer, "An evaluation
of the performance characteristics of the
U.S. National Lightning Detection Network in
Florida using rocket-triggered lightning,"
J. Geophys. Res., 110, D19106,
doe:10.1029/2005jD005924, 2005.
Nag,
A. S. Mallick, V.A. Rakov, J.S. Howard, C.J.
Biagi, J.D. Hill, NM.A. Uman, D.M. Jordan,
K.J. Rambo, J.E. Jerauld, B.A. DeCarlo, K.L.
Cummins and J.A. Cramer, "Evaluation of U.S.
National Lightning Detection Network
performance characteristics using
rocket-triggered lightning data acquired in
2004-2009", J. Geophys. Res., 116, D02123,
doi:10.1029/2010JD014929, 2011.