Wednesday Apr. 10, 2013
click here to download today's notes
in a more printer friendly format
I hadn't heard anything from the Buena Vista Social
Club for a while so I found some songs on YouTube. You
heard "Candela"
before class. "Chan Chan"
and "Hasta
Siempre Commandante" are also nice.
The recent Optional Assignment on Forces and Winds has been graded
and was returned in class today. Answers
are also available.
Don't forget the Optional
Toilet Flushing Assignment/Experiment. Email me your
observation before 5 pm on Friday.
We went back to something I presented very poorly at the end of
class on Monday - spinning winds. This time I put everything
on a handout.
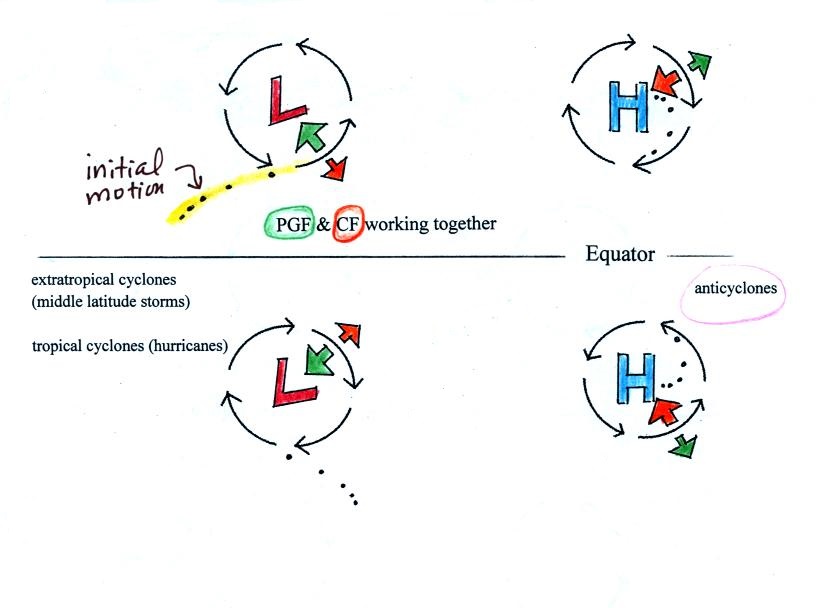
This first figure shows large scale upper levels winds.
There's a lot going on here and you should be able to analyze
the heck out of it. I've mentioned the term cyclone
before. Cyclone just means winds spinning around low
pressure. The other possibility is winds spinning around a
center of high pressure - those are called anticyclones.
This is the part that came out badly at the end of class on
Monday. There are situations where the Coriolis force is
much weaker than the pressure gradient force. Spinning winds
are still possible around centers of low pressure but not high
pressure. Do you see why. In the case of low pressure
the PGF points inward, and an inwardly pointing force of some kind
is needed to keep winds spinning in a circular path. Note
that both clockwise and anticlockwise spin are possible around low
pressure in both the northern and southern hemispheres.
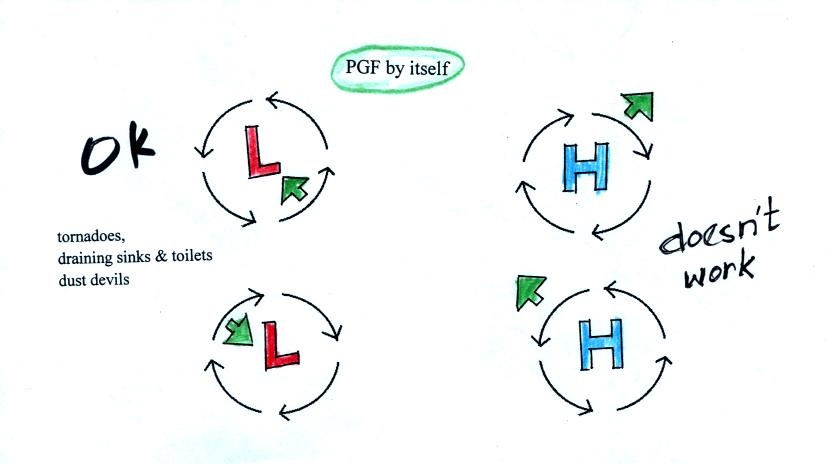
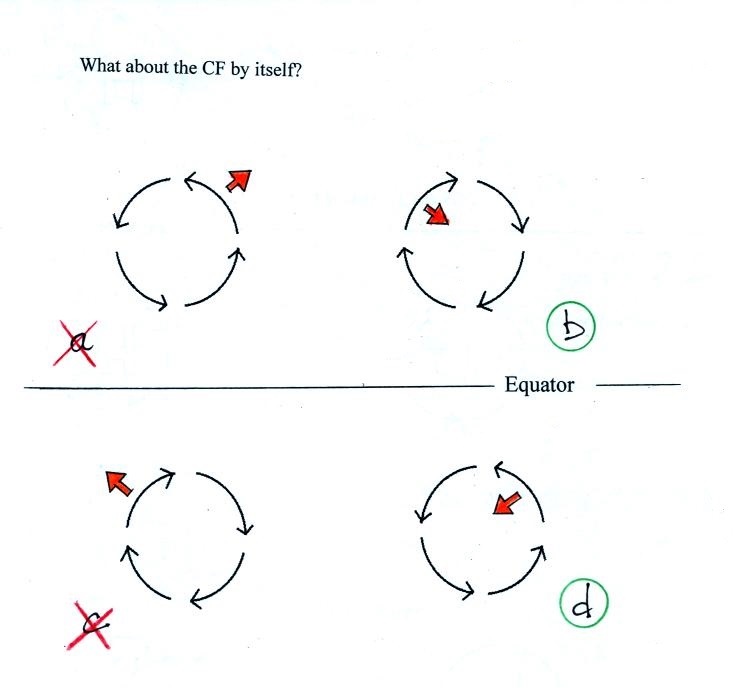
What about if just the Coriolis force is present (and I can't
really think of a situation where that would be true).
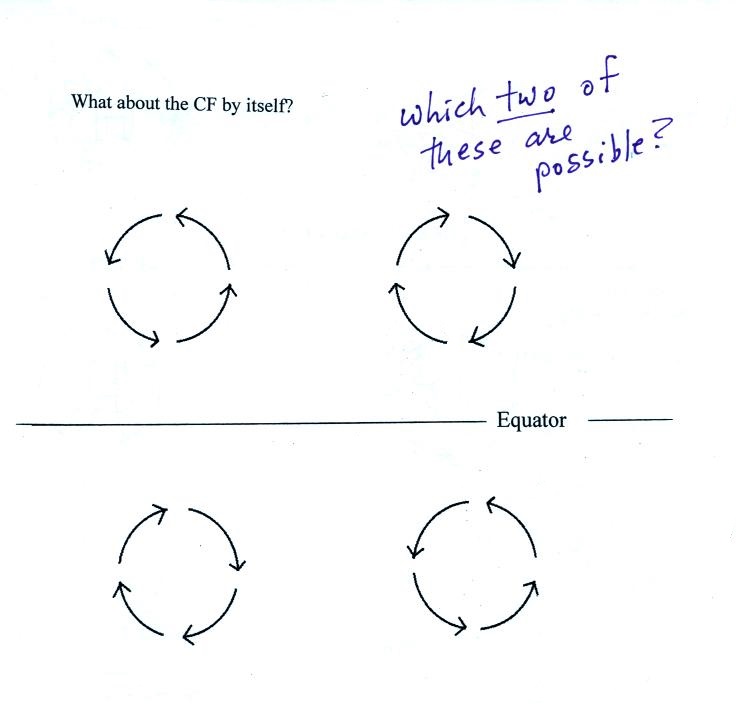
But this is a good question, it really tests your
understanding of this material. Two of the scenarios shown
above are possible? Which two are they. To be able to
answer the question you need to remember what is needed to keep
winds blowing in a circular path. You also need to remember
the rules for the direction of the Coriolis force. You'll
find the answer to this question at the end of today's notes.
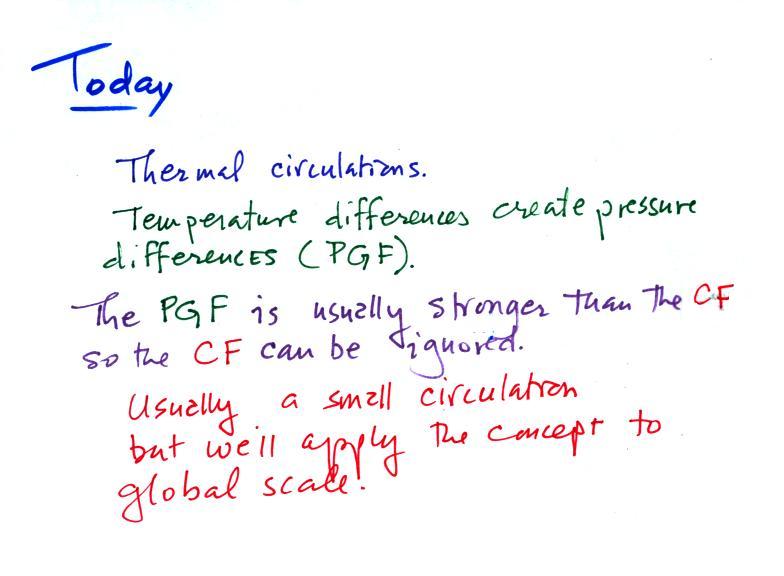
Next it was onto one of the main topics of the day: the
development
of a thermal circulation.
Differences
in temperature like you might find between a
coast and the ocean or between a city and the surrounding country
side can create horizontal pressure differences. The horizontal
pressure gradient can then produce a wind flow pattern known as a
thermal circulation.
When dealing with these usually small scale circulations, the
pressure gradient force is often so much stronger than the
Coriolis force that the Coriolis force can be ignored.
We will learn how thermal
circulations develop and then apply to concept to the
earth as a whole in order to understand large global scale
pressure and wind patterns. You really can't ignore the Coriolis force in a situation
like that so the concept is not really applicable on that
scale. But much of what it predicts is actually found in
the real world. That's why we'll cover and study this
topic.
Thermal Circulations
You'll find this discussed
on p. 131 in the photocopied Class Notes.
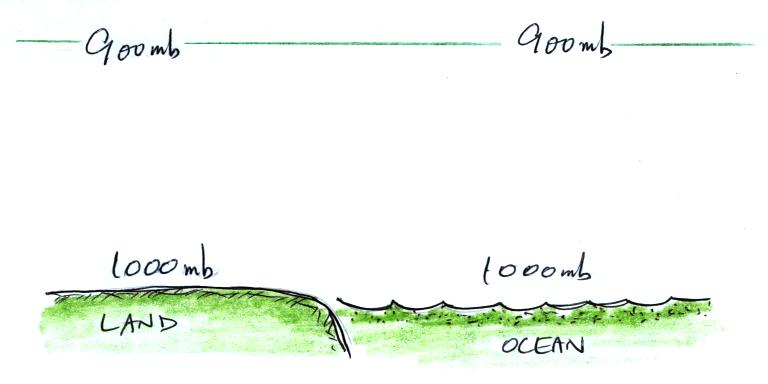
The figures below are more
carefully drawn versions of what is in the ClassNotes.
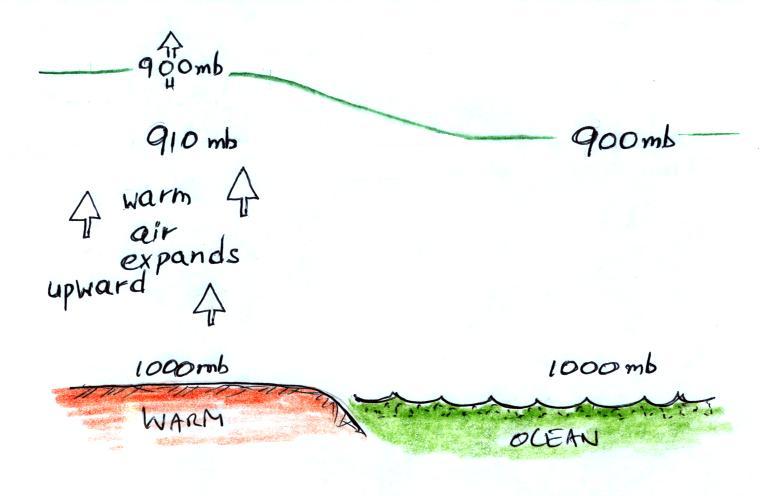
The picture shows a sea coast. There aren't any
temperature differences yet in this picture (both the ocean
and the land are shaded green), so the pressure at the ground
and above the ground are the same over the land and over the
ocean.
A beach will often become much
warmer than the nearby ocean during the day (the sand gets hot
enough that it is painful to walk on in bare feet). The ocean
has higher specific heat, is much harder to warm, and won't
change temperature much during the day. The warm ground
will warm the air above. Pressure decreases more slowly as
you move upward through warm low density air (that's something
we covered early in the semester). As you move from the
ground to the level of the green line in the picture above
pressure decreases 90 mb in the warm air and a little more, 100
mb, in the cooler denser air over the ocean.
Here's another way of arriving at the same result.
The layer of warm air on the
left expands, ushing the 900 mb pressure level to a higher level
than it would normally be found. 910 mb pressure from a
little lower altitude moves in to take its place.
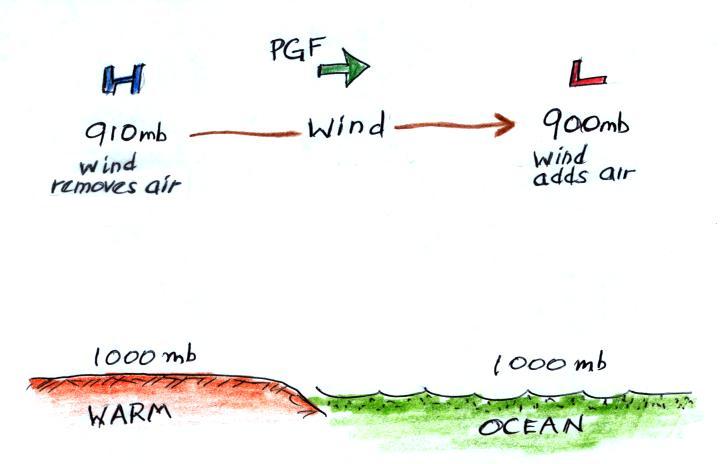
The temperature differences at
the ground have created an upper level pressure gradient
(pressure difference), higher pressure (910 mb) on the left and
lower pressure (900 mb) on the right. The resulting
pressure gradient force (PGF) causes air to start to blow from
left to right.
The upper level winds (which remove air from the left side of
the picture and add it to the right) will then affect the
surface pressure pattern.
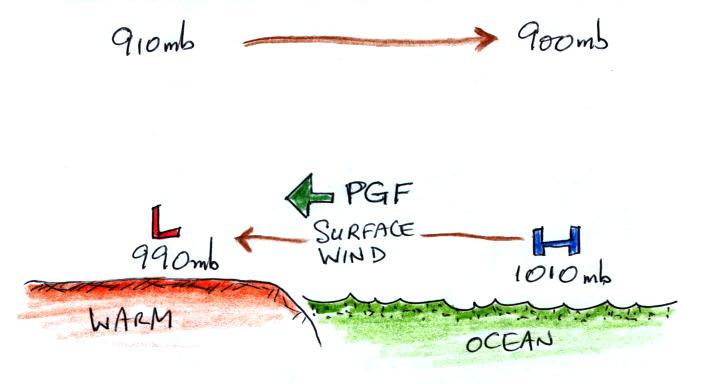
The sea level pressure is
determined by the weight of the air overhead. Air leaving
the left side of the picture will lower the surface pressure
(from 1000 mb to 990 mb). Adding air aloft to the right
side of the picture will increase the surface pressure (from
1000 mb to 1010 mb). Surface winds will start to blow from
right to left.
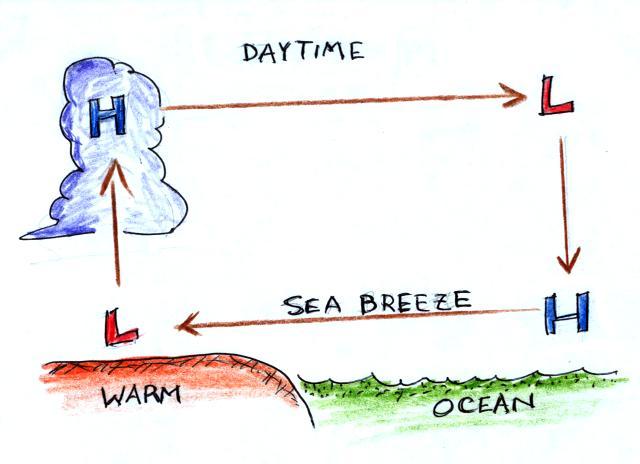
You can complete the circulation
loop by adding rising air above the surface low pressure at left
and sinking air above the surface high at right. The
surface winds which blow from the ocean onto land are called a
sea breeze (the name tells you where the winds come from).
Since this air is likely to be moist, cloud formation is likely
when the air rises over the warm ground. Rising air
expands and cools. If you cool moist air to its dew point,
clouds form.
Here's a short cut that will allow you to quickly figure the
directions of the winds in a thermal circulation without going
through a long-winded development like we just done. Just
remember that
warm
air rises
Draw in a rising air arrow above the warm part of the
picture, then complete the loop.
At night the ground cools more quickly than the ocean and
becomes colder than the water (the water temperature didn't
change at all in the picture below). Rising air is found
over the ocean water because it is warmer than the land.
The thermal circulation pattern reverses direction.
Surface winds blow from the land out over the ocean. This
is referred to as a land breeze.
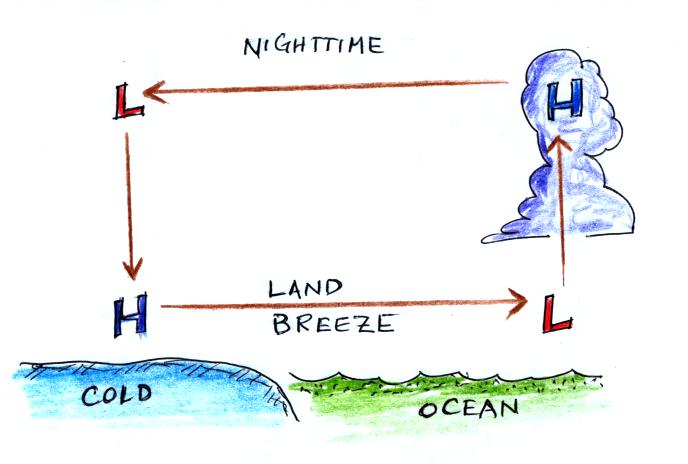
Clouds now form out over the ocean.
Here are some additional examples of thermal circulations or
large scale circulations that resemble thermal
circulations.
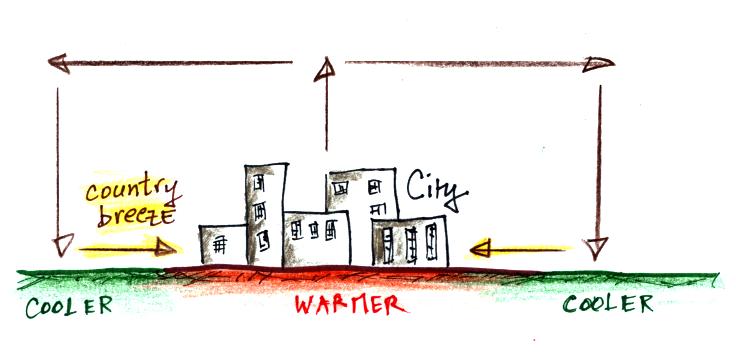
Cities are often warmer than the
surrounding countryside, especially at night. This is
referred to as the urban
heat island effect. This difference in temperature
can create a "country breeze." This will
sometimes carry pollutants from a factory or odors
from a sewer treatment plant located outside the city
back into town.
Here
are a couple of additional examples that weren't
mentioned in class
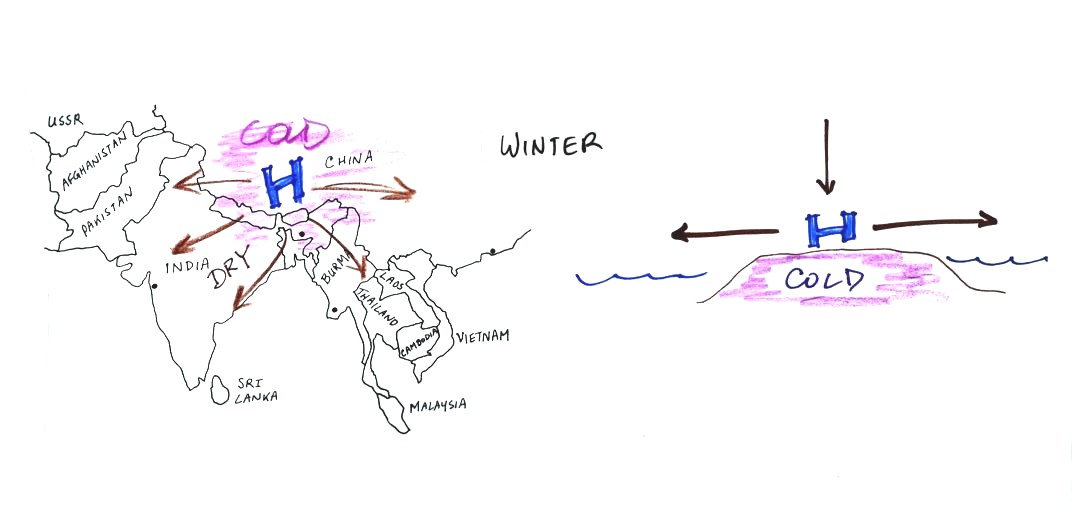
The Asian monsoon is a large scale circulation pattern and is
much more complex than a simple thermal circulation.
However you can use the thermal circulation concept to get a
general understanding of what to expect at different times of
the year. Before
looking at that let's be clear about the meaning of the term
monsoon.
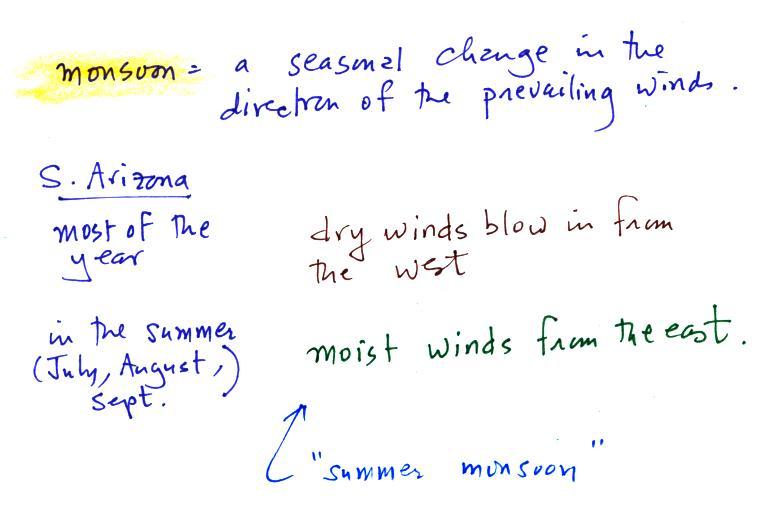
Monsoon just refers to a seasonal change in the direction of
the prevailing winds. Most of the year in Arizona winds
come from the west and are dry. For 2 or 3 months in the
summer winds come from the south and southeast. This
is when we get our summer thunderstorm season or summer
monsoon. The term monsoon is often used (incorrectly) to
refer to the thunderstorms themselves.
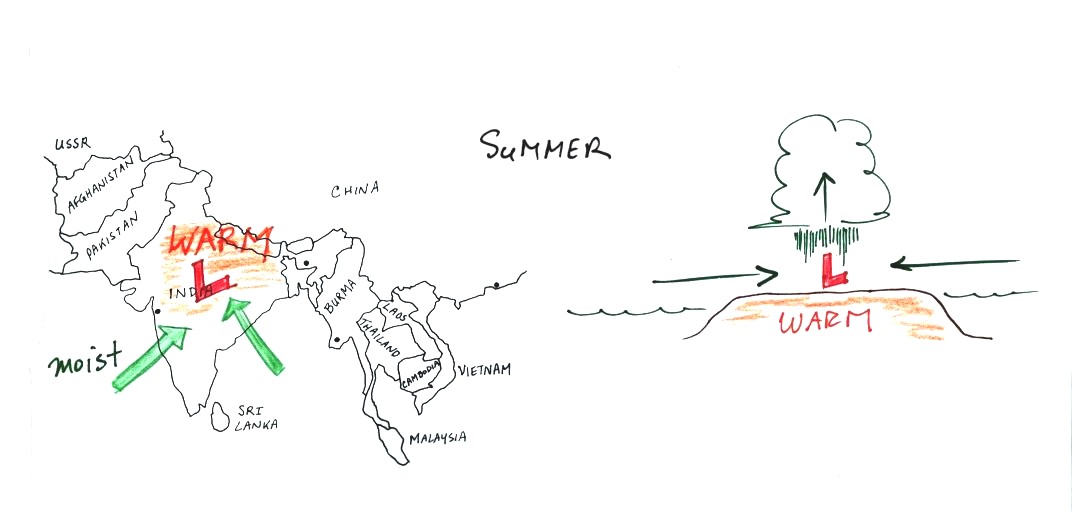
In the summer land masses in
India and Asia become warmer than the oceans nearby.
Surface low pressure forms over the land, moist winds blow from
the ocean onshore, and very large amounts of rain can
follow. A map view (top view) is shown at left, a
crossectional view is shown at right (it resembles a large sea
breeze).
The winds change
directions in the winter when the land becomes colder than
the ocean.
You can also use the thermal circulation to understand some
of the basic features of the El Nino phenomenon (you find a
discussion of the El Nino on pps 135-139 in the photocopied
Classnotes).
First here is what conditions look like in the tropical
Pacific Ocean in normal non-El Nino years (top and side views
again)
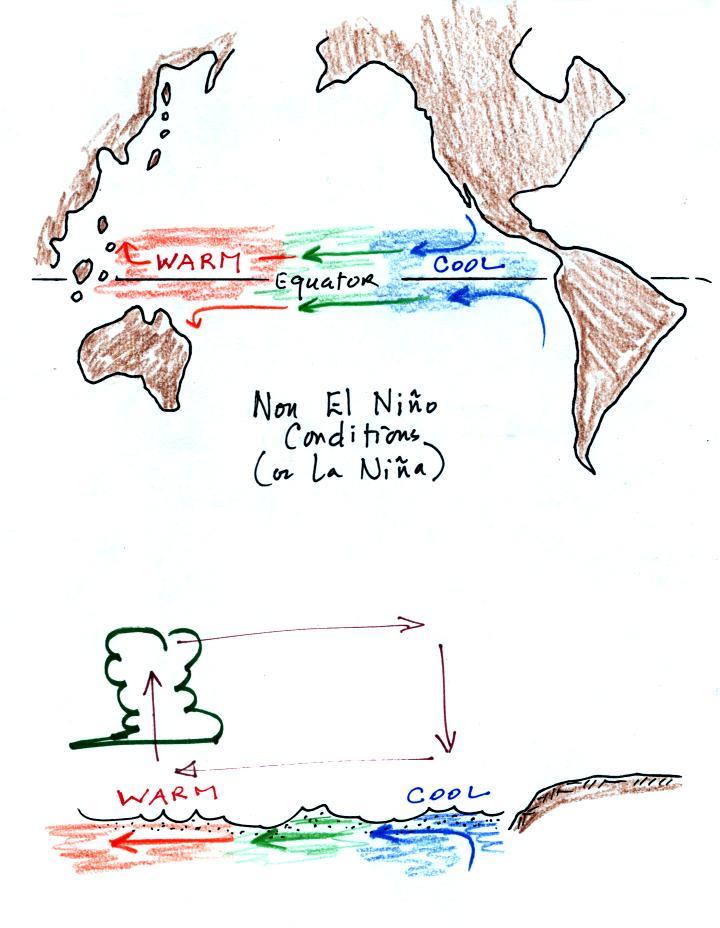
Cold ocean currents
along the west coasts of N. America and S. American normally
converge at the equator and begin to flow westward (see top
view above). As the water travels westward it
warms. Some of the warmest sea surface waters on earth
are normally found in the western Tropical Pacific (this is
also where hurricanes are most frequent). A
temperature gradient becomes established between the W. and
E. ends of the tropical Pacific. The crossectional view
above shows the normal temperature and circulation pattern
found in the equatorial Pacific Ocean. You would
find surface high pressure in the east and low pressure in
the west. Note that the wind circulation pattern is
the same as the simple thermal circulation we studied above.
During a La Nina event, waters in the Eastern Pacific are
even colder than normal. This generally produces drier
than normal conditions during the winter in the desert SW.
This was the case last winter. You can read more about La Nina
here.
Every few years El Nino conditions occur and the
cold currents don't make it to the Equator. Warm water
is carried from the western Pacific to the eastern
Pacific. The temperature and pressure basically
reverses itself.
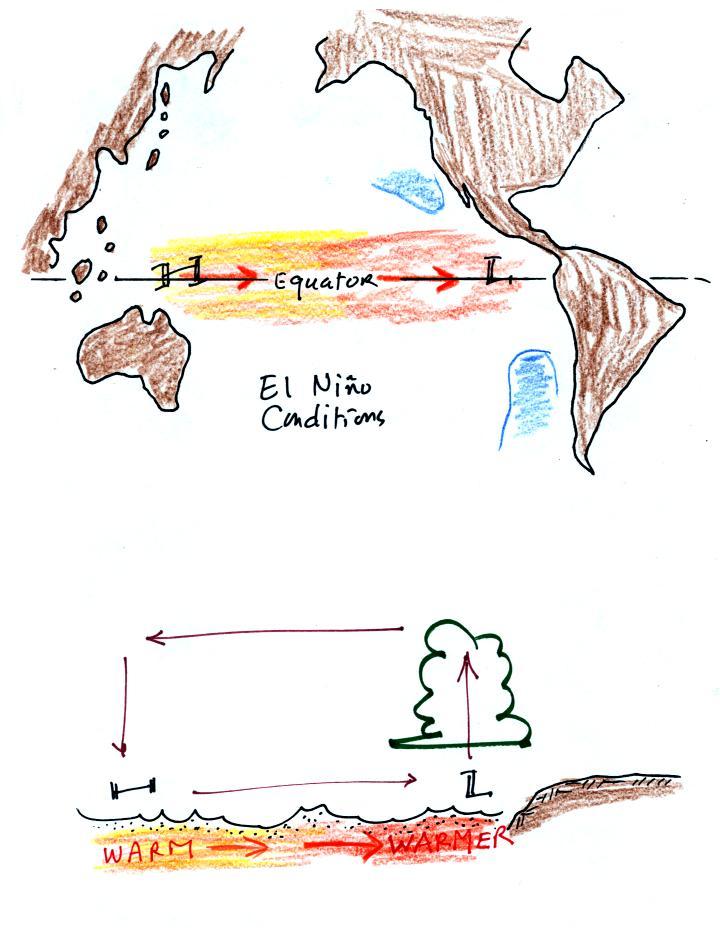
Now surface high
pressure is found in the west and surface low pressure and
rising air is found in the E. Pacific (the reversal in the
surface pressure pattern is referred to as the southern
oscillation). Indonesia and Australia often experience
drought conditions (and devastating wildfires) during El
Nino years. In the desert SW we expect slightly wetter
than normal conditions (perhaps 20% wetter than
normal). Wetter conditions are also found in
California and in the SE US.
Here's a map showing the effects of El Nino and La Nina
conditions on winter weather in N. America (source).
OK
back to material that was covered in class.
We are next going to use the
thermal circulation idea to learn something about global scale
pressure and wind patterns on the earth. Ordinarily you
couldn't apply a small scale phenomenon like a thermal
circulation to the much larger global scale. However if we
make some simplifying assumptions, particularly if we assume
that the earth doesn't rotate or only rotates slowly, we can
ignore the Coriolis force and a thermal circulation would become
established.
Some additional simplifications are also made and are listed
below (p. 133 in the photocopied ClassNotes). The figures
are more carefully drawn versions of what was done in class.
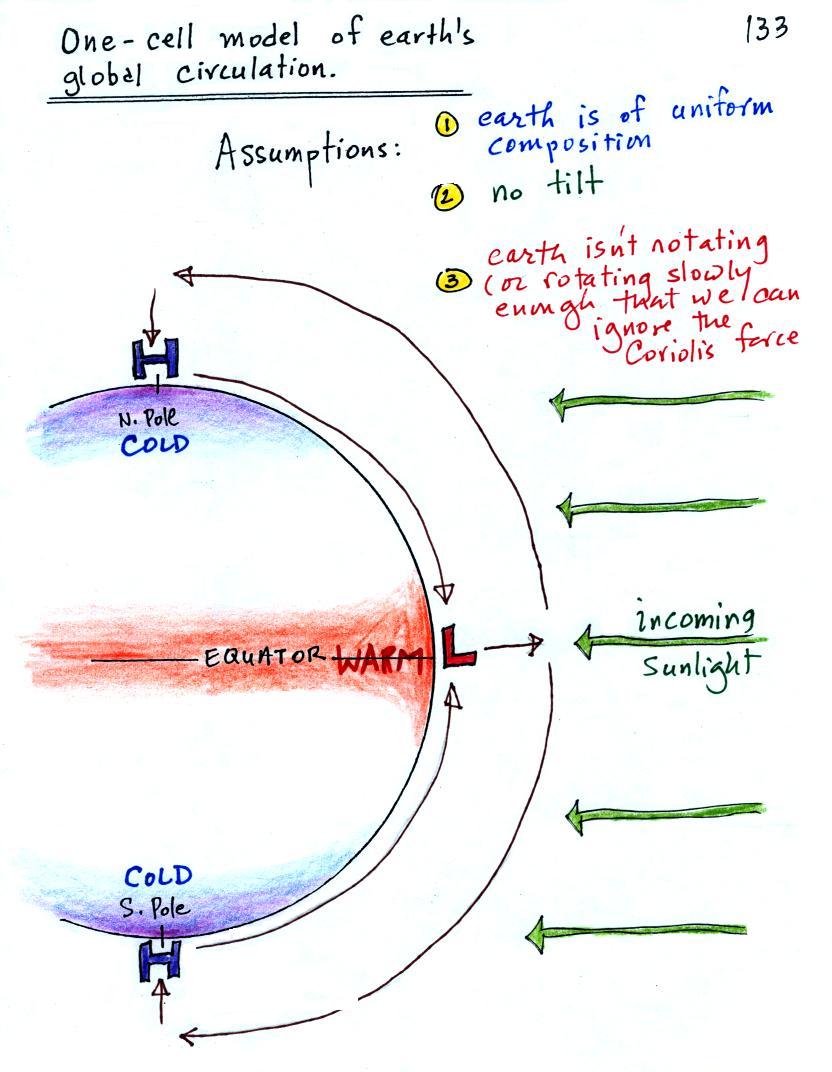
Because the earth isn't tilted, the incoming sunlight shines
on the earth most directly at the equator. The equator
will become hotter than the poles. By allowing
the earth to rotate slowly we spread this warmth out in a belt
that circles the globe at the equator rather than concentrating
it in a spot on the side of the earth facing the sun. Because
the earth is of uniform composition there aren't any temperature
differences created between oceans and continents.
You can see the wind
circulation pattern that would develop. You'd
find rising air at the equator (the "warm air rises" shortcut
rule again). Upper level winds would blow from equator
toward the N and S Poles. Winds would converge and sink at
the poles. Surface winds would blow from the poles toward
the equator. The term one cell just refers to the single complete loop in each
hemisphere.
Next we will remove the assumption concerning the rotation of
the earth. We won't be able to ignore the Coriolis force
now.
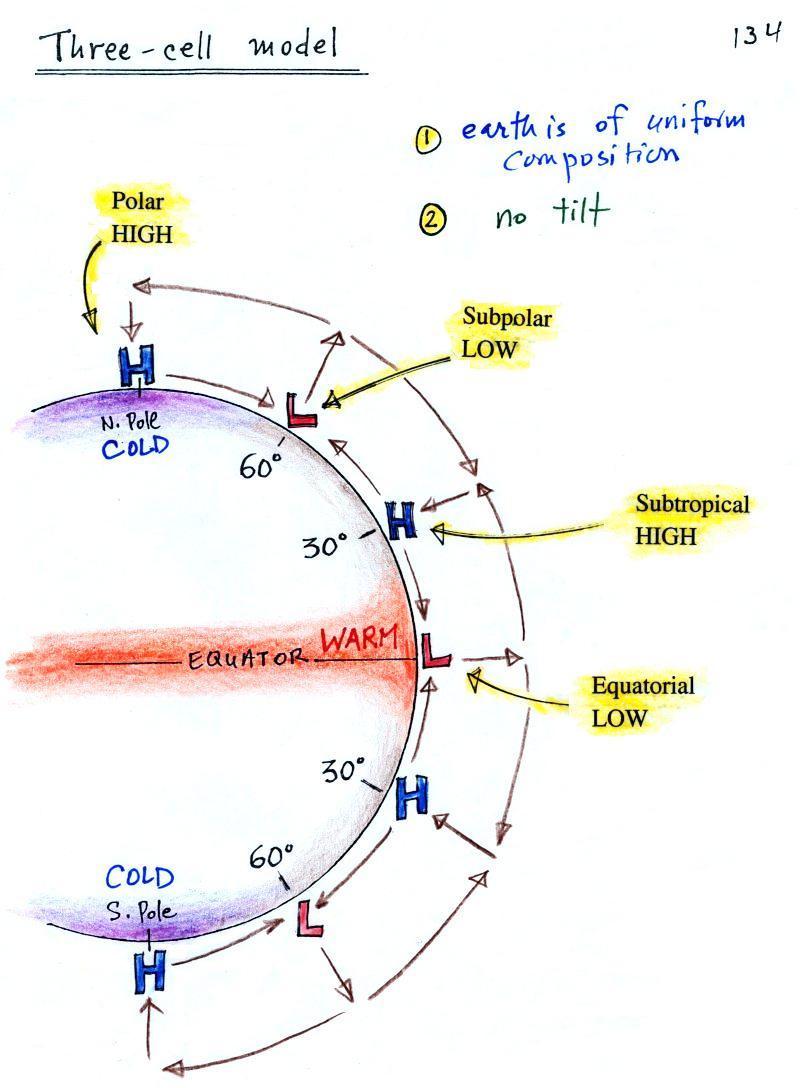
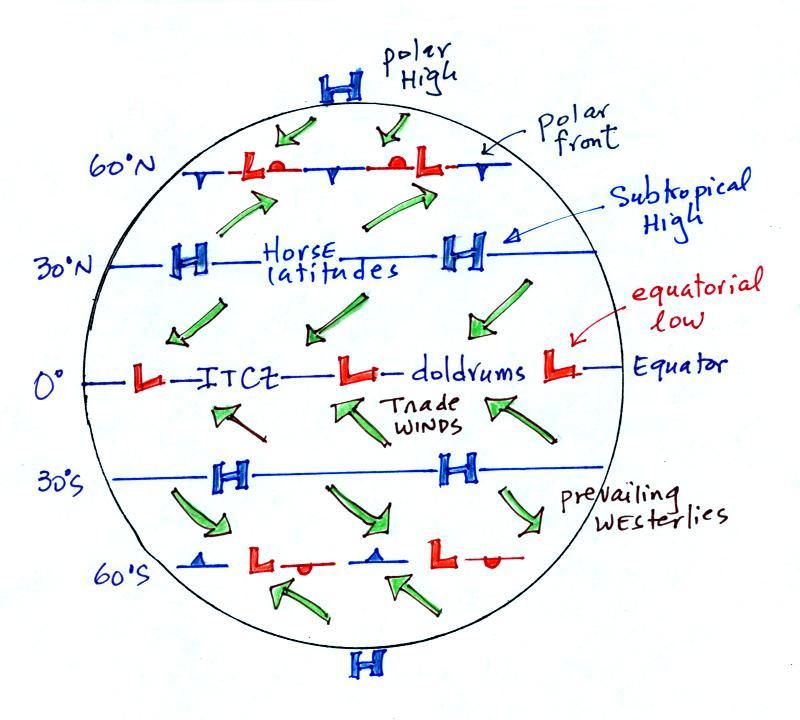
Here's what a computer would predict you would now see on the
earth. The temperature pattern remains the same and things
are pretty much the same at the equator in the three cell and one
cell models: surface low pressure and rising air. At upper
levels the winds begin to blow from the equator toward the
poles. Once headed toward the poles the upper level
winds are deflected by the Coriolis force. There end up
being three closed loops in the northern and in the southern
hemispheres. There are surface belts of low pressure at the
equator (the equatorial low)
and at 60 degrees latitude (the subpolar low). There are belts of
high pressure (the subtropical high) at 30 latitude and high
pressure centers at the two poles (the polar highs).
On Friday we will look at the 3-cell model surface
features (pressure belts and winds) in a little more detail
because some of what is predicted, even with the unrealistic
assumptions, is actually found on the earth.
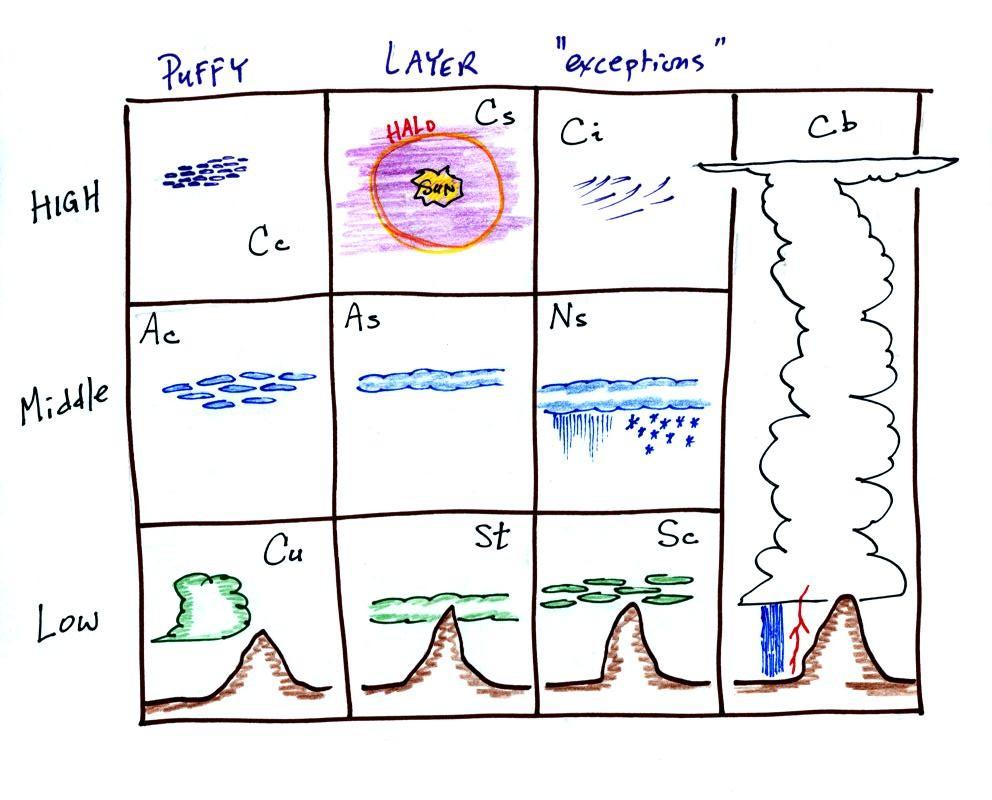
And just as you had a cloud chart (shown below at left) to
try to learn before Quiz #3 we'll have a chart of 3-cell model
surface pressures and winds (below at right) to learn before Quiz
#4.
 |
|
Here's the answer to the question about spinning winds that
would be possible if just the Coriolis force was present.
What we've done is draw in the direction of the Coriolis force
for each of the four examples above. The CF is perpendicular
and to the right of the wind (as you look downstream) in the
Northern Hemisphere and to the left in the Southern
Hemisphere. The CF points inward in examples (b) and (d) and
could supply the net inward force needed to keep air spinning in a
circular path. The winds in (a) and (c) would not be
possible because is no inward pointing force.