![[Home]](../../icons/home.jpg)
![[Lectures]](../../icons/lectures.jpg)
![[Previous]](../../icons/previous.jpg)
![[Next]](../../icons/next.jpg)
Recently Observed Climate Change and Implications for Possible Future Climate Changes
Climate has changed in the past and will continue to change in the future. Climate change
is a natural part of Earth's history. The issue is whether or not humans are significantly
altering the natural progression of climate change, and if so, will these changes be
detrimental to life on Earth, including human life? The basic argument made by the
IPCC is that human emissions of greenhouse gases has been the major driver for recent
observed changes in surface temperature. Quoting from section D.3 of the
2013 IPCC Summary for Policymakers: It is extrmely likely that human influence has been
the dominant cause of the observed warming since the mid-20th century.
On this page we will examine the
recent observed changes in temperature and climate as well as some of the impacts of those changes.
You should realize that
changes in temperature will be accompanied by climate changes like changes in sea level and changes
in ice cover. These other climate changes really only serve as circumstantial evidence for the
IPCC argument because they are expected to happen regardless of why the global average surface
temperature may be changing. For example, if the recent warming of global average temperature
is simply a natural cycle of climate change on Earth that is not influenced much by higher
greenhouse gases, we still expect to see climate changes like reductions in glacial ice and sea level rise.
After examining some of the recent observed changes in climate, we will take a look at what could happen in the future
if some of the predictions made by current climate models are correct.
It is interesting to note that over the last 120 years, there have been many "news" stories claiming
that Earth's climate is changing and that those changes are going to be bad for humans and other life. Sometimes
the predictions are for global warming, while other times the predictions are for a return to Ice Age conditions.
Often there are experts or climate "scientists" attached to the claims. It seems to be part of human nature
to extrapolate current trends to speculate or predict future doom. Please see
A Brief History of Climate Panic and Crisis ... both Warming and Cooling for a list of historical examples.
Please keep in mind that observed changes do not provide strong evidence for why
the changes have happened. Sometimes it seems as if the IPCC starts with the assumption that
all recent observed changes in climate (and even extreme weather events) are primarily the
result of higher levels of greenhouse gases. However, we know that climates around the Earth
have always changed with time regardless of human activity, and it is entirely possible that
recent observed changes could be dominated by natural variability.
It is one thing to say that observations show that
global average air temperature has increased, Arctic sea ice has decreased, sea level
has risen, and so forth, but entirely another thing to prove why these changes have happened ...
for example, to prove that these changes would not have happened without the recent increase
in greenhouse gases due to human activity.
The IPCC reports go to great lengths to document observed changes in temperature, precipitation,
sea level, and other items, calling them "indicators of climate change"; however, the fact that
these changes are observed during a time when greenhouse gas levels are increasing is not
proof that the climate changes were mainly caused by human emissions of greenhouse gases and
not mainly the result of natural fluctuations in Earth's climate, which have produced large
climate fluctuations thoughout the history of the Earth.
A recurring message
is that correlation does not prove cause and effect. For example, since 1980 we know that greenhouse
gas concentrations in the atmosphere have increased and we also know that the global average surface air
temperature has increased and that arctic sea ice has
decreased, however the fact that these events are correlated with each other cannot be
used as proof that one caused the other. Specifically, for this debate, the facts that
(1) greenhouse gases have increased due to human activity; (2) global average
temperature has increased (especially after 1980); (3) Arctic sea ice has decreased; and (4) Sea level has risen,
does not prove that the increase in greenhouse gases caused the global average temperature to increase, Arctic
sea ice to decrease, and sea level to rise.
Unless otherwise noted, the observed changes
presented below were originally taken from the 2013 IPCC report titled
Climate Change 2013: The Physical Science Basis.
The full report is 1552 pages. In some cases updates are provided for climate changes observed
after 2012.
- Global mean surface temperature has increased by about 0.85°C (1.5°F) between 1880 and 2012 (IPCC). In addition,
18 of the previous 19 years (1995-2013) rank among the 18 warmest years of the
instrumental temperature record (since 1850). After the latest IPCC report, the global average temperature
has remained relatively high. In fact 2015 and 2016 were the warmest years in the measured record (since 1860).
As mentioned on the previous page, the warm 2015/2016 period is likely influenced by El Nino and may be
short-lived. However, global average temperature has remained elevated even after the 2015/2016 El Nino event
ended, which may indicate that the warming trend is continuing.
-
There is no doubt that that global average surface temperature has risen since 1850 and that
if you break the record into 20 year periods, the most recent 20 years is the warmest in the record.
There are questions about exactly how
much it has warmed and the pattern of changes in global average temperature over the time
since 1850. Uncertainty comes about because adjustments need to be made to measured
thermometer records for things like changes in instrumentation, changes in the location of
the thermometer with time, changes in population density near the thermometers, etc. Different
reasearch groups use different adjustment methods. One also has to consider some of the
issues brought to light in the climategate scandal, which questions the scientific
integrity of some of those responsible for publishing trends in global temperatures.
We are not going cover (or be distracted by) the climategate controversy in this class
since it does not scientifically prove or disprove anything related this issue of possible
human-caused climate change.
If you are interested in climategate,
I suggest you do a web search and read several articles on both sides.
As with most
other issues related to climate change, there are serious disagreements even with so-called
observations of recent climate changes. Changes in global average temperature are based mostly on
measurments of air temperature, yet there are spirited debates about the details of the "observed"
change in global average temperature.
Keep in mind that the
arguments are about some of the details of the surface temperature record, not whether or not there
has been warming over the last century. There is no doubt that the global average surface temperature
has increased significantly over the last 150 years. There is also little doubt that the most recent 20 years have been the warmest in terms
of global average temperature since 1850. Below are a couple of links to internet articles that
question the official United States' government published changes in surface temperature. Students
are not expected to read or even consider the information contained in the links. Please look over
the material only if you are interested. We are going to use data from another data source for changes
in global average temperature.
- Widespread changes in extreme temperature have been observed over the last 50 years.
Cold days, cold nights, and frost have become less frequent, while hot days,
hot nights, and heat waves have become more frequent over large continental-scale regions. (IPCC)
Instructors note: I have some question about the ability to prove or disprove these
conclusions given the limited spatial and temporal coverage of data as well as
our limited understanding of the natural variation of these events; however, given that
there has been a significant increase in global average temperature, one would expect that
there would be more warm temperature records than cold temperature records over this time period.
See discussion on next reading page.
- At smaller spatial scales (regions within continents), there continues to be much variability
when looking at temperature changes in general as well as changes in extreme temperature, with
some regions actually showing cooling over the last 50 years, though much more of the
earth's surface has warmed than cooled.
- More than 60% of the net energy increase in the climate system is stored in the upper oceans
(0 - 700 meters) and about 30% is stored below 700 meters. Both the surface and deep ocean
likely had increases in stored energy since the mid-20th century (IPCC)
- Measurements of changes in ocean heat content are perhaps the most important observations
we can make to help understand the impact of added greenhouse gases. The ocean heat content can
be calculated from global measurements of ocean water temperature.
If the IPCC climate models
are correct, then there should be an imbalance of radiation energy at the surface of the Earth,
where more energy is absorbed by the surface than is emitted. This imbalance over the oceans
should cause the ocean heat content to increase. According to climate models, this energy or heat
should be accumulating in the oceans over time and this is something that we may be able to monitor
with precise measurements of water temperature throughout the oceans.
- Unfortunately, there is a considerable debate about how the ocean heat content has
been changing. There is little doubt that the ocean surface temperature has warmed since 1880 as we
have sufficient observations of surface water temperature. However, there is debate about
the changes in ocean heat content below the surface based on available observations. A detailed
discussion of this issue is beyond the scope of this course.
- A current issue with respect to possible human-caused global warming is that the global average
surface temperature did not increase significantly between 1998 and at least 2013. This is sometimes
referred to as "the pause" in global warming.
Climate models predicted that there was an
energy imbalance at the surface due to increasing greenhouse gases, so why did the surface stop warming
over this time period?
A possible answer is that the
excess energy was being stored in the oceans rather than going into changing the surface
temperature. Observations of the heat content of the upper ocean (0 - 700 meters) during this period show
relatively small changes in this zone, so if this energy was being stored somewhere, it must have been in
the deep ocean (below 700 meters). Our observations of changes in the energy content of the deep ocean
are not good enough to determine if this is what was really happening. This is because the heat capacity of the
deep oceans is so large that it takes an incredible amount of energy to appreciately change the temperature
of that much water. Even if all the predicted excess energy were going into the deep ocean over the last
15 years, the expected temperature increase in the deep ocean water would be less than 0.01°C,
which is smaller than we can accurately measure.
It is also difficult to come up with a consensus answer as to physically how that much energy
could have been moved into the deep oceans. This issue will likely remain unresolved until we are able to
make good enough measurements of changes in deep ocean heat content.
- Global sea level has risen 0.17-0.21 meters (6.7-8.3 inches) since 1900. (IPCC)
- Sea level rise is something expected as global temperature increases.
Widespread decreases in glaciers and icecaps
contribute to sea level rise. Sea level also rises
due to thermal expansion of oceans. Thus, warming over an extended period of
time almost certainly would result in rising sea level. Sea level rise seems like something that the world
is going to have deal with, regardless of the reasons why it is increasing. The near term forecast is
for continuing sea level rise whether the recent warm period is related to greenhouse gas emissions or a
natural warm period. And even if it is due to greenhouse gas emissions, as stated on the last page,
there is no quick fix that will make the Earth stop warming, even if we immediately stopped all greenhouse
gas emissions. In the opinion of your instructor, the prudent course of action is to prepare for
continuing sea level rise by doing things like building sea walls or moving structures away from the
current water's edge, rather than arguing about why sea level is rising. Eliminating greenhouse gas
emissions is probably not going to make this issue go away.
- The 2013 IPCC report concludes that sea level rose at an average rate of 1.7 mm/yr (millimeters per year)
from 1901 to 2010, but the rate was higher (3.2 mm/yr) over the period from 1993 to 2010. However, the
report also says that the rate of sea level rise was also similarly higher over the period from 1920
to 1950, which corresponds with a period of rising global average temperature from 1910 to 1940 that can not
be explained by the small increase in greenhouse gases that happened during that time.
- There are many who believe that sea level has been generally rising since the
end of the last true Ice Age (15 to 18 thousand years ago) with smaller modulations in the rate of
sea level rise superimposed due to short
term changes in global average temperature.
- "High confidence" that the ocean surface water is becoming more acidic and that the average pH has decreased
by 0.1 since the start of the Industrial Revolution (IPCC). This is a 26% decrease since pH is reported
using a log scale.
- There is little doubt that as CO2 levels increase in the atmosphere, more and more of it
will dissolve in the oceans, which makes the water more acidic (decreases pH).
- However, there are serious debates about how much the pH of ocean water will change in response
to increased CO2 in the atmosphere, which range from negligibly small to shockingly large.
- There is quite a lot of uncertaintly regarding the effects of increased acidity on marine life
and the ocean biosphere.
- The pH of ocean surface water varies quite a bit with both location and time of year though, and
ranges from 7.8 to 8.4, which seems like a large variation in comparison to the observed decrease in
global average pH of 0.1 units.
- Global precipitation patterns have changed. This is something that we would expect with
any climate change, whether it is human-caused or natural. Notice from the confidence levels
expressed in IPCC reports that it is difficult to determine if there have been significant
changes in precipitation based on available observations. And this does not even address the
question of whether or not those changes can be directly linked to changes in greenhouse gases or whether
they are just natural climate changes. See discussion on next reading page.
- "Low confidence" of an increase in global average precipitation (IPCC)
- "Medium confidence" there is no change in tropical precipitation (IPCC)
- "Medium confidence" of an increase in precipitation in northern hemisphere middle
latitudes, 30° to 60° North latitude (IPCC)
- "Low confidence" in trend estimates for the rest of the world (IPCC)
- Changes in extreme precipitation (flooding) events and droughts. See discussion on next reading page.
- "Low to medium confidence" of an increase in extreme precipitation events over
large, continental-scale regions (IPCC)
- "Medium to high confidence" of an increase in continental-scale drought severity (IPCC)
- "Low confidence" for a global increase in drought severity, but "high confidence" for certain
regions, such as the Mediterannean region and West Africa (IPCC)
- Instructor's note:
I question that we have enough data over a long enough period of time to be
able to prove or disprove these claims. I noted that this latest IPCC report has lowered
their stated confidence for trends in extreme precipitation and droughts.
However, based on past variability in these events,
we expect there to be shifts in heavy
precipitation events and droughts over smaller regional scales
regardless of changes in greenhouse gas concentrations.
- Sea ice ... "Very high confidence" that Arctic sea ice has decreased in extent and thickness from 1979 to 2012,
particularly in the spring and summer seasons (IPCC) ... "Very likely" that Antarctic sea
ice has expanded over the period 1979 to 2012 (IPCC)
- Let's take a quick look at sea ice data. The satellite data record for sea ice begins in 1979. Prior to that
we do not have good enough observations of total sea ice.
It appears that the links below are not working as the Cryosphere Today website is offline. Here is a link to a
Sea Ice Dataset Page.
This plot of Northern Hemisphere
Sea Ice Anomaly shows the amount of Arctic Sea ice relative to the 1979 to 2008 average. There has been a clear
trend toward decreasing sea ice from 1979 to today. The lowest sea ice years were 2007 and 2012. Here is a
plot of Southern Hemisphere
Sea Ice Anomaly, which shows the amount on Antarctic Sea ice relative to the 1979 to 2008 average. For Antarctic
sea ice there has been a general trend of increasing sea ice over this period, with 2014 being the year with the
highest Antarctic sea ice. Antarctic sea ice has come back down to the 1979 to 2008 average after 2014 though.
Finally, this
plot of the global sea ice anomaly shows while global sea ice fluctuates up and down, there has been a clear
tendency for lower sea ice years, especially after 2006. However, global sea ice was above average from 2013 to 2015.
Sea level has fallen to below average after 2015.
- A problem with the sea ice records is that we only have good data starting in 1979. For longer term climate
studies, it would be nice to know how sea ice changed throughout history, since there could easily be
longer time scale cycles in sea ice. Prior to the 1979 and the satellite record, there are accounts of low sea ice periods
in the Arctic, e.g., a
November 1922 article in Monthly Weather Review, a
April 1923 article in the
"London Daily News", a
April 1939 article in the "Examiner", which talks of an ice-free North Kara Sea and
a sea ice line north of 82° latitude.
These articles suggest that there are natural cycles of sea ice changes
in the Arctic that are not related to human emissions of greenhouse gases.
Today's sea ice extent is likely influenced by both natural
variation and any temperature changes related to greenhouse gas increases.
- Northern hemisphere snow cover has decreased in recent decades, particularly in the spring months
of March through June (IPCC).
- Note that the statement from the IPCC is for springtime snow cover. In the past it was reported
that northern hemisphere snow cover was decreasing in all months. Unfortunately many believe that
is still true.
This
plot of Northern
Hemisphere snow cover from 1972 to present does not show a trend toward decreasing
snow cover in recent years.
- You can also look at graphs of changes in Northern Hemisphere snow cover for different
seasons (fall, winter, and spring) at the
Rutgers University Snow Lab website. Notice that there have been increases in Northern
Hemisphere snow cover in fall and winter, which apparently offset the decreases in springtime
Northern Hemisphere snow cover. It is interesting that the IPCC reports only on the decrease
in springtime snow cover, but does not comment on the increases in other seasons.
- While many expect a general decrease in snow cover with higher
temperatures, northern hemisphere snow cover shows large fluctuations that are not
related to changes in average global temperature. This is probably because changes in snow cover
are related to temperature, precipitation, and prevailing weather patterns.
- "Very high confidence" that almost all glaciers worldwide have decreased in volume and mass over
the period 1979 to 2012 (IPCC). This includes both mountain glaciers as well as the large glaciers
in Greenland and Antarctica. In addition, most glaciers will continue to shrink even if
the global average air temperature were to stop rising (IPCC). This is because the temperature
increases faster than the glaciers are able to melt.
- Melting glaciers would be expected during relatively warm periods. There are many who believe
the current melting is similar to previous melting periods. Glaciers grow and shrink on
multi-decadal, centennial, and millennial time scales, and recent observations of melting are
not outside of the range of natural variability.
- Even this observation that most glaciers on Earth are losing mass has recently been questioned
by a recent NASA study of Antarctic ice,
Study: Mass gains of Antarctic ice sheet greater than losses,
which claims that Antactic ice mass has been increasing over the last 10,000 years.
- It is worth pointing out that changes in glacial mass are generally slow processes, i.e., it
can take a long time for glaciers to grow and a long time for glaciers to melt relative to changes
in temperature. Therefore, as glaciers melt away, there will be a lasting impact on future climate,
especially for regions located near glaciers.
- "High confidence" that there has been a decrease in both areal extent and thickness of permafrost soils
of most regions (IPCC). Permafrost is defined as soil that has been frozen for more than 2 consecutive
years. It is stated that the southern limit of the peramafrost soil in the northern hemisphere has
been generally moving northward (poleward).
- "Low confidence" that there have been significant changes in small scale extreme weather events, such
as severe thunderstorms, tornadoes, and hail in recent decades (IPCC). "Low confidence" that there
has been an increase in the strength of tropical cyclones and hurricanes (IPCC). "Low confidence"
for an increase in the strength of extratropical storm systems (IPCC).
See discussion on next reading page.
- The latest 2013 IPCC report is quite different from the 2007 IPCC report, which concluded
with higher confidence that these extreme weather events had been increasing. However, this does not
stop those in the media from interviewing scientists that are willing to attribute individual extreme
weather events to human caused climate change, such as hurricane Katrina, the destructive tornadoes
in the United States in 2011, superstorm Sandy, and most recently Typhoon Haiyan.
- Observational evidence shows that some biological systems have
been affected by recent climate changes. These types of adaptations are expected
regardless of the reason for climate change.
- Lengthening of middle and high latitude growing seasons
- Poleward and altitudinal shifts of plant and animal ranges
- Earlier flowering of trees, emergence of insects, and egg-laying in birds.

Potential Impacts of Climate Change / Impact Studies
Impact studies are studies that deal with the question of how future climate change will affect
humans and other natural ecosystems. This is actually the ultimate question that we would
like to be able to answer in order to both prepare for the future and help decide if we need to
aggressively reduce emissions. However, to answer the question correctly, we would first need to know with
certainty how climate is going to change. In spite of all the research and climate models, our understanding
and ability to predict how climate is going to
change in the future, both from human and natural influcences, is quite poor.
Also, keep in mind that the predictions of climate changes on regional scales (moderately-sized ecosystems)
is much more uncertain and difficult than predicting global average changes, yet it is change on the
regional scales that is most important for determining how life and human civilizations will be affected
by climate changes.
Since we are not very good at predicting future climate changes, the results of
impact studies are inherently uncertain. Most impact studies today are performed by models that
first read as input the climate changes predicted by a climate model. Thus, if climate
model projections for the future climate in a given ecosystem are wrong, then the projected
impacts on that ecosystem will be wrong. Given the uncertainty in climate model projections,
it is probably a good idea to perform impact studies on a whole range of possible
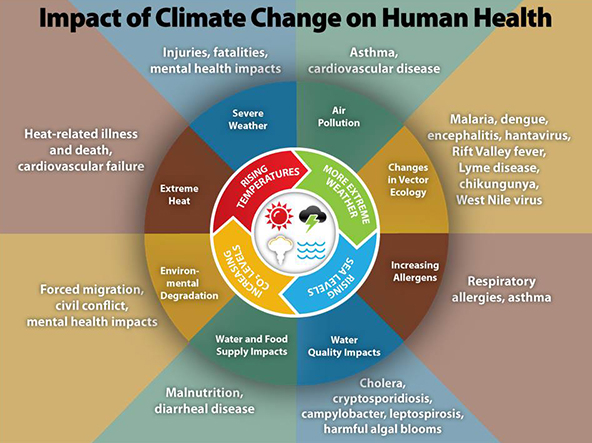
future climates before deciding any long-term policies. The figure below was taken from
the United States Centers for Disease Control (CDC). The figure seems to imply that rising
CO2 will cause an increase in all of the health-related issues shown. We have
already discussed the uncertainty associated with future predictions of the two items on
the upper left of the figure, increases in severe weather
and changes in extreme temperatures, which should include both heat and cold.
It seems as if the CDC was attempting to shock or scare people
with this array of possible consequences without at all addressing the uncertainty in the
climate change senario they selected. Someone more cynical may say that this is an effort by
the agency to expand and increase funding. Instructor's Note: Regardless of whether or not you believe the CDC should
be spending money in this area, it looks funding may be shifting with the new president. I noticed
that some of the web page links concerning climate change on both the CDC and EPA pages no longer work.
Another issue with impact studies is that even if we
know for sure how the climate will change within a given ecosystem, it is still difficult
to understand and predict how humans and other life within will adapt. One would need to know both
the magnitude of the climate changes as well as the rate of change as that would influence
the ability of life to adapt. One would also have to understand how life in the ecosystem would
respond to climate changes. In addition there will likely be unforeseen changes in human living conditions
and environmental engineering with advancing technology that will influence our vulnerability to climate changes.
These are not easy questions to answer with much certainty.
Below is a list of reasonable considerations for climate changes based on current knowledge. Keep in mind that
climate change is expected even without human influences. There will always be ongoing concerns with the ability to
supply all people worldwide with fresh water and food. Some claim that this will be made tougher due to climate changes
stemming from greenhouse gases. However, we cannot just expect that these problems will go away if we just stop adding
greenhouse gases. We need to address water and food issues regardless of any human-caused climate changes.
- Continued Sea level rise. This is certain as long as surface temperature increases, and may have been happening since
the end of the last ice age, which means it may not be completely dependent on short-term fluctuations in surface temperature.
This implies that it may not stop even if we stopped adding greenhouse gases to the atmosphere.
Sea level rise is something that needs to be planned for as it is likely to continue. And if the worst climate model
projections come true, sea level could rise as much as 1.5 meters (150 cm) more by 2100 (does not seem likely).
- 5 to 9 inch (about 12 to 23 cm) estimated rise measured since 1900.
- Water expands slightly as it warms
- Land-based glaciers melt and add to sea level
- Over half the world's poplulation lives within 60 miles of the sea
- Many large urban areas sit less than one meter above current sea level
- Must also consider that some land areas are sinking, while others are rising due to geological forces
- Forests and other ecosystems must migrate or adapt to climate changes
- Is there room to migrate? (Human barriers)
- Is there time to adapt or migrate? (Depends on rate of change)
- Agriculture. Changes in Temperature and precipitation patterns will shift growing zones.
- Farmers will have to adapt, if possible. Technology has so far continued to increase food output and reduce vulnerability
- Some areas benefit from changes, some will decline. Difficult to predict where and how.
- Human health. In the developed world, advances in technology and health care mean people are living longer and helthier than ever. This
trend is likely to continue even with climate changes. There are still issues with making this technology available throughout the world,
but those are not related to climate change.
- Claims of more frequent, killer heat waves seem overdone as previously discussed.
The best way to keep people from problems related to heat exposure
is to make sure they have access to proper shelter and water.
- Possible enhanced spread of infectous diseases, such as malaria, dengue fever, and west nile virus. While climate change
could alter the range and spread of these diseases, it should only be a minor issue with respect to actually combatting
these diseases. People living in underdeveloped nations could be more helped by having access to sanitary water,
good housing, health care, and vaccines. Any connection to climate change is a minor factor right now.
- As surface warms, the hydrological cycle becomes more active. This may result in the following:
- Increases in the magnitude and frequency of extreme flooding (more water vapor available). Thus far there is limited evidence
that supports this claim that there have been more extreme flooding as surface temperature has warmed.
- Increases in the magnitude and frequency of extreme droughts (where it does not rain, it is warmer with increased evaporation)
Thus far there is limited evidence
that supports this claim that there have been more extreme droughts as surface temperature has warmed.
- A decrease in fresh water availability for parts of the globe (or at least add to this growing problem in
many parts of the world). Even without global warming, this is a major concern as population increases.
- Possible increases in severe weather events such as hurricanes, severe thunderstorms, and tornadoes. As we have
previously discussed, this prediction is highly speculative. Even though the IPCC has recently toned down its
earlier predictions of increased severe weather, there are still many who treat this speculative prediction as a fact,
such as the CDC.