![]()
![]()
![]()
![]()
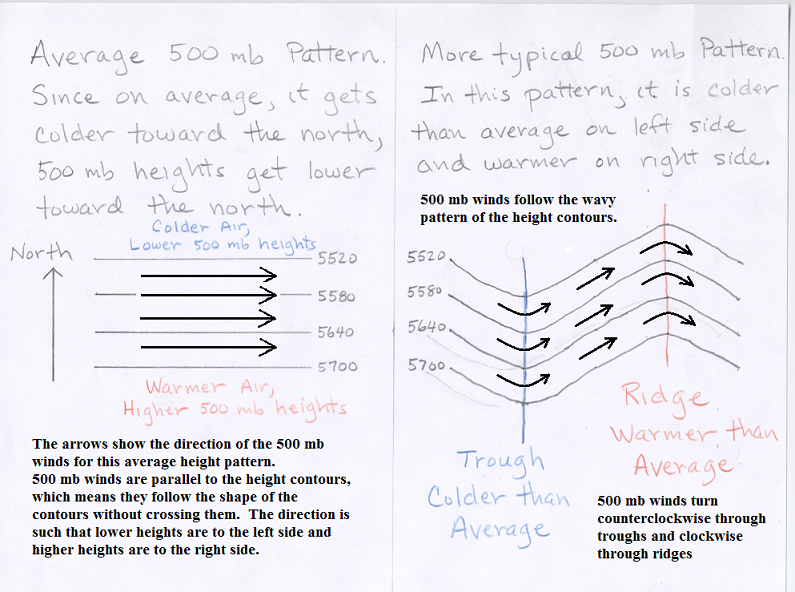
The wind at 500 mb can be estimated from the height pattern. The wind blows parallel to the height contours with lower heights to the left of the wind direction. In other words, the wind at the 500 mb height level moves along the pattern of the height contours, without crossing them, such that lower 500 mb heights are toward the left of the wind direction and higher 500 mb heights are toward the right of the wind direction. Wind direction has been added to the figure below, which was linked on the previous reading page.
|
| Arrows show the trajectory of the 500 mb wind for a flat 500 mb height pattern on the left and a wavy 500 mb pattern on the right. |
Because the air temperature across the United States generally decreases in value as you move from south to north, the 500 mb height generally decreases as you move from south to north as shown in the figure above. This means that the 500 mb winds over the United States generally move from west to east, though the winds follow the wavy patterns that are commonly observed in the 500 mb height field. Keep in mind that this is the wind at the altitude where the air pressure is 500 mb, which is several thousand meters above the Earth's surface, and not the wind that would be felt on the ground.
In addition to the wind direction, the relative speed of the 500 mb winds can be inferred from the 500 mb height pattern. The wind speed is faster where the height lines are closer together, and slower where the height contours are spaced further apart. If this helps, you can think of the 500 mb height lines as channels through which the air moves. The wind follows the wavy pattern of the contour lines, and gets squeezed together where the lines get closer together, resulting in faster winds. This is just how water would flow in a hypothetical channel.
Two example maps are displayed below. The 500 mb height pattern is shown with labeled height contours. Arrows have been drawn to indicate the wind trajectories at selected locations on the maps. The color shading on these maps represents the wind speed at 500 mb as determined by the weather model. The important thing to note is that 500 mb wind speeds are highest where the contour lines are most closely spaced, while the 500 mb winds are slow where the contour lines are spaced further apart. See the color key for wind speeds below the maps. Areas with weak 500 mb winds speeds (less than 20 knots) are displayed in white. Notice that the height contours are spaced far apart in these areas. Notice also that the stronger winds happen where the height contour lines are spaced closer together. You are not expected to be able to determine actual wind speeds, just to point out areas where the winds are relatively strong and places where the winds are relatively weak. The contour interval on these maps is 6 decameters, rather than the 3 decameter intervals that were shown on the height anomaly maps.
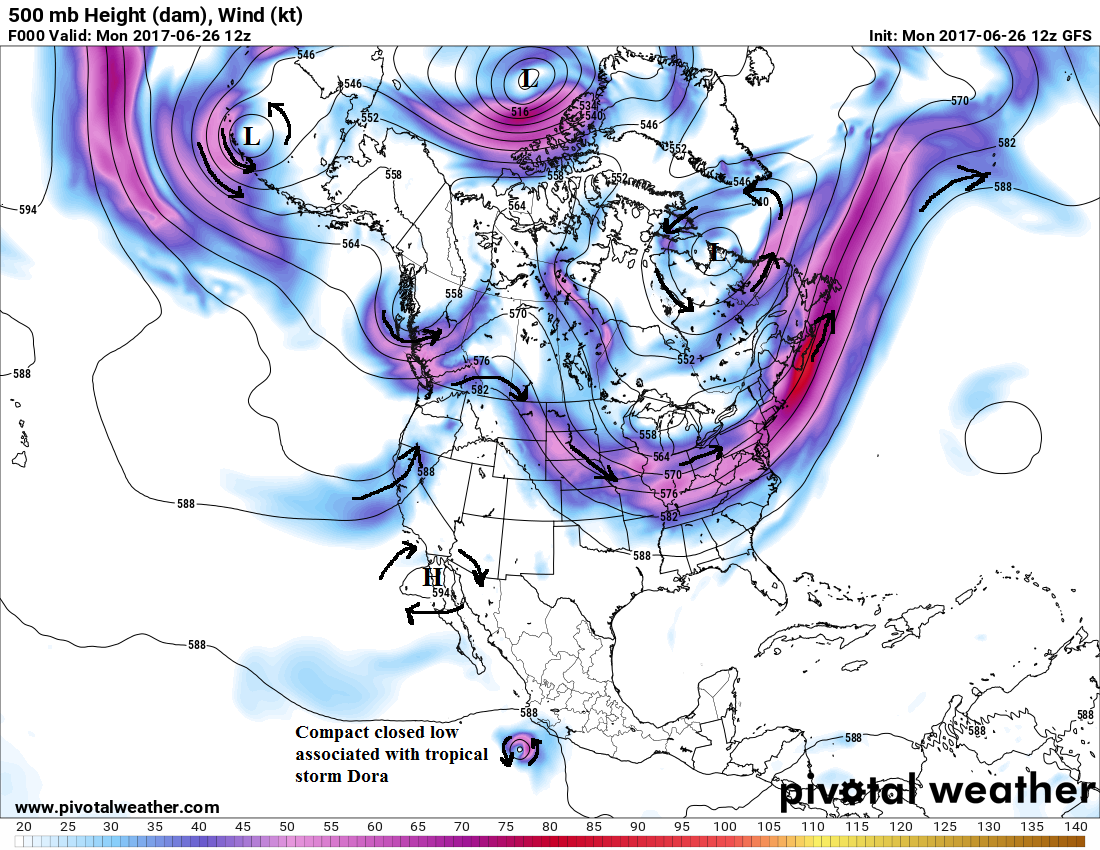
Map of the 500 mb height pattern for June 26, 2017 at 12Z. 500 mb wind trajectories are shown at various locations using bold arrows. The color shading indicates the 500 mb wind speed in knots (nautical miles per hour) with color key at the bottom. Generally, the closer the spacing of the contour lines, the faster the wind speed. Click on the image above to open a larger version. |
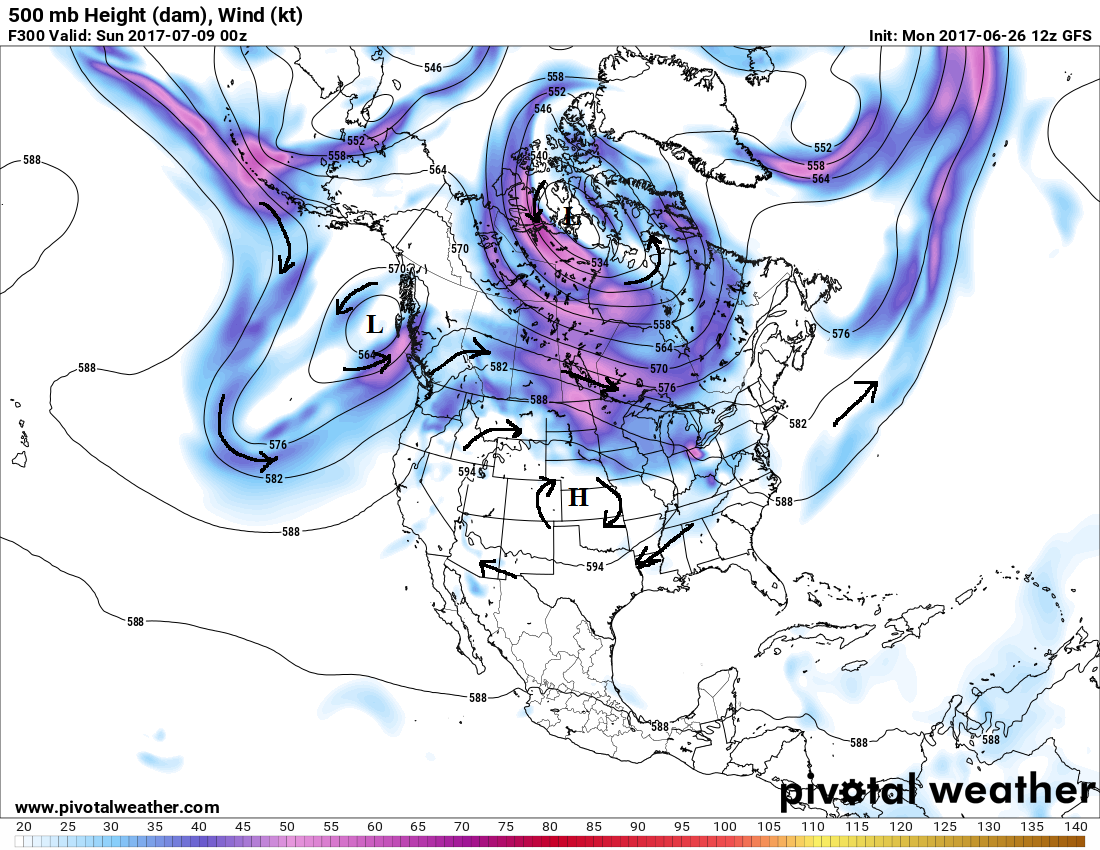
Map of the 500 mb height pattern forecasted for July 9, 2017 at 00Z. 500 mb wind trajectories are shown at various locations using bold arrows. The color shading indicates the 500 mb wind speed in knots (nautical miles per hour) with color key at the bottom. Generally, the closer the spacing of the contour lines, the faster the wind speed. Click on the image above to open a larger version. |
The wind trajectory arrows shown on the maps above are parallel to the height contours and point in the direction such that lower 500 mb heights are to the left and higher 500 mb heights are to the right. Each map contains one closed high and several closed lows. Following the rules for 500 mb wind direction, the 500 mb air flow around closed highs turns clockwise, just as for ridges, and the 500 mb air flow around closed lows is counterclockwise, just as for troughs.
The pattern of wind flow is the perferable way to identify troughs and ridges on 500 mb height maps. In general troughs and ridges do not have to be oriented along a north-south axis. The best way to identify troughs and ridges is to visualize the 2-Dimensional wind trajectory based on the 500 mb height pattern. The wind trajectory traces the motion of air. With troughs (and closed lows) the air flow makes a counterclockwise turn and with ridges (and closed highs) the air flow makes a clockwise turn in the Northern Hemisphere. We are only going to discuss weather maps for the Northern Hemisphere and will not confuse the situation by covering differences between the Northern and Southern Hemisphere. In looking at these maps, you may notice that troughs and ridges come in a wide range of sizes. Some are quite small and may appear as a small wiggle along one of the contour lines, while others can include many contour lines and be almost as large as the entire continental United States. For this class you will only be expected to identify large and easy-to-find troughs and ridges.
The 500 mb winds have a large influence on the motion of smaller-scale weather features, such as the movement of surface low pressure areas, the movement of hurricanes, and the movement of individual thunderstorm cells. In this context, smaller-scale means small compared to the size of the larger scale trough and ridge pattern. For these reasons, the winds at the altitude of the 500 mb pressure level are often referred to as the "steering level" winds. In fact where thunderstorms do form, they generally move as a unit in the direction of the winds near the 500 mb pressure level. This is something that we will pay attention to when local (Tucson, AZ) thunderstorms form. Note that we have only covered how to interpret the 500 mb winds based on the height pattern. We have not discussed the forces that cause the wind to blow.
A visualization of the relationship between the 500 mb height pattern and the winds at high alitudes can often be seen by looking at a movie of the 500 mb height pattern superimposed over a satellite image that is sensitive to the motions of clouds and water vapor at high altitudes. The weather data available from the UA Department of Atmospheric Sciences produces a movie showing the evolutions of the 500 mb height pattern over the last 24 hours (one frame per hour) superimposed on what is known as a satellite "water vapor image." The water vapor image is able to "see" or "sense" the presence of clouds and relatively high water vapor concentrations at high altitudes. Although, it is most sensitive to clouds and water vapor at altitudes higher than the 500 mb height (lower air pressure), the winds at those altitudes are often similar to those at 500 mb. When you look at the loop, notice that the features in the water vapor image generally move parallel to the 500 mb height pattern with lower heights to the left of the wind direction. It can be a bit tricky because the 500 mb height pattern is changing with time along with the winds. Link to 500 mb movie for the last 24 hours
The North American Monsoon (sometimes called the Mexican Monsoon or the Arizona Monsoon or the Southwest United States Monsoon) is experienced as a dramatic increase in rainfall from an extremely dry late spring season to a rainy summer season. The North American Monsoon region includes northwestern Mexico and parts of the US desert southwest. While the most notable change in our weather is the increase in moisture and precipitation during the monsoon season, it should be pointed out the meteorological definition of a Monsoon is simply a seasonal shift in wind direction. Monsoonal shifts in winds around the world are often associated with changes in precipitation, but they need not be.
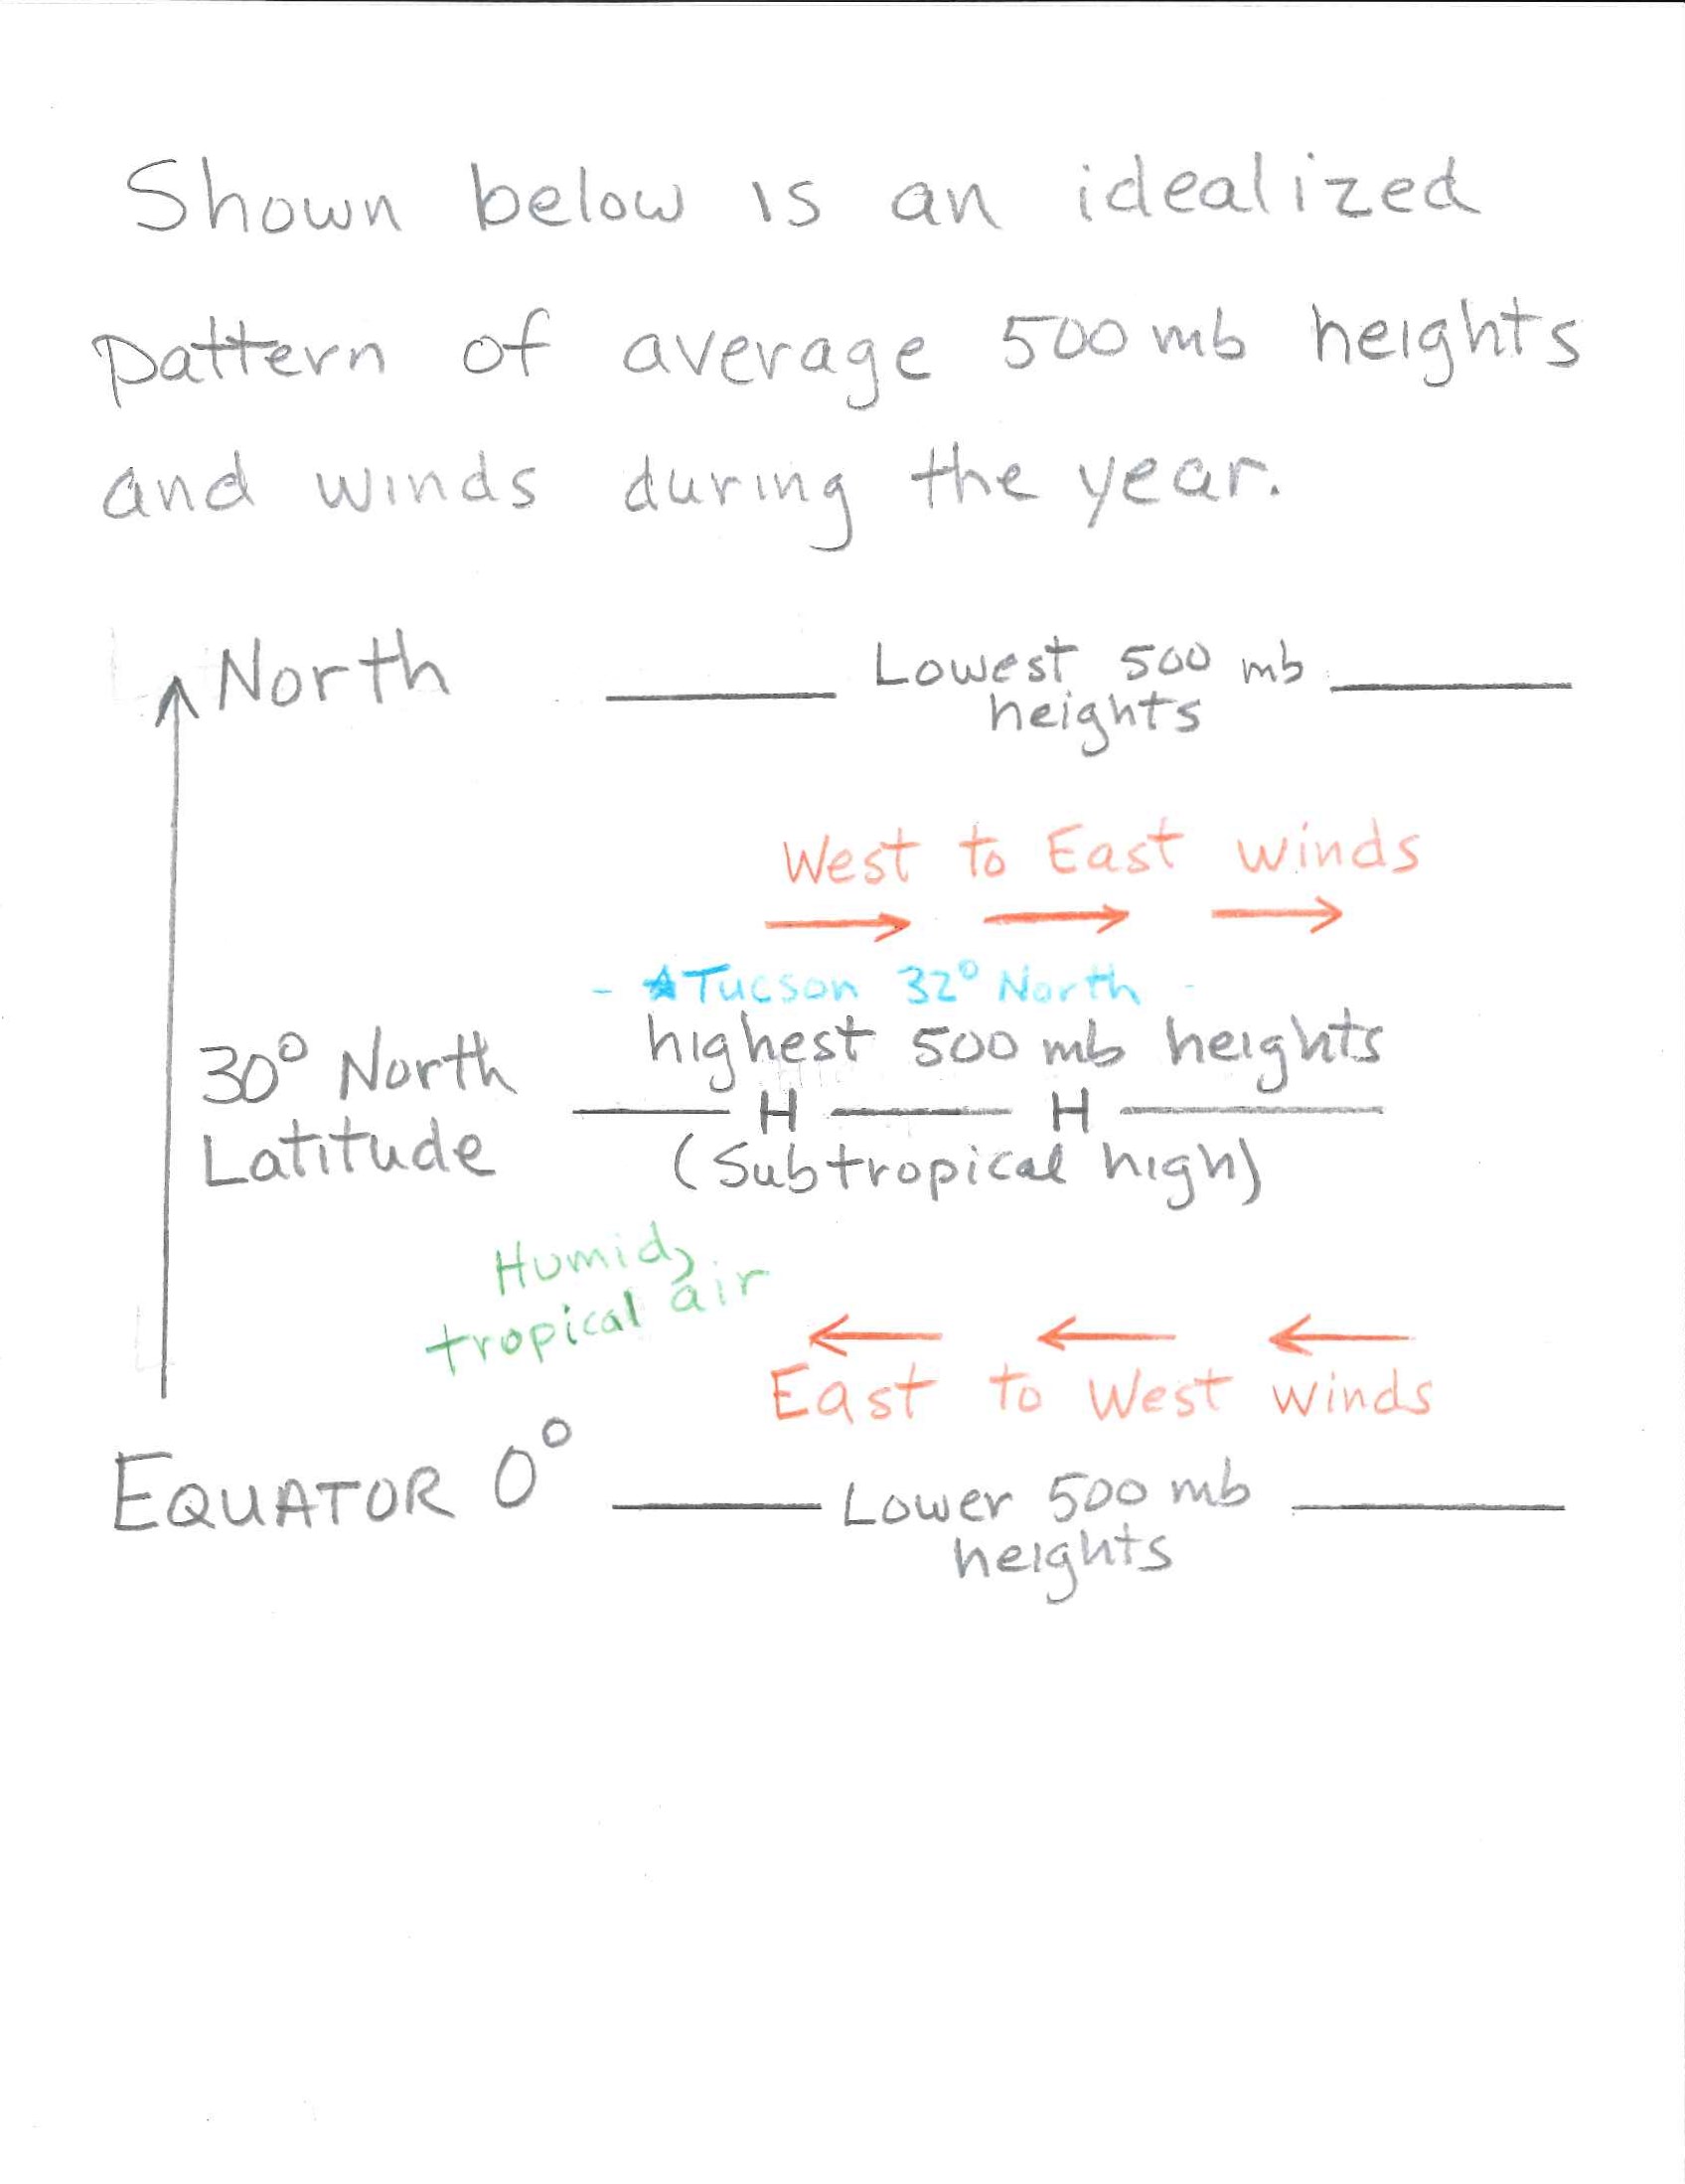
On average, the climate of Earth is characterized by a belt of high 500 mb heights at around 30° North latitude. This semi-permanent ring of high 500 mb heights is called the subtropical high. Lower 500 mb heights are found both to the north and to the south of the subtropical high region. The wind flow at 500 mb is parallel to the height contour pattern, with lower heights to the left of the wind direction. This means the 500 mb winds are generally west toward east north of the subtropical high and east toward west south of the subtropical high as shown in the figure below on the left. (Here is a link to a similar hand-drawn figure.) For most of the year, Tucson, which is located at 32°N latitude, is north of the subtropical high and the 500 mb winds over Tucson are generally west to east. At lower levels in the atmosphere, the air south of the subtropical high is typically humid, tropical air containing a lot of water vapor, while the air near the subtropical high is typically much drier and contains much less water vapor.
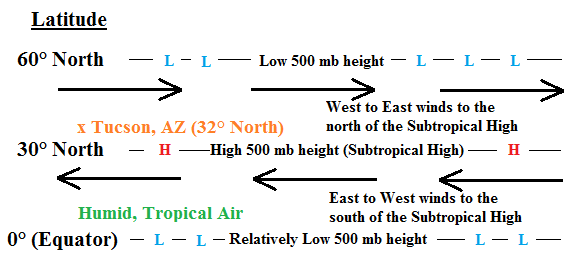
Typical pattern of 500 mb height and winds in the Northern Hemisphere. The highest 500 mb heights are typically centered at about 30° latitude, with lower 500 mb heights to the north (at 60° latitude) and to the south (at 0° latitude). Arrows show the 500 mb wind direction. 500 mb winds are west to east on the north side of the Subtropical High and east to west on the south side of the Subtropical High. Note that Tucson, which is at 32° latitude, is north of the subtropical high within the zone of west to east 500 mb winds. |
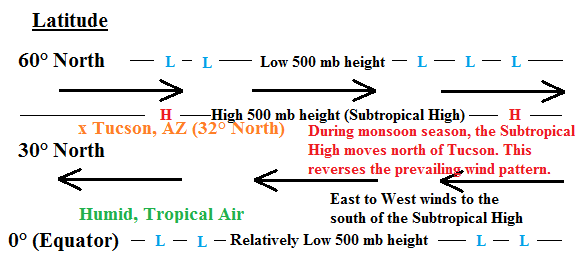
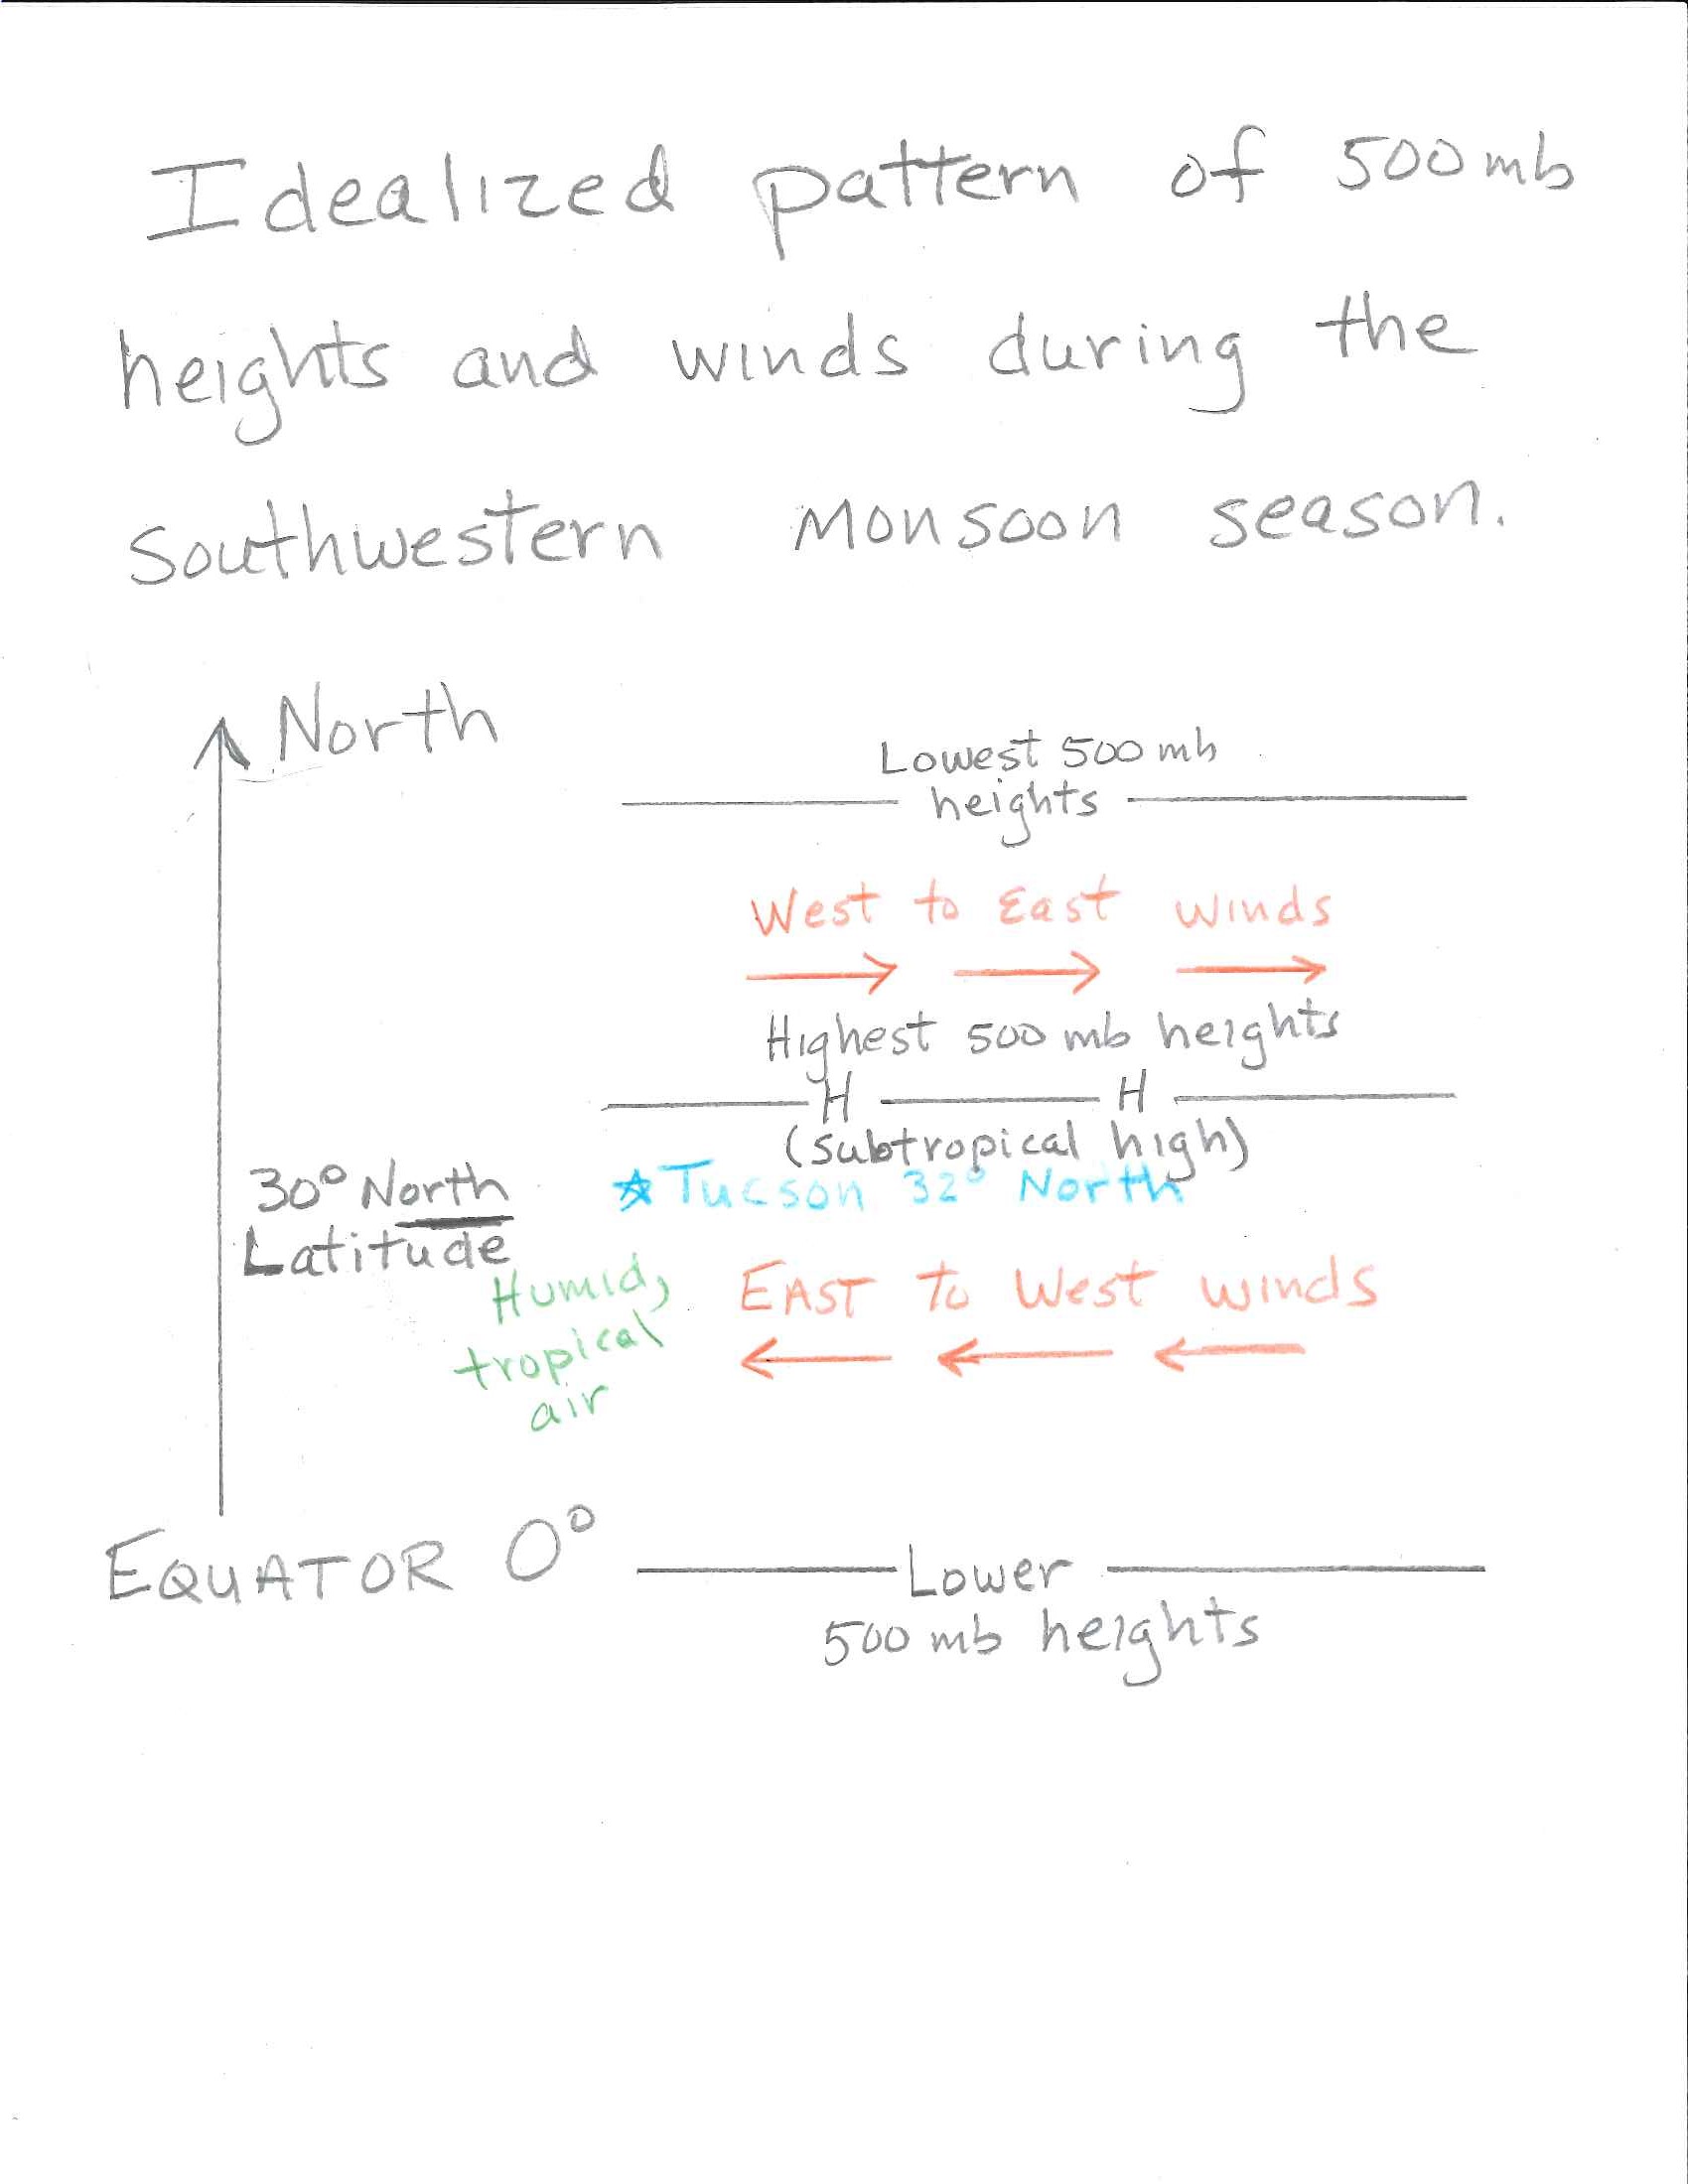
Pattern of 500 mb height and winds in the Northern Hemisphere during the North American Monsoon season. The position of the highest heights, the Subtropical High, has shifted north. Arrows show the 500 mb winds for this 500 mb height pattern. Note that during the monsoon season, the Subtropical High is north of Tucson, which places Tucson within the zone of east to west 500 mb winds. The air in this zone is more humid and tropical, which results in local thunderstorms during the monsoon season. |
The North American Monsoon is associated with the northward movement of the position of the subtropical high that occurs from June through September. As the center of the subtropical high moves to the north of Tucson, the 500 mb winds shift direction to become east to west. This is an indication of the monsoonal wind shift that happens over the southwestern US and northern Mexico. This is shown in the right panel of the figure above. (Here is a link to a similar hand-drawn figure.) During the spring months of the year, the subtropical high pressure cell is south of Arizona, and Arizona experiences generally westerly air flow with generally dry air masses. During the summer monsoon season, the center of the 500 mb subtropical high moves north of Arizona. This places Arizona in generally easterly air flow with much more humid, tropical air masses. The specific center of high heights that forms in this part of the world during the summer season commonly shows up as a closed high on a 500 mb height map and is often called the monsoonal high. Rainfall during the monsoon season is not continuous. It varies considerably, depending on a variety of factors. There are usually distinct "burst" periods of heavy rain during the monsoon, and "break" periods with little or no rain. Monsoon precipitation, however, accounts for a substantial portion of annual precipitation in northwest Mexico and the Southwest U.S. Most of these areas receive over half their annual precipitation during the monsoon season.
As mentioned above, the typical 500 mb flow over the southwestern United States is generally westerly (west to east). One indicator of the southwest monsoon is to have higher 500 mb heights form to the north of southern Arizona. This results in a wind shift at 500 mb, resulting in 500 mb winds that have an easterly component, i.e., winds from east toward west. This can be understood by applying the rule for 500 mb wind direction. With higher 500mb heights to the north of Tucson and lower 500 mb heights to the south of Tucson, the 500 mb wind direction will be generally east to west.
The meteorological definition of a Monsoon is simply a seasonal shift in wind direction. Often a monsoon season
is also characterized by a shift in precipitation (as it is in the southwestern United States and India), but it need not be.
The term monsoon is often misused, even by many TV weather reporters. It is incorrect to call a summer thunderstorm
a "monsoon" or to say it is "monsooning" outside during a summer thunderstorm. There is a monsoonal shift in winds that
happens every year in the southwestern United States and northwestern Mexico though. This shift in wind patterns is most
easily seen by looking at the seasonal shift in wind direction that occurs at the 500 mb pressure level. Below are links to
higher resolution monthly average 500 mb height maps that have been annotated to show the monsoonal shift in wind direction
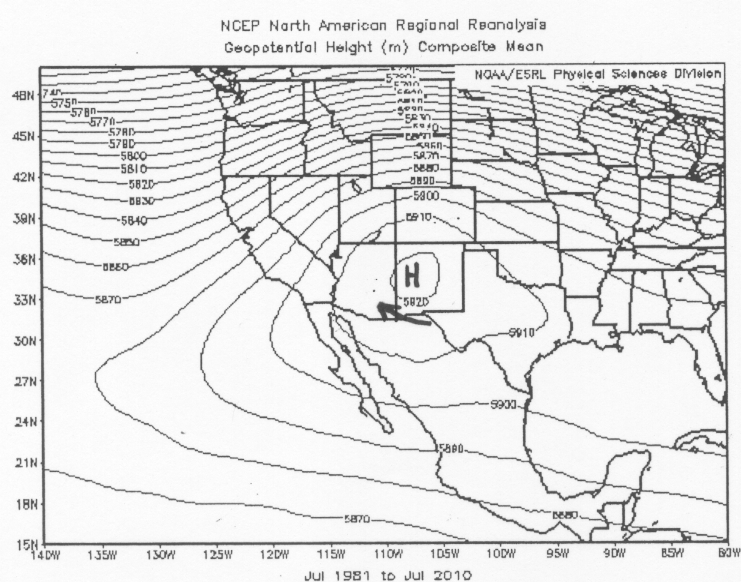
that takes place during the months of July and August over the southwestern United States. In the figures below the 500 mb
height contours are shown every 10 meters to better show the wind
direction at 500 mb in Tucson. The bold 'H' indicates where the highest 500 mb heights are located in the vicinity of
the southwestern
United States. The bold arrow indicates the 500 mb wind direction in Tucson based on the average height pattern shown.
Notice that the average wind direction is southwest (from the southwest) during the month of June. This is prior to
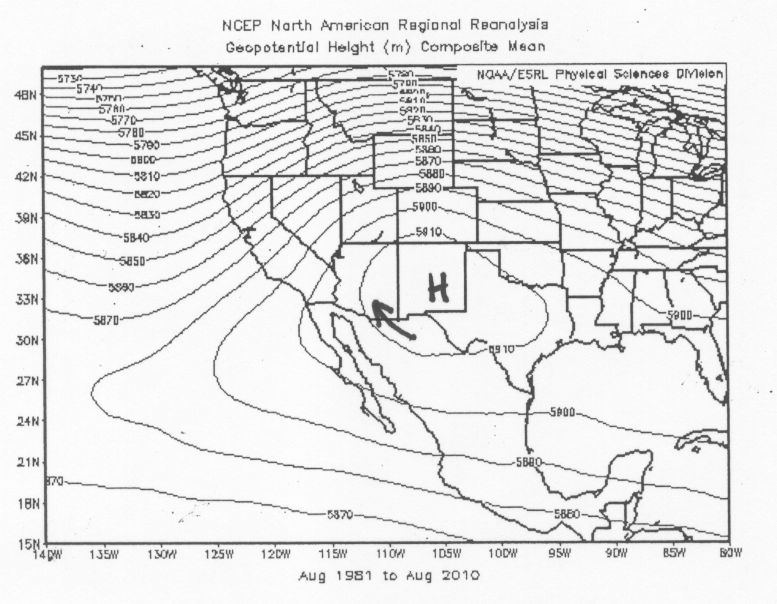
the monsoon season. During the monsoon months of July and August, the 500 mb high moves to the north and
east of Tucson and the average wind direction is from the east and
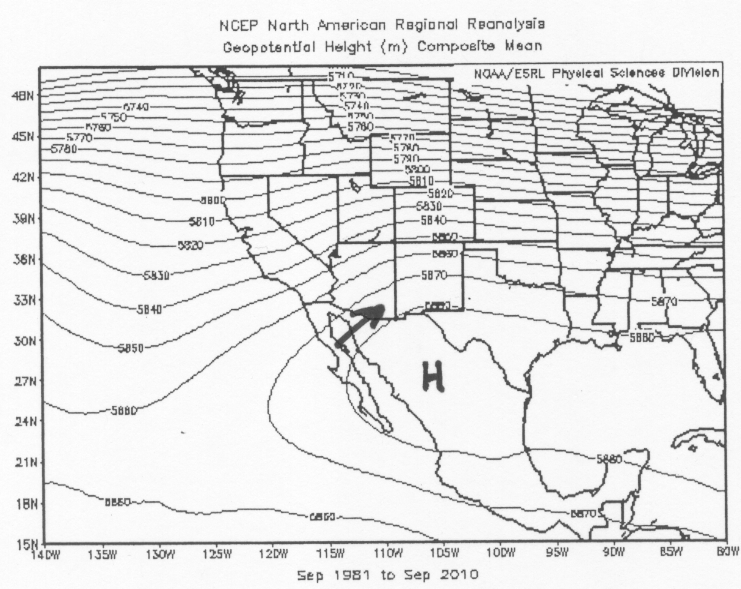
southeast. In September, the high center moves back to the south of Tucson, the wind direction shifts back to southwest,
which indicates the end of the monsoon season.
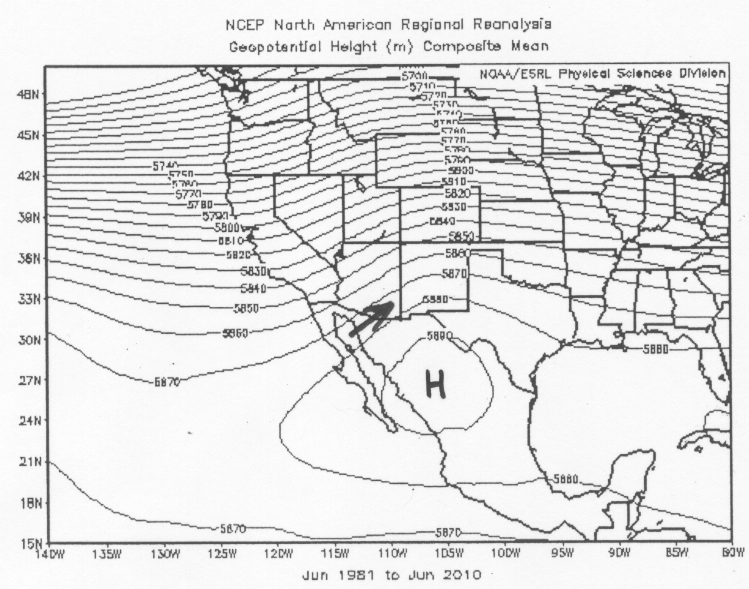
June Average 500 mb heights and Tucson wind direction
July Average 500 mb heights and Tucson wind direction
August Average 500 mb heights and Tucson wind direction
September Average 500 mb heights and Tucson wind direction
Please also read over the following link, North American Monsoon article by the NWS. You should understand graphics 2 and 3, which show the monsoonal wind shift at the 500 mb height levels (Graphic 1 shows typical wind patterns just above the ground surface during the monsoon season, which we are not covering in this course). Graphic 3 shows one favorable position for the "monsoon high" in the sense that there are southeast winds at 500 mb over Tucson. As long as there is an easterly component to the 500 mb wind direction, Tucson will generally be favored for thunderstorms. Basically if the high center is north of Tucson, there will be an easterly component to the 500 mb wind direction. The chance for thunderstorms also depends on whether or not there is sufficient water vapor in the atmosphere as discussed in the later section.
In reality, the local 500 mb height pattern changes from day to day and a monsoonal height and wind pattern comes and goes throughout the months of June through September. The officially defined monsoon season runs from June 15 through September 15, though the center of the monsoon high shifts around and is not expected to be north of Tucson during this entire period. It is common for there to be periods of several days to a week with favorable conditions for thunderstorms followed by several days to a week of unfavorable conditions. When the center of highest heights is south of Tucson, rain generally does not fall in Tucson. Worse yet, when the high center is directly overhead, not only is it generally rain-free, but also quite hot as the core of warmest air is right over us. The best chances for summer rains in Tucson happen when the 500 mb high center is north of our area. The 500 mb map for June 26 that was shown above is an example of a 500 mb height pattern that is unfavorable for summertime thunderstorms in Tucson. On that map, there is a high center located to the southwest of Tucson, and the 500 mb windflow over Tucson is from the northwest, which is not favorable for clouds and rain, since the wind is coming from a westerly direction. Notice that the 500 mb height over Tucson is about 5930 meters, which is above the June average of 5870 meters. Thus, we expect above average temperature and no rain for Tucson based on the map for June 26.
An example of a 500 mb height pattern which is more favorable for thunderstorms in Tucson is shown in the 500 mb map for July 9 that was shown above. On that map a huge closed high is located over the center of the country, which is well north of Tucson. The huge 594 decameter closed contour runs right across Arizona. The 500 mb wind direction over Tucson is from an easterly direction, which is a monsoon flow. The 500 mb height over Tucson is about 5930 meters on this map. This is slightly above the average height of 5920 meters for July. Thus, we expect near to slighlty above average temperature with a chance of monsoon season rain for Tucson based on the map for July 9.
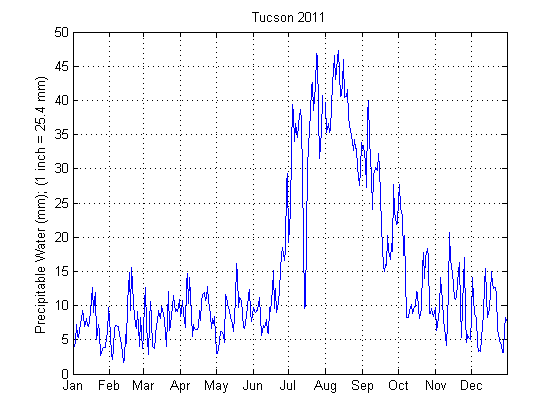
The monsoon season happens every year in the southwestern United States. While a monsoon is defined by the seasonal change in winds, monsoons are often associated with changes in humidity and precipitation. The change in water vapor content during the North American Monsoon is obvious when looking at the changes in precipitable water over a year, for example, Tucson daily average precipitable water for 2011.
During the early part of the semester, we are going to look at forecasts of the 500 mb height pattern produced by computer models to make simple weather forecasts for Tucson. I plan to add an explained example below. 500 mb forecast maps will also be posted and discussed on class announcement and discussion boards.
As you may know if you are from Tucson or as you may learn if you follow local weather during the monsoon season, accurately predicting whether or not Tucson will get thunderstorms on a given day is very difficult. Looking at forecasts of the 500 mb height pattern, we can determine if the large scale weather pattern and winds are favorable for monsoon season thunderstorms, but making precise forecasts for exactly where thunderstorms will form and move is much more difficult. The department of Atmospheric Sciences runs a local weather model, which makes forecasts for a portion of the southwest US and northwest Mexico. If you are interested in an alternative weather forecast for Tucson, check out Regional Weather Forecast Models and Products for southeast Arizona from ATMO WRF Model. Keep in mind that we have only covered a few aspects about thunderstorm formation during the monsoon season. There is much more to consider when forecasting the possibility of thunderstorms on a given day. Some of these, such as instability in the atmosphere, which is required for thunderstorms and favorable wind shear profiles, which is how the horizontal winds change with increasing height, will be covered later in the semester.
![]()
![]()
![]()
![]()