Tuesday Dec. 1, 2015
Music this morning from: Haim "I'll
Try Anything Once", "Honey & I"
(live, played in the 9:30 class), "If I Could
Change Your Mind", "Better Off",
"Hazy Shade
of Winter". And an extra bonus "Hazy Shade of
Winter" live in 2011 with The Bangles.
The 1S1P reports and the Optional Assignments dealing with El
Nino were collected today. Classes end next week, so this
will be the last assignment of the semester.
The 1S1P reports on Foucault's Pendulum and Thermal
Circulations & the 3-Cell Model have been graded and were
returned today.
The U. of A. Teacher/Course Evaluation for this
class is conducted online, here is the link to use: https://tce.oirps.arizona.edu/TCEOnline
. The link will remain active until 11:59 pm on
Wed., Dec. 9. This doesn't allow for written comments
about the class. I'll probably give you an opportunity
to do that next Tuesday. I also plan to hand out grade
summaries next Tuesday. They'll tell you whether you
need to take the Final Exam or not.
Speaking of the Final Exam. I'm starting to get
questions about the exam and requests to take the Final
early. Two exams are scheduled for my two sections of
this class. They're listed below. You can take the
exam on either of the dates below. I'm going to have a
hard enough time getting the exams ready by Dec. 15 and
17. There's no way I can have an exam ready for students
to take at the end of next week. If you really have to
leave town early you'll need to take an incomplete in the
class and take the exam sometime early next semester.
The final topic we'll cover this semester is hurricanes.
On average, hurricanes kill 20 people per year in the
United States and cause about $5 billion of damage.
As the table below indicates though there are exceptional years
(such as 2005) where the death and damage totals greatly exceed
these average values (data are from
http://www.nws.noaa.gov/om/hazstats.shtml)
Year
|
Deaths
|
Total
Damage
(billion $ ))
|
2000
|
0
|
<
1
|
2001
|
24
|
5.2
B
|
2002
|
51
|
1.4
B
|
2003
|
14
|
1.9
B
|
2004
|
34
|
19.6
B
|
2005
|
1016
|
95 B
|
2006
|
0
|
<
1
|
2007
|
1
|
<
1
|
2008
|
12
|
8 B
|
2009
|
2
|
<
1
|
2010
|
0
|
<
1
|
2011
|
9
|
<1
|
2012
|
4
|
<1
|
2013
|
1
|
<1
|
2014
|
0
|
<1
|
2005 was, of course, the year
hurricane Katrina hit New Orleans. Three of the ten
strongest hurricanes ever observed in the N. Atlantic occurred
in 2005 (Wilma was the strongest and the new record holder, Rita
was the 4th and Katrina the 6th strongest). The deadliest
hurricane in US history is the 1900 Galveston hurricane which
caused 6000 - 12,000 deaths. The Great Hurricane of 1780
killed over 20,000 people in the Lesser Antilles. Historic
rainfall amounts (75 inches perhaps in some locations) and
flooding associated with Hurricane Mitch killed over 19,000
people in Honduras, Guatemala, and Nicaragua in 1998.
Death and damage information from "superstorm Sandy" in 2012 is
not included in the table above because the storm had become an
extratropical cyclone by the time it struck New Jersey and New
York. Overall the storm (both as a hurricane and an
extratropical cyclone killed about 235 people and caused about
$75 B in damage) in the US and countries in the Caribbean.
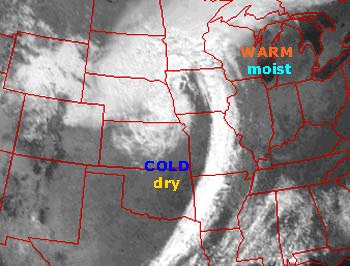
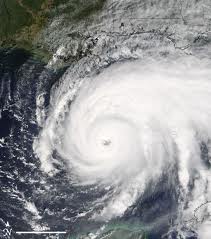
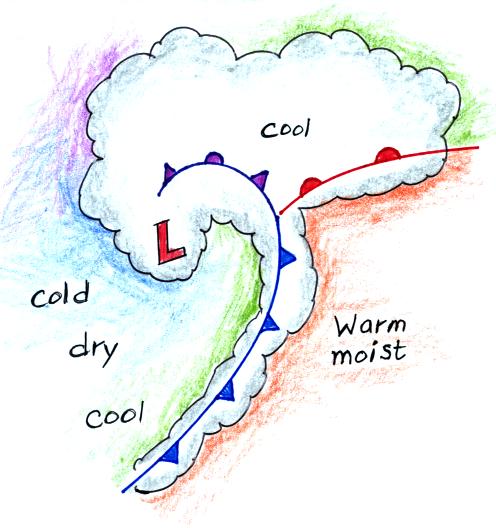
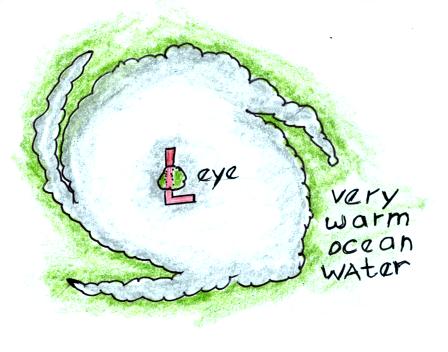
Tropical and extratropical cyclones - similarities and
differences
A good place to begin is to compare hurricanes (tropical cyclones)
with middle latitude storms (extratropical cyclones). These
are the two largest types of storm systems found on the earth.
Satellite photographs and sketches of the two types of storm
system are shown below (the hurricane photo shows Rita in 2005)
Next we'll list some of the similarities (first table
below) and differences (second table; the left column applies to
middle latitude storms, the right most column to hurricanes)
between these storms.
Similarities
|
both types of storms
have low pressure centers
(the term cyclone refers to winds blowing around
low pressure) |
upper level divergence
is what causes both types of storms to intensify
(intensification means the surface low pressure
gets even lower)
|
Differences
(the order may differ from that given in class)
|
1. Middle latitude
storms are bigger,
perhaps 1000 miles in diameter (half the US)
|
1. Hurricanes are
smaller,
100s of miles in diameter (fill the Gulf of Mexico)
|
2. Formation can occur
over land or water
|
2. Can only form over
warm ocean water
weaken rapidly when they move over land or cold water
|
3. Form at middle (30o
to 60o) latitudes
|
3. Form in the sub
tropics, 5o to 20o latitude
|
4. Prevailing westerlies
move these storms
from west to east
|
4. Trade winds move
hurricanes
from east to west
|
5. Storm season: winter
to early spring
|
5. Storm season: late
summer to fall
(when ocean water is warmest)
|
6. Air masses of
different temperatures collide along fronts
|
6. Single warm moist air
mass
|
7. All types of
precipitation: rain, snow, sleet freezing rain
|
7. Mostly just lots (a
foot or more) of rain
|
8. Only an occasional
storm gets a name (becoming a little more common)
("The Perfect Storm", "Storm of the Century", etc.)
|
8. Tropical storms &
hurricanes gets names
|
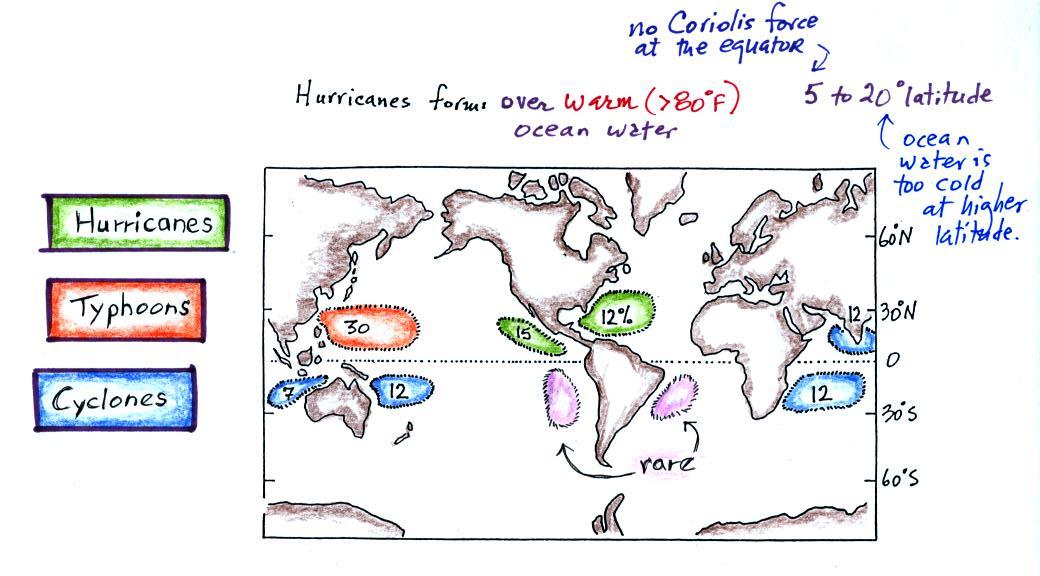
Hurricanes, cyclones, and typhoons
The figure above shows the relative frequency of
tropical cyclone development in different parts of the
world. The name hurricane,
cyclone, and typhoon all refer to the same type of storm (tropical
cyclone is a generic name that can be used anywhere). In
most years the ocean off the coast of SE Asia is the world's most
active hurricane zone. Hurricanes are very rare
off the east and west coasts of South America. The
most famous is probably category 2 Cyclone
Catarina which hit Santa Catarina state in southern Brasil
in March 2004.
Hurricanes form between 5 and 20 degrees latitude,
over warm ocean water, north and south of the equator.
The warm layer of water must be fairly deep to contain enough
energy to fuel a hurricane and so that turbulence and mixing
don't bring cold water up to the ocean surface. The
atmosphere must be unstable so that thunderstorms can
develop. Hurricanes will only form when there is very
little or no vertical wind shear (changing wind direction or
speed with altitude). Hurricanes don't form at the
equator because there is no Coriolis force there (the Coriolis
force is what gives hurricanes their spin and it causes
hurricanes to spin in opposite directions in the northern and
southern hemispheres).
Note that more tropical cyclones form off the west coast of the
US than off the east coast. The west coast hurricanes don't
generally get much attention, because they move away from the
coast and usually don't present a threat to the US (except
occasionally to the state of Hawaii). The moisture from
these storms will sometimes be pulled up into the southwestern US
where it can lead to heavy rain and flooding.
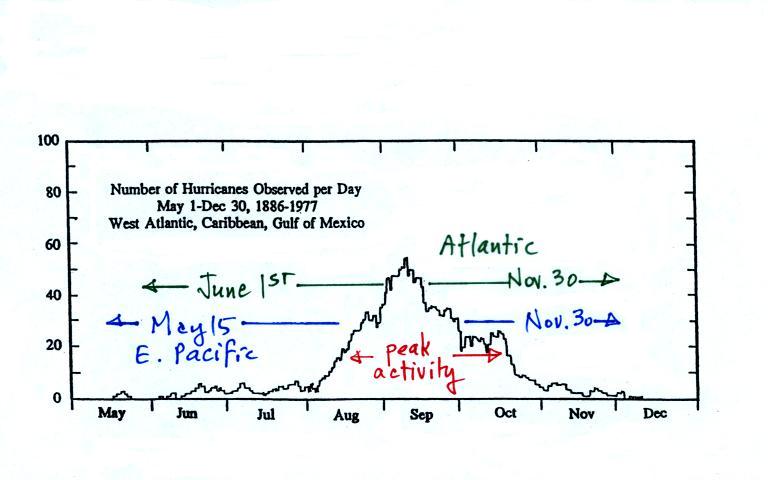
Hurricane season
Hurricane season in the Atlantic officially runs from June 1
through to November 30. The peak of hurricane season is in
September. In 2005, an unusually active hurricane
season in the Atlantic, hurricanes continued through December
and even into January 2006. Hurricane season in the
Pacific begins two weeks earlier on May 15 and runs through Nov.
30.
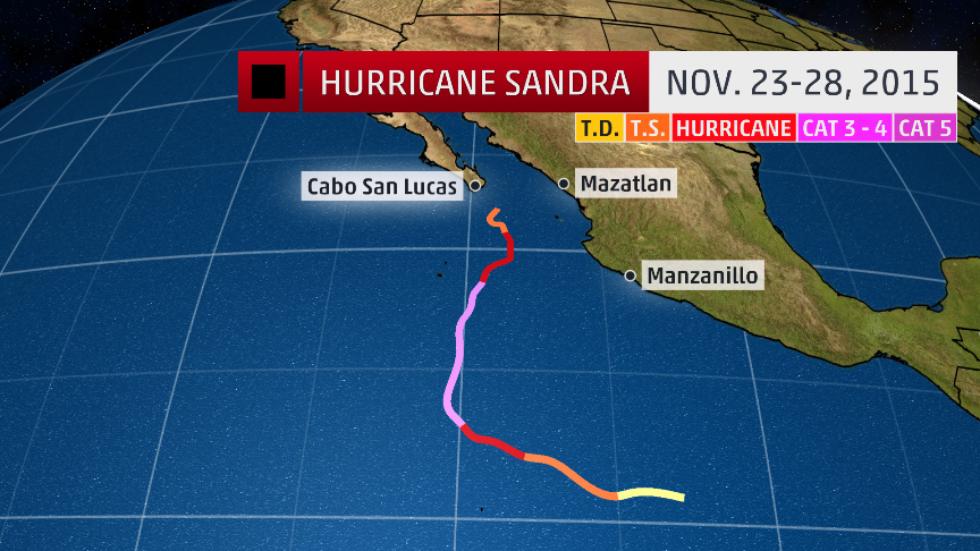
The figure above (from The
Weather Channel) shows the track of hurricane Sandra
approaching the west coast of Mexico several days ago.
Sandra became a category 4 hurricane on Nov. 26, the latest this
has ever happened in the eastern Pacific.
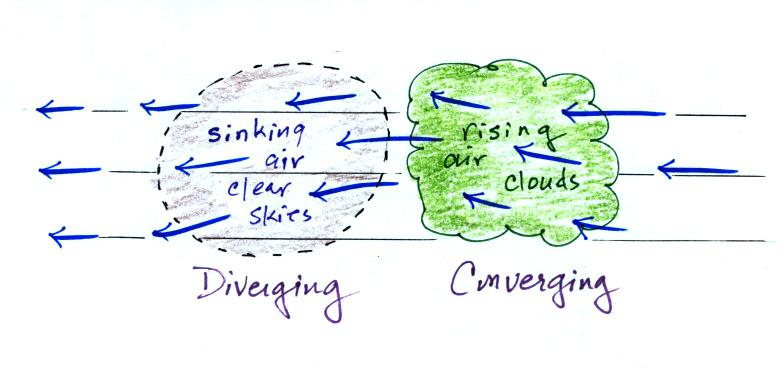
Hurricane
initiation - easterly waves
Some kind of meteorological process that produces low level
convergence is needed to initiate a hurricane. One
possibility, and the one that fuels most of the strong N. Atlantic
hurricanes, is an "easterly wave." This is just a "wiggle"
in the wind flow pattern. Here's a little bit
better sketch than the one on p. 142 in the photocopied
ClassNotes.
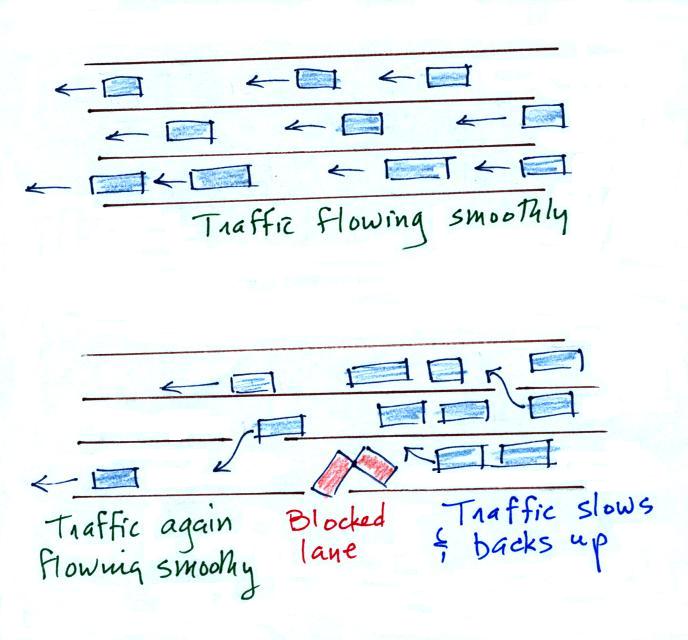
In some ways winds blowing through an easterly wave resembles
traffic on a multi-lane highway. Traffic will slow down
and start to bunch up as it approaches an obstruction.
This is like the convergence that occurs when air flows into an
easterly wave. Once through the "bottleneck" traffic will
begin to flow more freely. Easterly waves often
form over Africa or just off the African coast and then travel
toward the west across the N. Atlantic. Winds converge as
they approach the wave and then diverge once they
are past it . The convergence will cause air to rise and
thunderstorms to begin to develop.
| Normal hurricane
activity in the Pacific |
Normal hurricane
activity in the Atlantic |
16
tropical storms per year
8 reach hurricane strength
0 hit the US coastline |
10
tropical storms per year
6 reach hurricane strength
2 hit the US coastline |
In an average year, in the N. Atlantic, there will be
10 named storms (tropical storms or hurricanes) that develop
during hurricane season. 2005 was, if you
remember, a very unusual year. There were 28 named
storms in the N. Atlantic in 2005. That beat the previous
record of 21 names storms that had been set in 1933. Of
the 28 named storms, 15 developed into hurricanes.
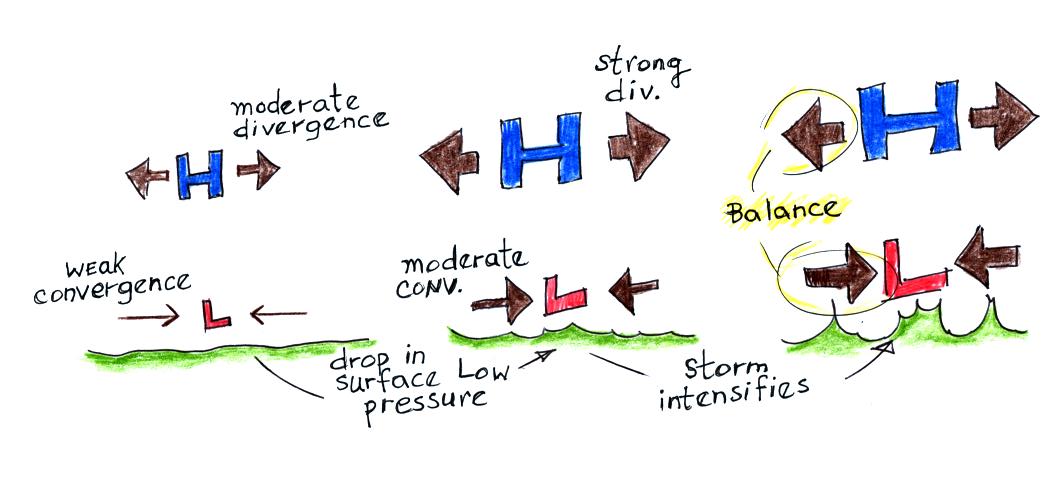
Low pressure & converging winds at the bottom of a
hurricane, high pressure & diverging winds at the top
This is a reasonably important figure. It
tries to explain how a cluster of thunderstorms can organize and
intensify into a hurricane.
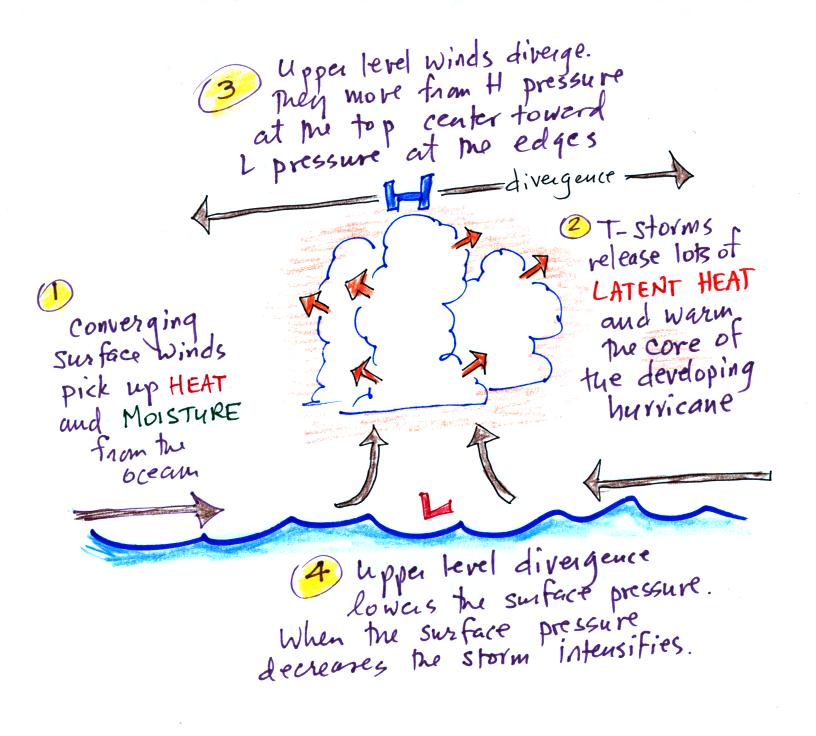
1. Converging surface
winds pick up heat and moisture from the ocean. These are
the two main sources of energy for the hurricane.
2. Rising air expands, cools, and thunderstorm
clouds form. The release of latent heat during
condensation warms the atmosphere. The core of a
hurricane is warmer than the air around it.
3. Pressure decreases more slowly with increasing
altitude in the warm core of the hurricane. The result is
that pressure at the top center of the hurricane is higher than
the pressure at the top edges of the hurricane (pressure at the
top center is still lower than the pressure at the bottom center
of the hurricane). Upper levels winds diverge and spiral
outward from the top center of the hurricane (you can sometimes
see this on satellite photographs of hurricanes).
4. The upper level divergence will cause the
surface pressure at the center of the hurricane to
decrease. The speed of the converging surface winds
increases and the storm intensifies. The converging winds
pick up additional heat and moisture which warms the core of the
hurricane even more. The upper level high pressure and the
upper level divergence increase. The increased divergence
lowers the surface pressure even more. The
lower the surface pressure gets, the stronger the storm
becomes.
As long as upper
level divergence exceeds surface convergence, the storm
will intensity
Here's another view of hurricane development and
intensification
In the figure at left the moderate divergence found at upper
levels is stronger than the weak surface convergence.
Divergence is removing more air than is being added by surface
convergence. The surface low pressure will decrease.
The decrease in surface pressure will cause the converging surface
winds to blow faster.
In the middle picture, the surface low pressure is lower, the
surface convergence has strengthened to moderate levels. The
upper level divergence has also strengthened. The upper
level divergence is still stronger than the surface convergence so
the surface low pressure will decrease even more and the storm
will intensify.
In the right figure the surface low pressure has decreased
enough that the strong surface convergence now balances the strong
upper level divergence. The storm won't strengthen any more.
Generally speaking the lower the surface pressure at the center
of a hurricane the stronger the storm and the faster the surface
winds will blow.
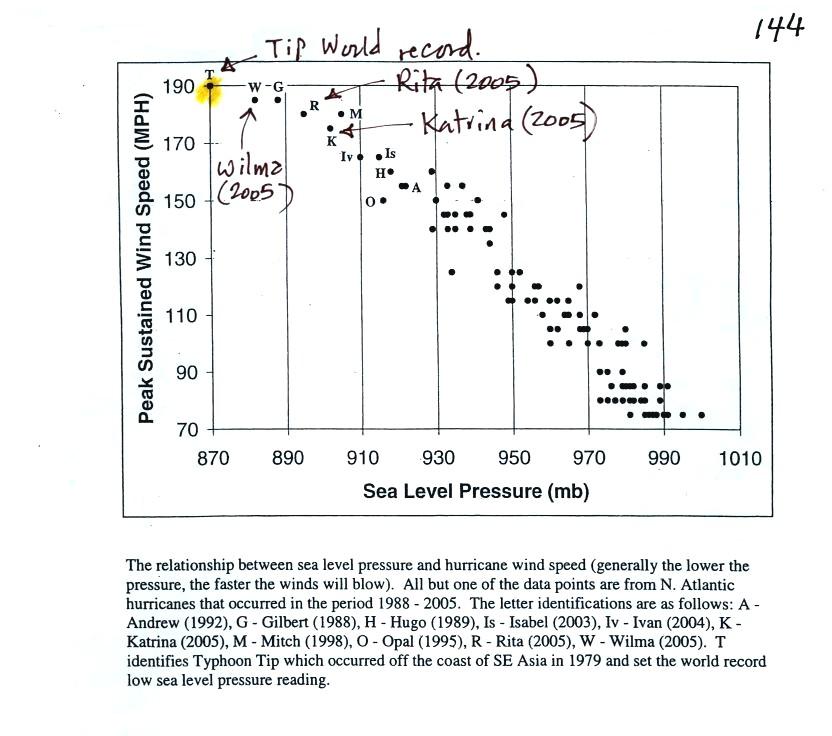
This figure tries to show the relationship between surface
pressure and surface wind speed. The world
record low sea level pressure reading, 870 mb, was set by Typhoon
Tip off the SE Asia coast in 1979. Sustained winds in
that storm were 190 MPH. Three 2005 Atlantic hurricanes:
Wilma, Rita, and Katrina had pressures in the 880 mb to 900 mb
range and winds ranging from 170 to 190 MPH. I
will need to add a new data point to this figure: Hurricane
Patricia from earlier in the semester (see
the Tue., Oct. 27 class notes). With sustained winds
of 200 MPH and a central pressure of 879 mb, it became the
strongest hurricane ever observed in the western hemisphere.
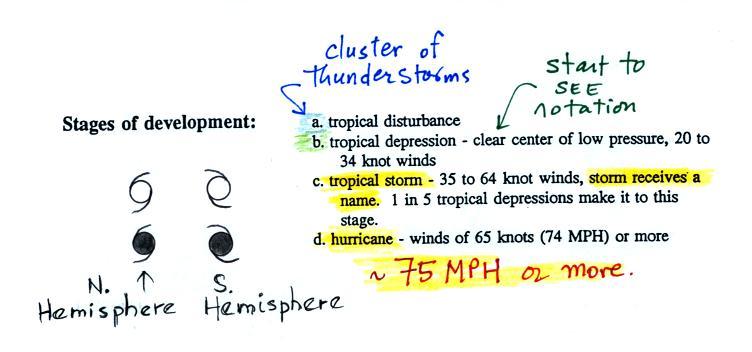
A tropical disturbance is just a localized cluster of
thunderstorms that a meteorologist might see on a satellite
photograph. But this would merit observation because of the
potential for further development. Signs of rotation would
be evidence of organization and the developing storm would be
called a tropical depression.
In order to be called a tropical storm the storm must
strengthen a little more, and winds must increase to 35
knots. The storm receives a name at this point.
Finally when winds exceed 75 MPH (easier to remember than 65 knots
or 74 MPH) the storm becomes a hurricane. You don't need to
remember all these names, just try to remember the information
highlighted above.
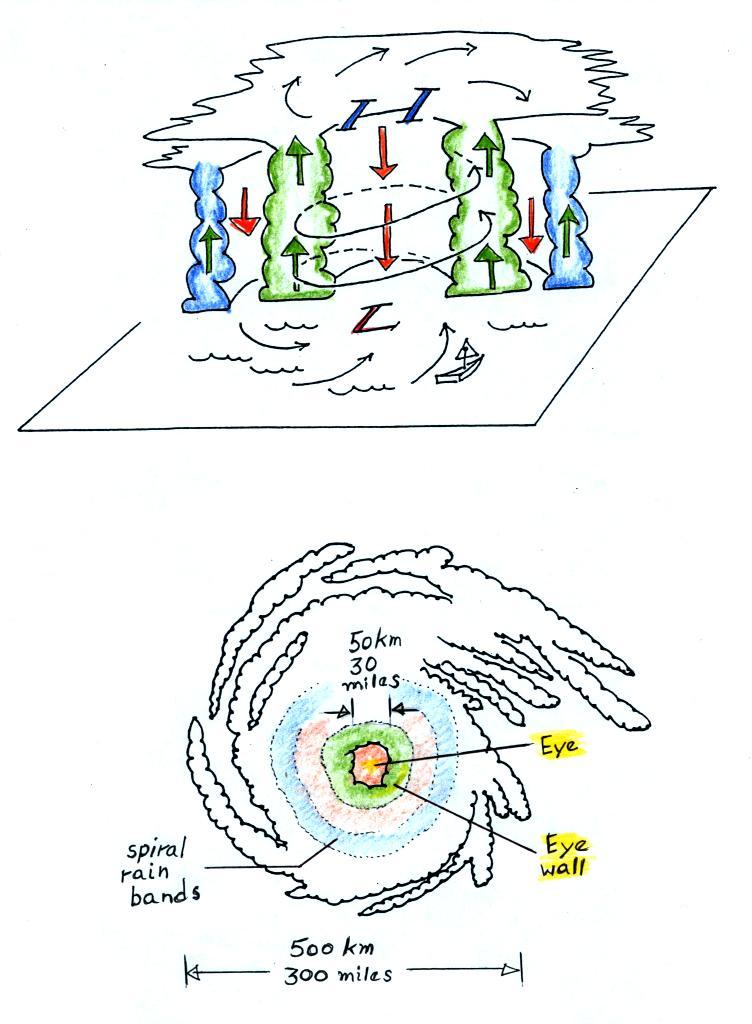
Hurricane features: eye, eye wall, spiral
rain bands
A crossectional view of a mature hurricane (top) and a picture
like you might see on a satellite photograph (below).
Sinking air in the very center of a hurricane produces the
clear skies of the eye, a hurricane's most distinctive
feature. The eye is typically a few 10s of miles across,
though it may only be a few miles across in the strongest
hurricanes. Generally speaking the smaller the eye, the
stronger the storm.
A ring of strong thunderstorms, the eye wall, surrounds the
eye. This is where the hurricane's strongest winds are
found.
Additional concentric rings of thunderstorms are found as you
move outward from the center of the hurricane. These are
called rain bands. These usually aren't visible until you
get to the outer edge of the hurricane because they are covered by
high altitude layer clouds.
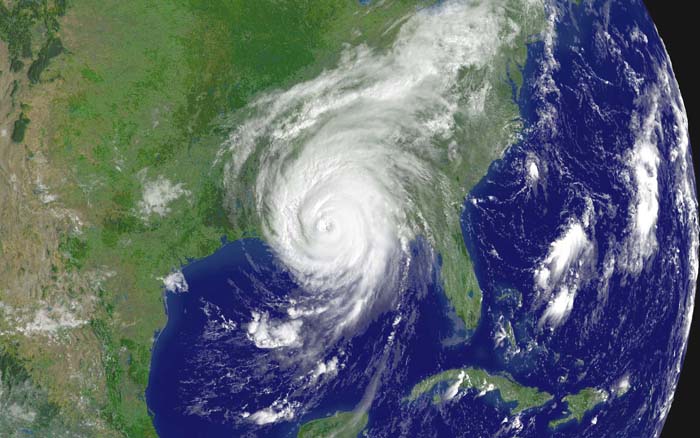
Hurricane Katrina making
landfall on Aug. 29, 2005. (source)
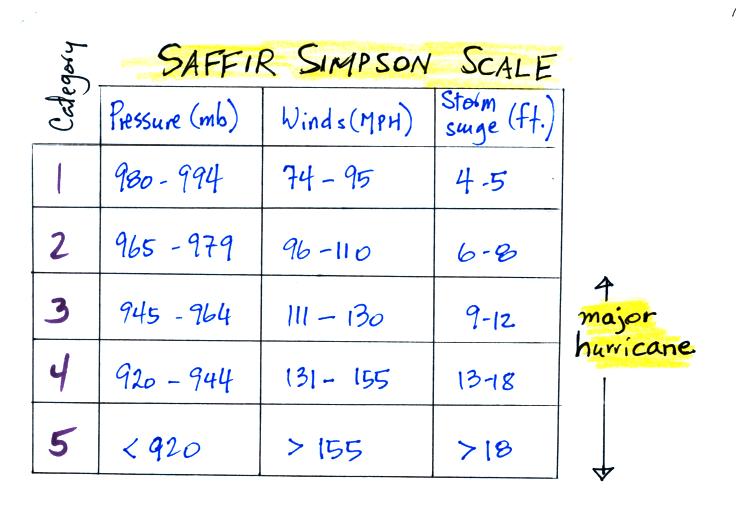
The Saffir Simpson Scale is used to rate
hurricane intensity (just as the Fujita Scale is used for
tornadoes). The scale runs from 1 to 5. Remember that
a hurricane must have winds of 74 MPH or above to be considered a
hurricane. Category 3,4, and 5 hurricanes are considered
"major hurricanes" (in other parts of the world the term super
typhoon is used for category 4 or 5 typhoons).
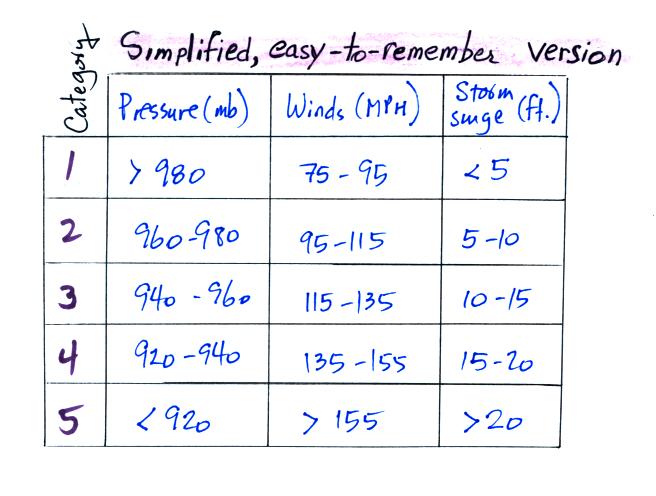
Here's an easy-to-remember
version of the scale
Pressure decreases by 20 mb, wind speeds increase by 20 MPH,
and the storm surge increases by 5 feet with every change in level
on the scale.
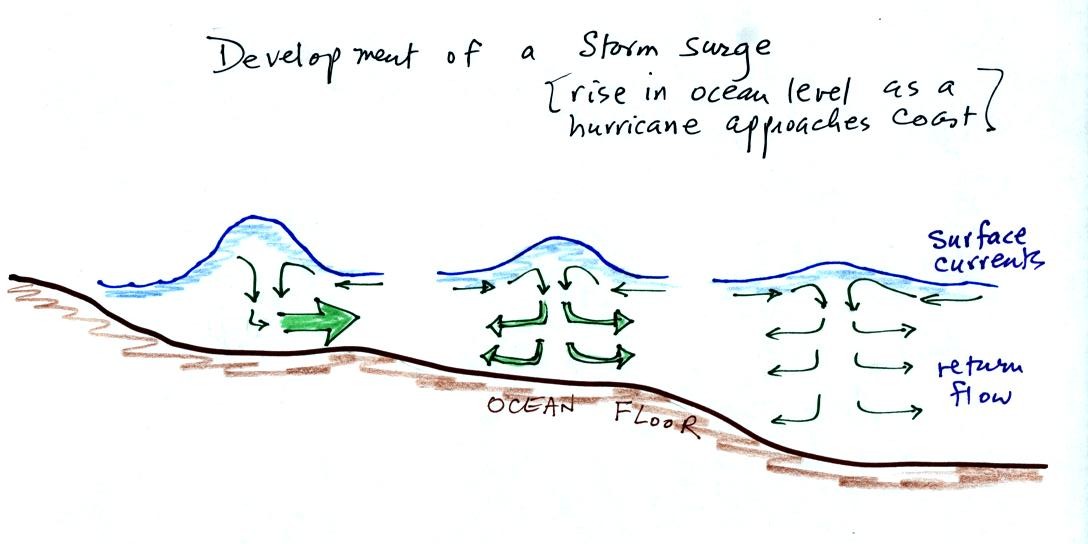
Storm surge
The storm surge listed above is a rise in ocean level when a
hurricane makes landfall. This causes the most damage and
the greatest number of fatalities near a coast.
The converging surface winds associated with a hurricane sweep
surface water in toward the center of a hurricane and cause it to
pile up. The water sinks and, in deeper water, returns to
where it came from. This gets harder and harder to do as the
hurricane approaches shore and the ocean gets
shallower. So the piled up water gets deeper and
the return flow current gets stronger.
The National Weather Service has developed the SLOSH computer
model that tries to predict the height and extant of a hurricane
storm surge (SLOSH stands for Sea, Lake, and Overland Surges from Hurricanes). You can see some
animations of SLOSH predictions run for hurricanes of historical
interest (including the Galveston 1900) hurricane at a National
Hurricane Center website (http://www.nhc.noaa.gov/surge)