Thursday Aug. 27, 2015
Three songs from Sergio Mendoza
y La Orkesta recorded in summer 2014 at the SXSW festival in
Austin, Texas.
Signup sheets for the experiments were circulated in
class. If you didn't get a chance to signup don't worry,
I'll bring the lists to class again next week. Remember
you only need to do one of the experiments (or the Scientific
Paper or Book report options). You can check on the appropriate list to see if
your name is there (it will take a few days to enter all the
names). I plan to bring materials for Experiment #1 to class
next Tuesday.
The first of this semester's 1S1P Assignments is now
online. 1S1P stands for "1 Side of 1 Page reports",
these account for half of your writing grade in this
class.
There are four topics available for your consideration on this
assignment. The assignment is broken into 3 parts with
Sep. 8, Sep. 15, and Sep. 17 due dates (you can always turn
work in early). You can do reports on as many of the
topics as you'd like. Something I forgot to mention, you
should turn in a printed copy of your report in class, don't
submit your report on D2L.
Your goal should be to earn
45 1S1P points by the last day of classes. How you get
there is up to you:
(i) You could write four reports as part of this
assignment and try to get the work done early in the
semester.
(ii) You might spread out the effort over the
full semester in which case you could write just one or two
reports as part of this 1st assignment.
(iii) You can procrastinate by not writing any
reports now and turning in a flood of reports late in the
semester. I would encourage you to write at least one
report this time around, if only to get some feedback about
how the grading is done.
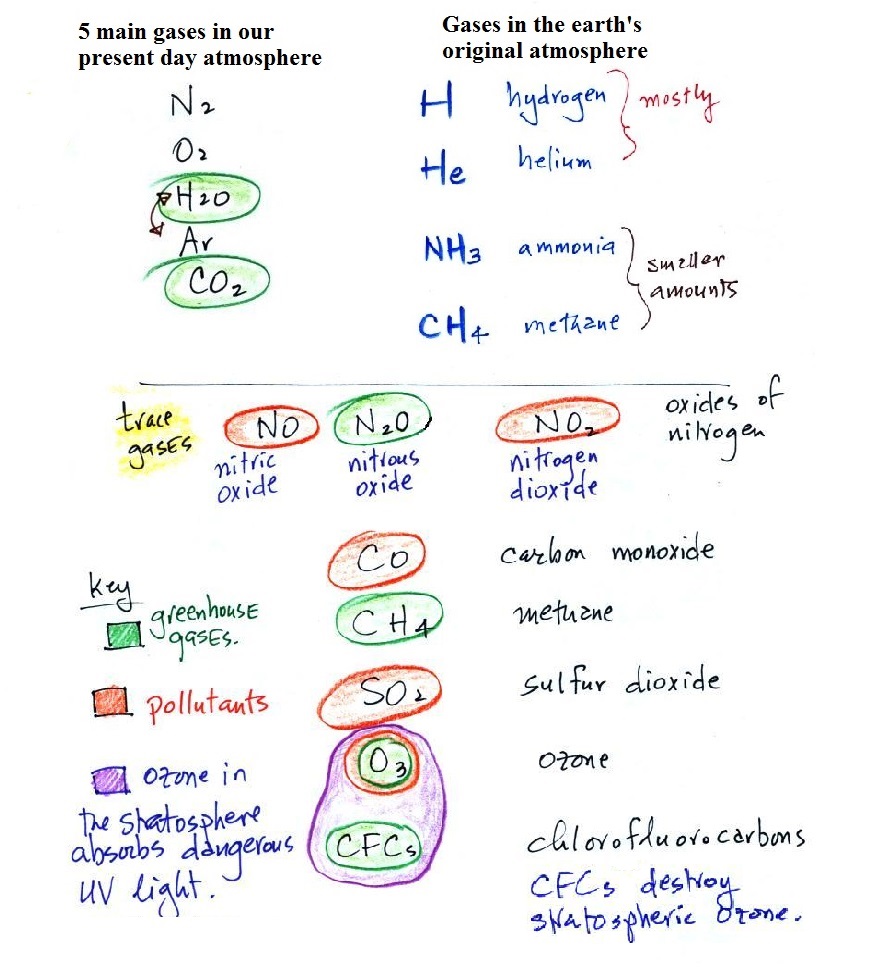
Trace gases in air -
pollutants and greenhouse gases
We add to the list of the 5 main gases in our present day
atmosphere in the figure below.
The earth is about 4.5 billion years ago. The earth's
original atmosphere is very different from today's
atmosphere. Ordinarily we would spend about 2/3rds of a
class looking at what happened to our original atmosphere and at
the origin and evolution of our present day atmosphere
(particularly the buildup of oxygen). We're not going to do
that this semester because I want to cover a topic or two (such as
the El Nino phenomenon) that we don't normally have time
for. Rather than covering the origin and evolution of our
atmosphere in class, I've made it one of the 1S1P Assignment #1
topics.
Water vapor, carbon
dioxide, methane, nitrous oxide
(N2O = laughing gas), chlorofluorocarbons, and ozone are all greenhouse gases. The
greenhouse effect warms the earth and increasing atmospheric
concentrations of these gases are responsible for the current
concern over climate change and global warming. We'll
discuss this topic and learn more about how the greenhouse
effect actually works later in the course. (Carbon
dioxide is the subject of one of the other 1S1P Assignment #1
topics).
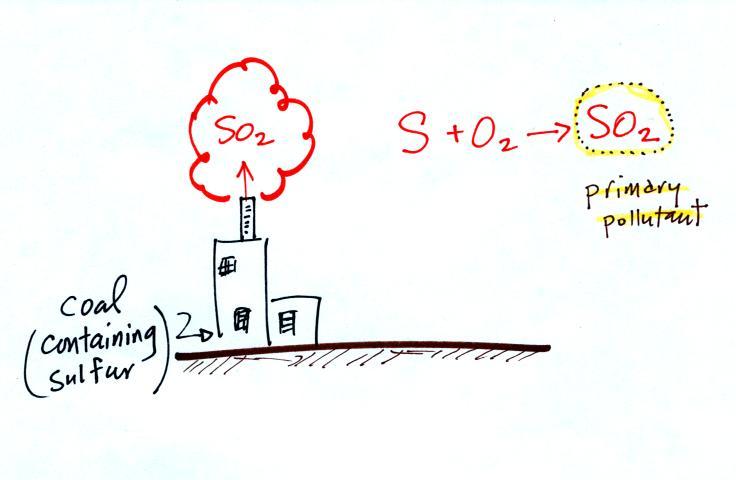
Carbon monoxide, nitric oxide, nitrogen
dioxide, ozone, and sulfur
dioxide are some of the major air pollutants.
We'll cover 3 of these in more detail later this week and next
week.
Ozone has sort of a Dr. Jeckyl and Mr. Hyde personality
(i) Ozone in the stratosphere (a
layer of the atmosphere between about 10 and 50 km altitude) is
beneficial because it absorbs dangerous (deadly) high energy
ultraviolet (UV) light coming from the sun. Without the
protection of this ozone layer, life as we know it would not
exist on the surface of the earth. It was only after ozone
started to buildup in the atmosphere that life could move from
the oceans onto land. Chlorofluorocarbons are of concern
in the atmosphere because they destroy stratospheric ozone.
(ii) Ozone in the troposphere (the
bottom 10 kilometers or so of the atmosphere and where we live)
ozone is a pollutant and is one of the main ingredients in
photochemical smog.
(iii) Ozone is also
a greenhouse gas.
Gases like water vapor,
oxygen, and nitrogen are invisible
(see 1S1P Assignment
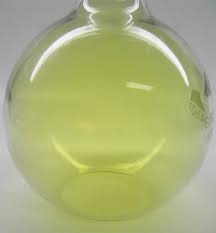
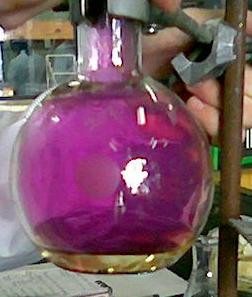
#1c). Some gases are colored and can be seen;
some examples are shown below. I would like to bring
some actual samples to class, but these gases are toxic
and require careful handling.
 |
|
 |
|
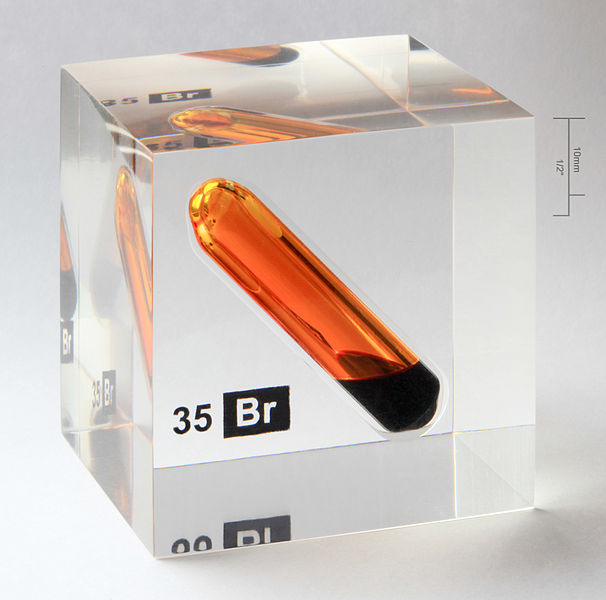
Bromine in both
liquid and gaseous phases. Bromine and mercury are the
only two elements that exist as liquids at room
temperature. The bromine is in a sealed glass
ampoule inside an acrylic cube. Bromine could be
safely brought to class in a container like this.
Webelements.com states: " It is a serious health
hazard, and maximum safety precautions should be taken
when handling it." I'm not sure what maximum
safety precautions are, that's why I don't bring it to
class.
This photo was taken by Alchemist-hp and was
Picture of the Day on the English Wikipedia on Oct. 29,
2010.
|
Chlorine (Cl2)
I found this image here
|
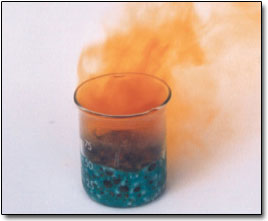
Iodine
Also an element that is normally found in solid
form. The solid sublimates, i.e. it changes
directly from solid to gas (you would probably need to
heat the solid iodine to produce gas as dense as seen
in the picture above). source
of this image
I think we can probably handle iodine safely and might
well bring some to class.
|
Nitrogen dioxide (NO2)
An important pollutant. I used to make
this in class but I've read that you can inhale a
fatal dose of NO2
before showing any symptoms. NO2
also has an anesthetic effect - it can deadens
your sense of smell.
source
of this image
|
Air Pollutants
Today and next week we will be looking at four air
pollutants. They are carbon monoxide, tropospheric ozone,
sulfur dioxide (all three are gases), and particulate
matter. They're listed below together with an idea of the
number of main points you should remember and understand about
each.
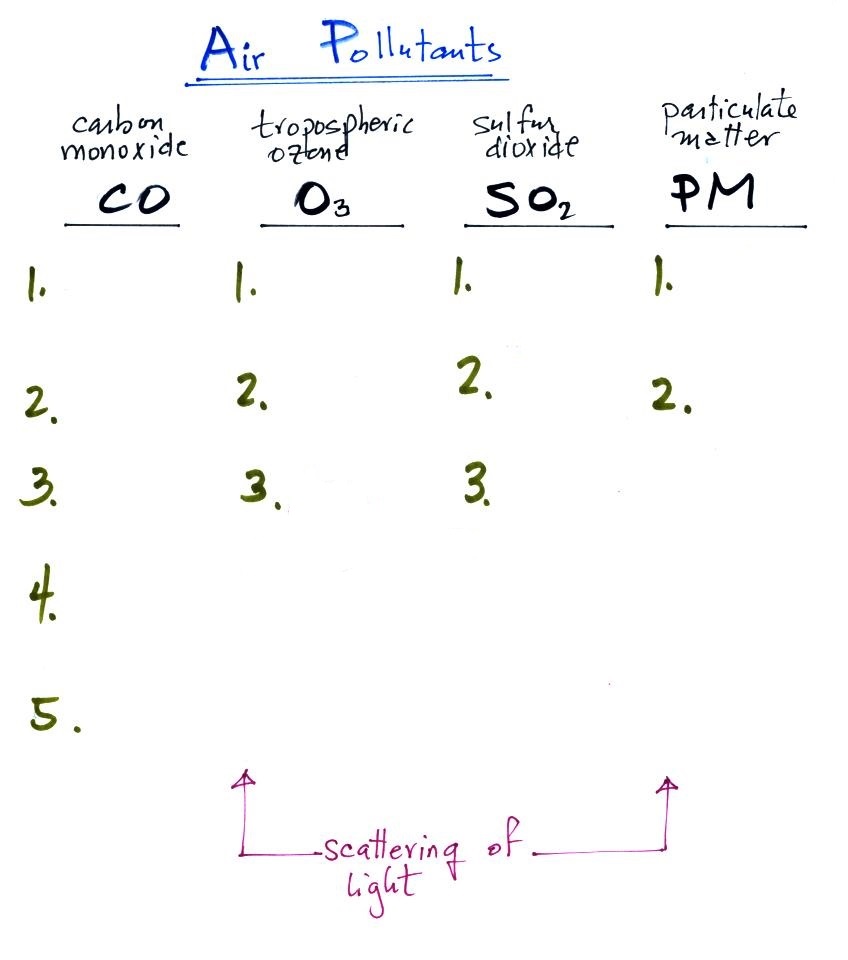
Today's class will also feature a light
scattering demonstration. It's a fairly simple concept
and explains how/why we are able to see things like smog,
clouds, and particulate matter in the air. We will also
produce some photochemical smog in a second separate
demonstration (safely confined in a glass bottle).
You'll be able to see it because of scattering of light.
Air Pollution is a serious health hazard in
the US and around the globe (click here to
download a copy of the information below).
The lists below give some idea of how serious a threat
it is.
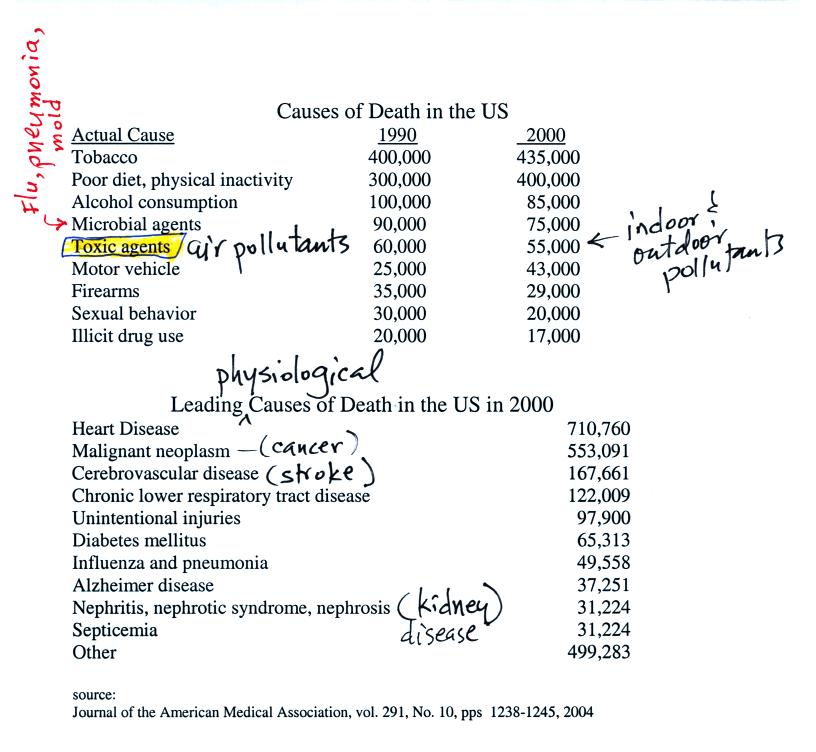
The top list shows the external or
environmental agent that causes death. The second list
is the physiological or internal bodily function that
ultimately leads to your demise. Keep in mind that
many of these numbers are difficult to measure and some may
contain a great deal of uncertainty (they are also somewhat
out of date). The row that is highlighted, toxic
agents, contains estimates of deaths caused by indoor and
outdoor air pollution, water pollution, and exposure to
materials such as asbestos and lead both in the home and at
the work place. It is estimated that 60% of the deaths
are due to exposure to particulate matter, something that we
will examine in a little more detail next week.
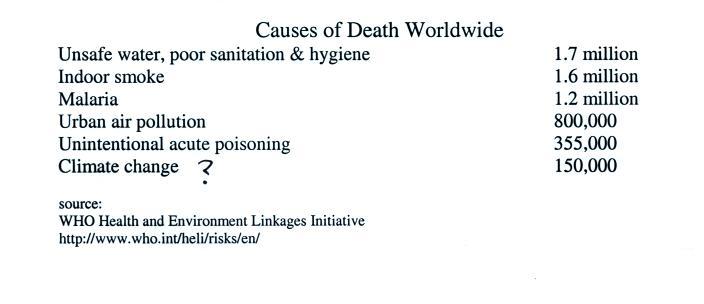
Air pollution is a serious hazard
worldwide. Interestingly indoor air pollution is, in
many places, a more serious threat than outdoor air
pollution. In that regard, here's
a link to an article titled "Open-Fire Stoves Kill
Millions. How Do We Fix It?" (it appeared in the Dec.
2012 issue of Smithsonian Magazine).
.
I'm not sure how the researchers determine that 150,000
people are killed by climate change every year.
The Blacksmith
Institute listed the Top 10 polluted places in the
world in a 2007 report. The report has received a lot of
worldwide attention. If you go to this address (click
on 2007 at the top edge of the page) you can view the report
online or download and print a copy of the report. This
is just in case you are interested (click on some of the other
years also if you do go to the site). And note they are
concerned with all types of pollution, not just air pollution.
this summer I heard mention of a recent study (ref)
that estimates air pollution kills about 4000 people per
day in China. Here's an
August 18 article from the Washington Post that
discusses the study. Much of this is
particulate pollution which is something we'll cover next
week. In addition to being a health hazard, particulates
can have a dramatic effect on visibility.
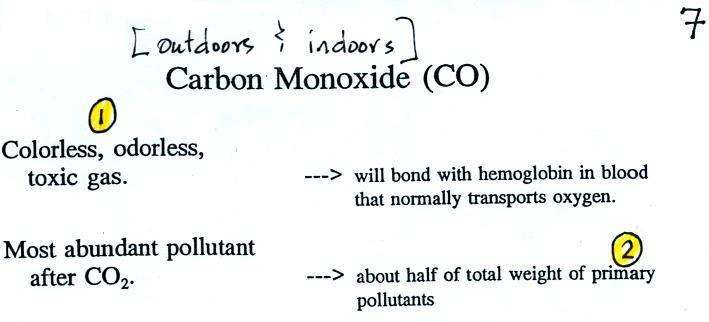
Carbon Monoxide (CO)
We'll start our section on air
pollutants with carbon monoxide. You'll find
additional information on carbon monoxide and other
air pollutants at the Pima
County Department of Environmental Quality
website and also at the US
Environmental Protection Agency website.
The material above is from page 7 in the photocopied
ClassNotes. We will mostly be talking about carbon
monoxide found outdoors, where it would only rarely reach
fatal concentrations. CO is a serious hazard indoors
also where it can (and does) build up to deadly concentrations
(several
people
were
almost
killed
in
Tucson
in
December 2010 for example).
Between
1999 and 2010 an average of 430 people were killed per
year from unintentional, non-fire-related carbon monoxide
poisoning according to the Centers for Disease Control and
Prevention (ref).
Carbon monoxide is insidious, you can't smell it or see it
and it can kill you (Point 1).
Once
inhaled,
carbon
monoxide
molecules
bond
strongly
to
the
hemoglobin
molecules
in
blood
and
interfere
with
the
transport
of
oxygen
throughout
your
body.
The
article above about carbon monoxide poisoning mentions that
the victims were put inside a hyperbaric (high pressure)
chamber filled with pure oxygen. This must force oxygen
into the blood and displace the carbon monoxide.
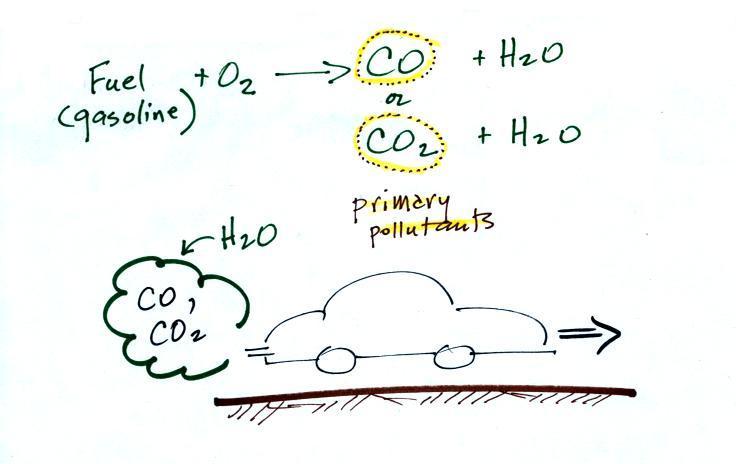
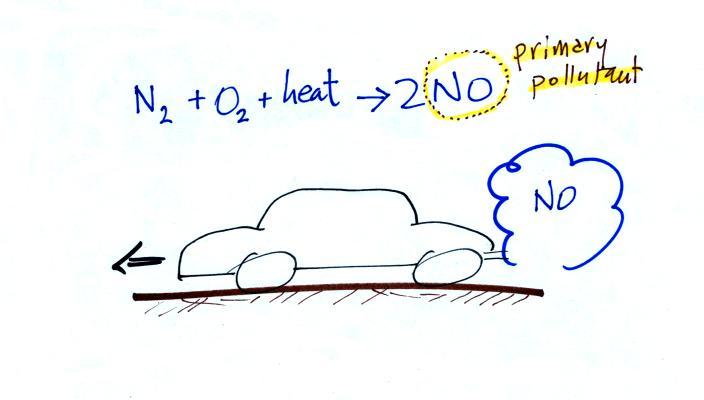
CO is a primary pollutant (Point
2 above). That means it goes directly from a
source into the air, CO is emitted directly
from an automobile tailpipe into the atmosphere for example.
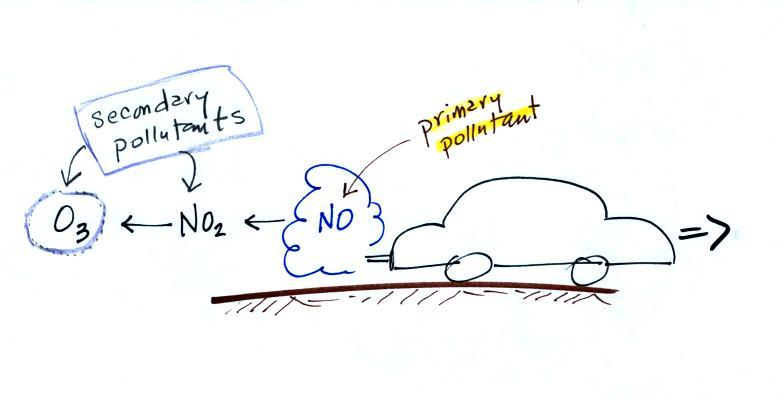
The difference between primary and secondary
pollutants is probably explained best in a series of
pictures.
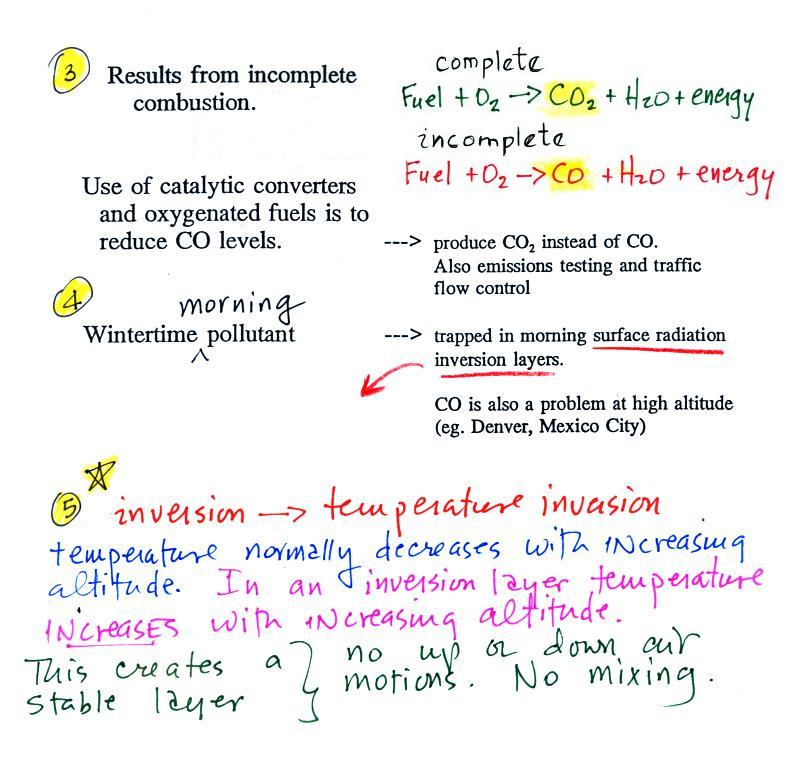
Point 3 explains that CO is produced by incomplete
combustion of fossil fuel. It's as if there isn't enough
oxygen. More oxygen and complete combustion would produce
carbon dioxide, CO2.
Cars and trucks produce much of the CO in the atmosphere in
Tucson.
Special formulations of gasoline (oxygenated fuels) are used
during the winter months in Tucson to try to reduce CO
emissions. The added ethanol has the effect of adding more
oxygen to the combustion process.
Vehicles must also be fitted with a catalytic converter
that will change CO into CO2
(and also NO into N2 and O2 and hydrocarbons into H2O and CO2).
In Pima County, vehicles must also pass an emissions test every
year to insure that the car is burning fuel as cleanly as
possible.
In the atmosphere CO concentrations peak on winter mornings (Point 4). The reason for
this is surface radiation inversion layers. They are most
likely to form on cold winter mornings.
When we say inversion layer (Point 5), we mean a temperature inversion, a
situation where air temperature increases with increasing
altitude. That's just the opposite of what we are used to
(you would expect it to be colder at the summit of Mt. Lemmon than
here in the Tucson valley). This produces stable atmospheric
conditions which means there is little up or down air motion.
The lack of vertical air motions means there is very
little vertical mixing in a stable air layer.
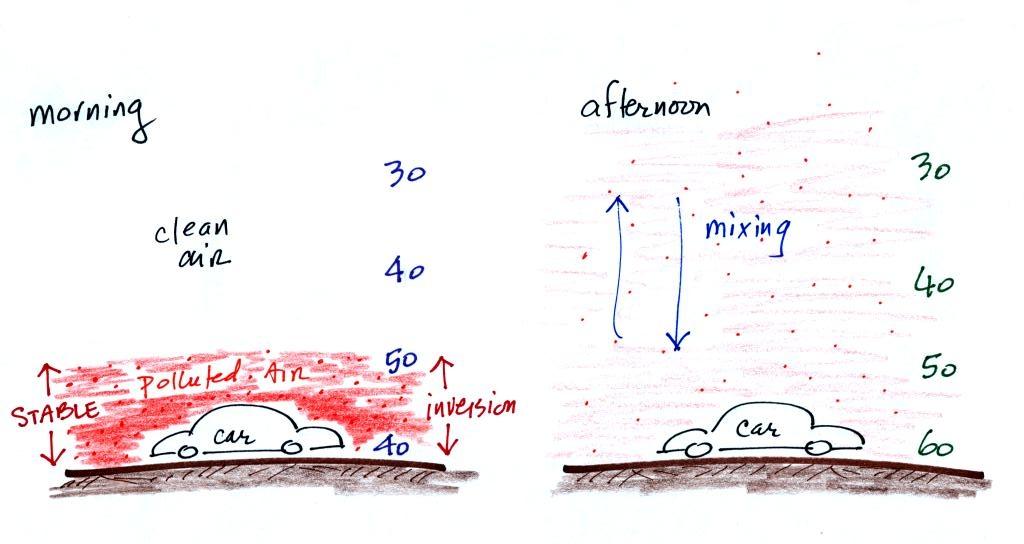
In the left figure above, notice how temperature increases
from 40 F to 50 F in the thin air layer next to the ground.
That's the inversion layer. Temperature then begins to
decrease as you move further up. When CO is emitted into the
thin stable layer during the morning rush hour, the CO remains in
the layer and doesn't mix with cleaner air above. CO
concentrations build. Later in the day the
ground and air in contact with the ground warms. The
inversion disappears and air at the ground mixes with cleaner air
above. The evening rush hour adds CO to the air but it is
mixed in a larger volume of air and the concentration doesn't get
as high.
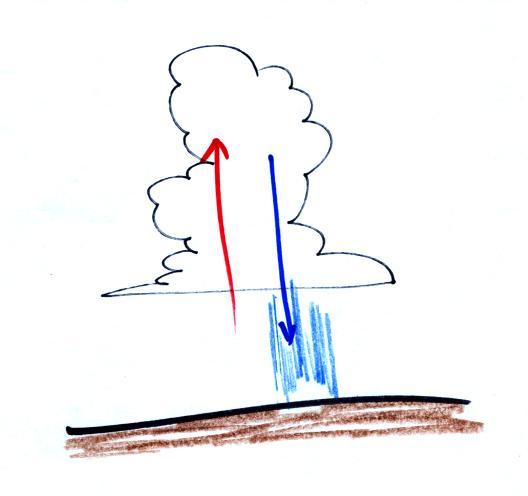
Thunderstorms like you have been seeing this time of year
contain strong up and down air motions. Thunderstorms are an
indication of unstable atmospheric conditions.
Scattering (splattering) of light
We spent the next portion of today's class learning about the
scattering of light. You are able to see a lot of
things in the atmosphere (clouds, fog, haze, even the blue sky)
because of scattering of light. We'll try to make a cloud of
smog in class next week. The individual droplets making up
the smog cloud are too small to be seen by the naked eye.
But you will be able to see that they're there because the
droplets scatter light. That's true also of the little water
droplets that make up a cloud. So we need to take some time
for a demonstration to see exactly what light scattering is.
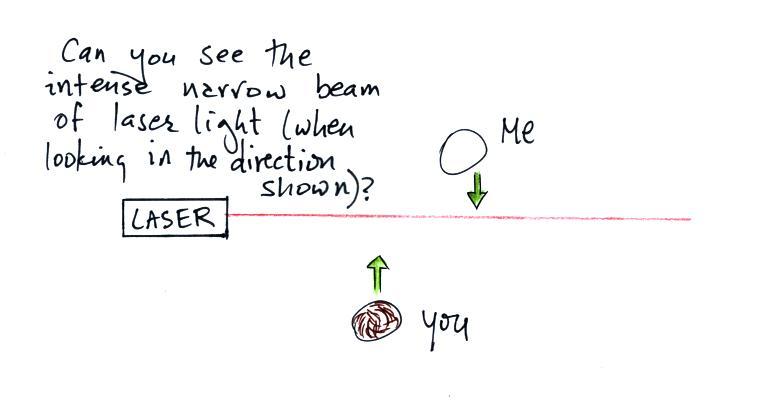
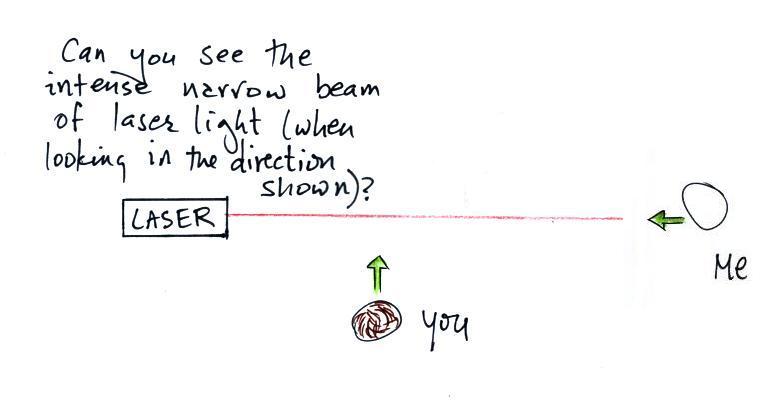
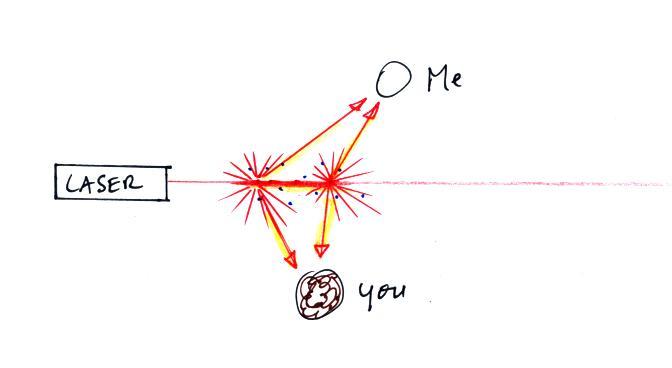
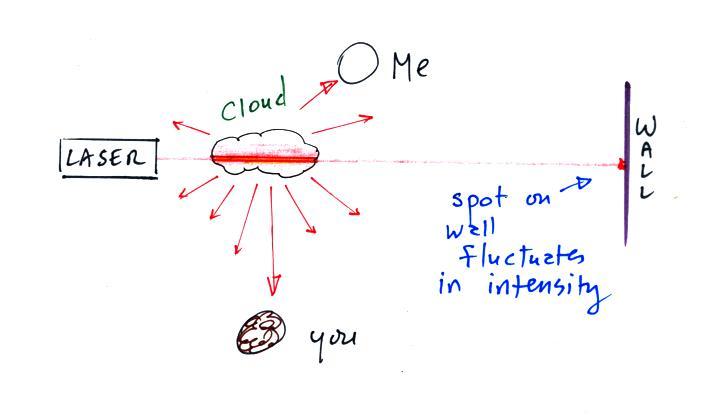
In the first part of the demonstration a narrow beam of intense
red laser light was directed from one side of the classroom to the
other.
We're looking down from
above in the the figure above. Neither the
students or the instructor could see the beam of light.
To see the laser light some of it would need to be traveling
toward you rather than from one side of the room to the other.
This figure and the ones that follow are on pps 107a &
107b on the packet of ClassNotes.
The instructor would have been able to see the beam if he had
stood at the end of the beam of laser light where it hit the wall
and looked back along the beam of light toward the laser.
That wouldn't have been a smart thing to do, though, because the
beam was strong enough to possibly damage his eyes (there's
a warning on the side of the laser).
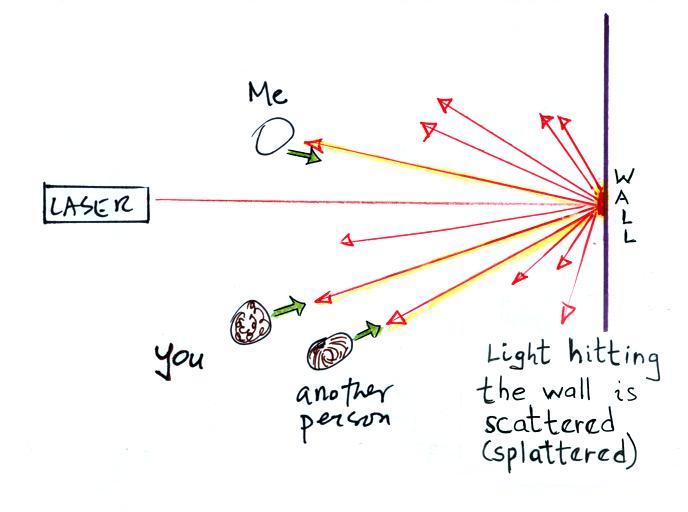
Everybody was able to see a bright red spot where the laser
beam struck the wall.
This is because when the intense beam
of laser light hits the wall it is scattered (I think
splattered is a more descriptive term). The
original beam is broken up into a multitude of weaker
rays of light that are sent out in all directions.
There is a ray of light sent in the direction of every
student in the class. They see the light because
they are looking back in the direction the ray came
from. It is safe to look at this light
because the original intense beam is split up into many
much weaker beams.
Next we clapped some erasers together so that some
small particles of chalk dust fell into the laser
beam. I also sprinkled baby powder into the beam.
Now instead of a single spot on the wall, students saws lots of
points of light coming from different positions along a straight
segment of the laser beam. Each of these points of light was
a particle of chalk, and each piece of chalk dust was intercepting
laser light and sending light out in all directions. Each
student saw a ray of light coming from each of the chalk
particles. With a cloud of chalk dust you are able to see
segments of the laser beam.
We use chalk because it is white, it will scatter rather than
absorb visible light. What would you have seen if black
particles of soot had been dropped into the laser beam?
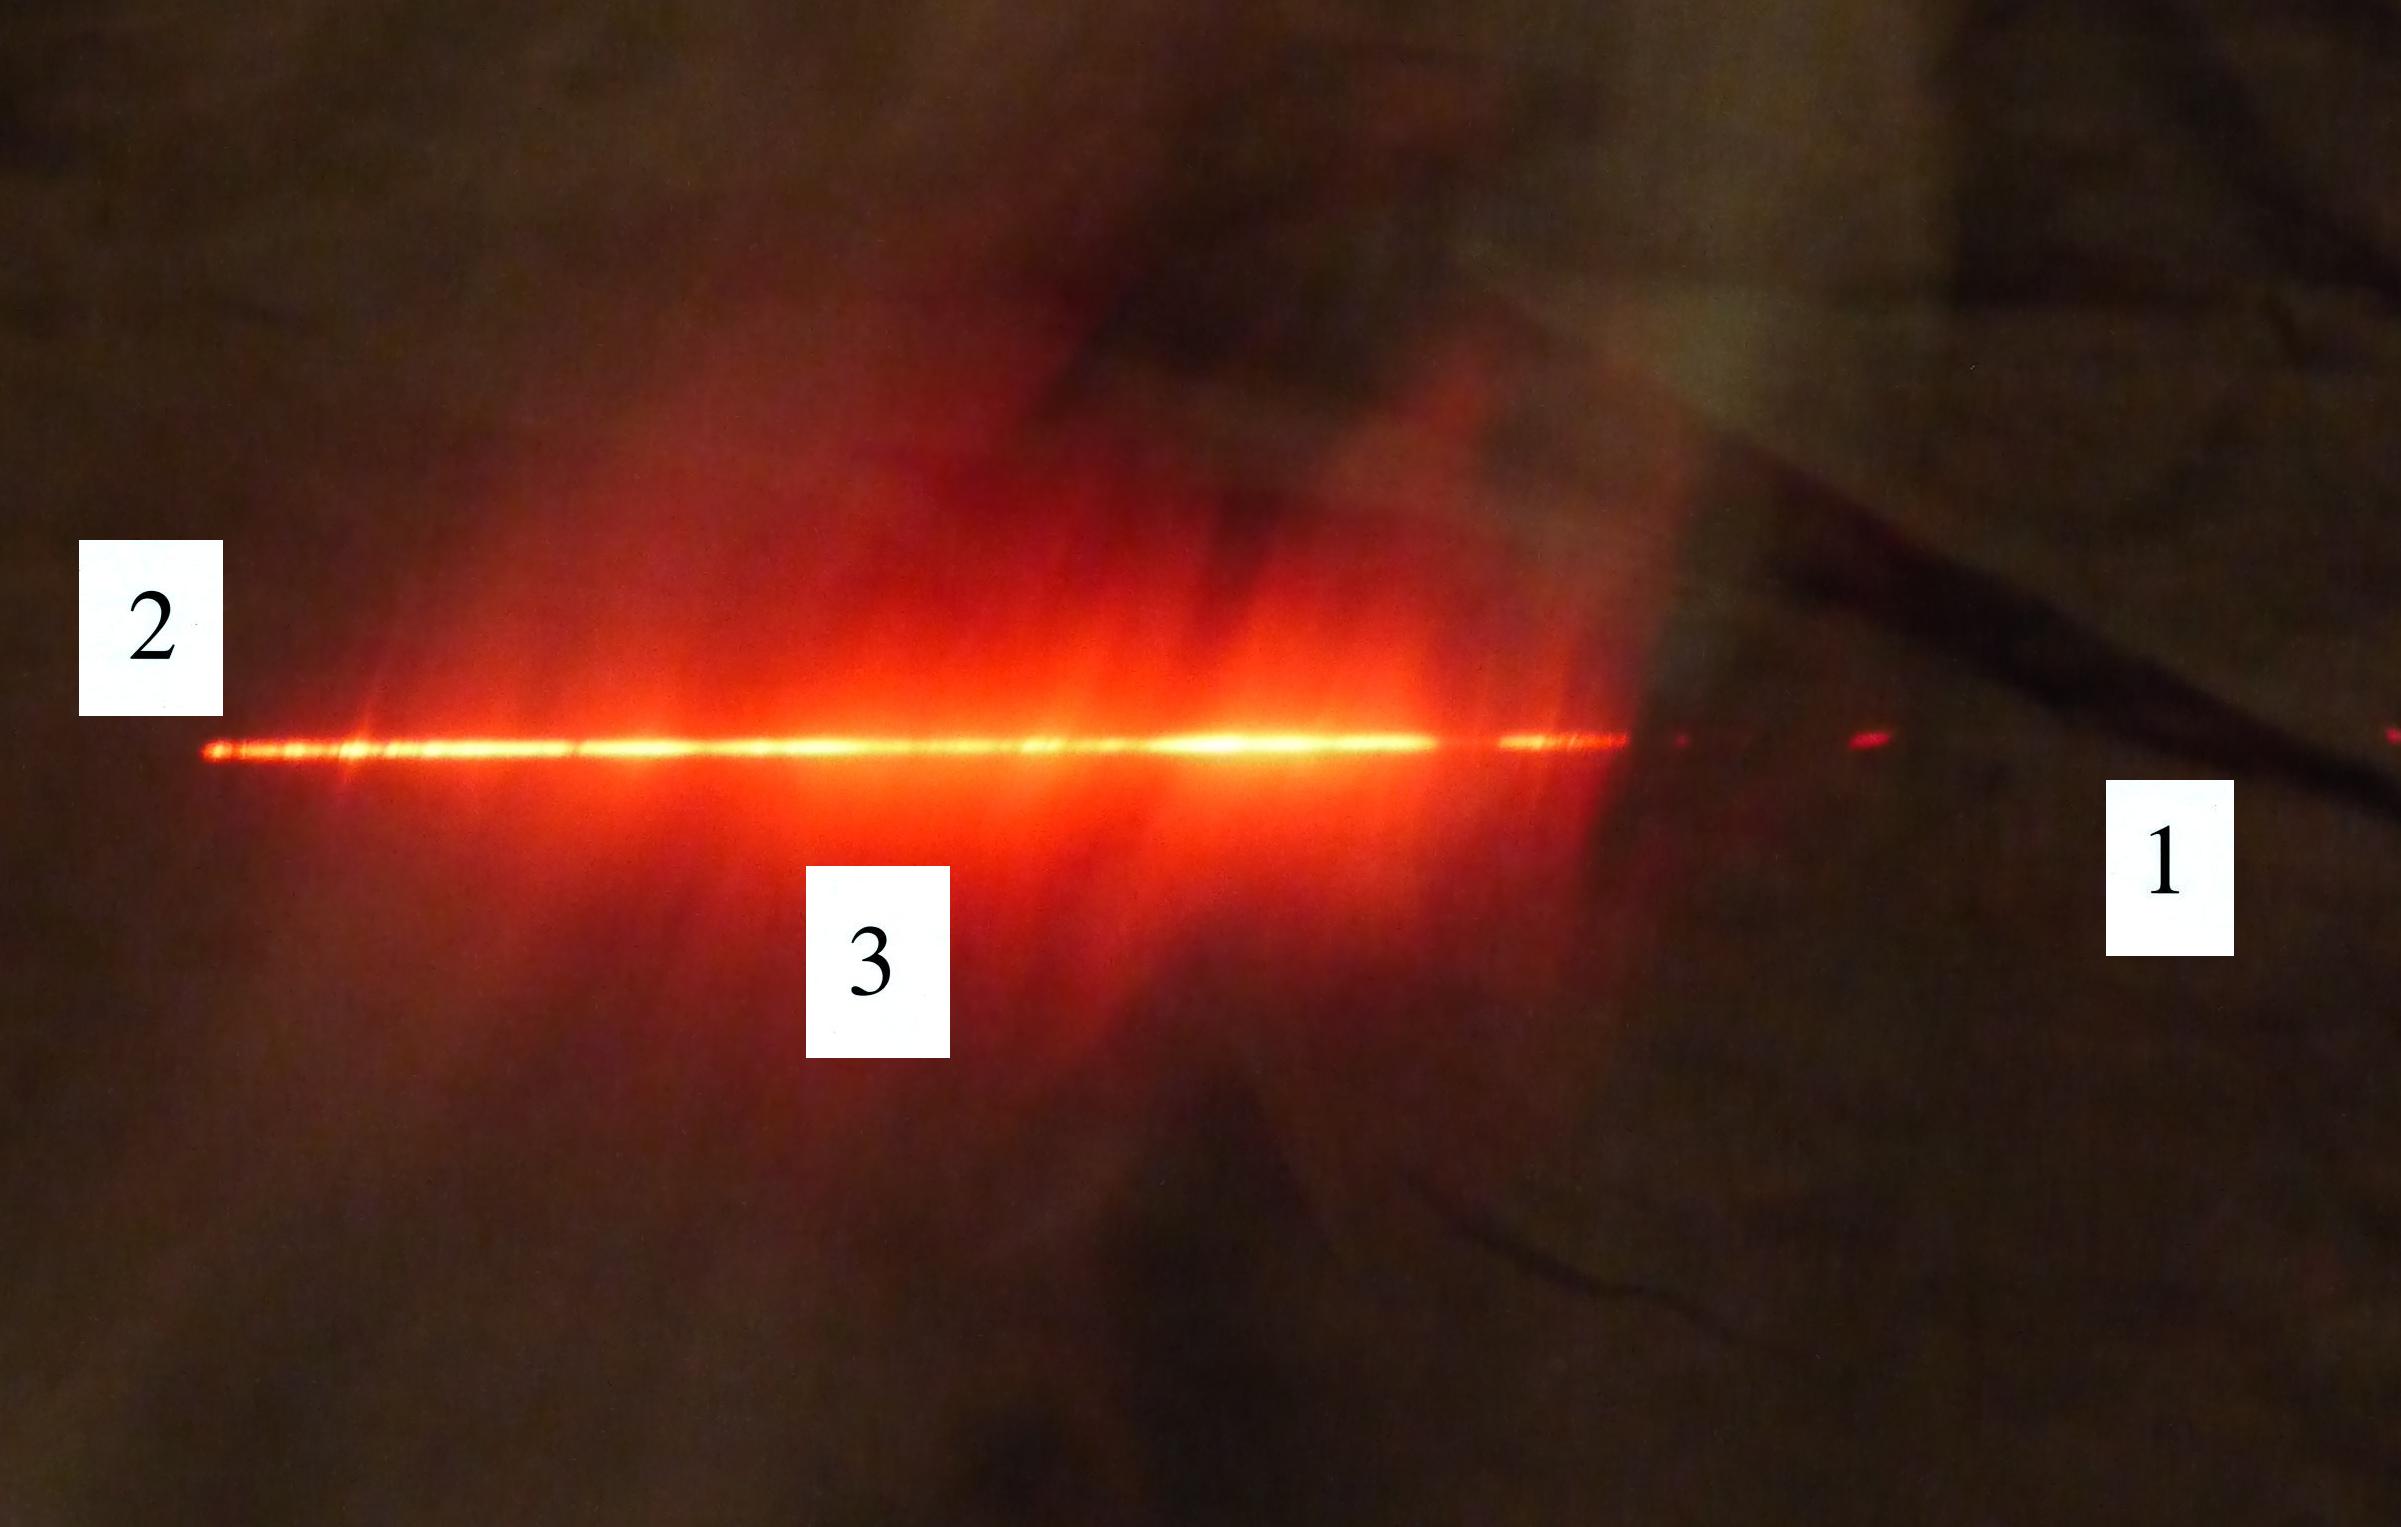
In the last part of the demonstration we made a cloud by pouring
some liquid nitrogen into a cup of water. The cloud droplets
are much smaller than the chalk particles but are much more
numerous. They make very good scatterers.
The laser beam is visible in the left 2/3 rds of the picture
because it is passing through cloud and light is being scattered
toward the camera. There wasn't any cloud on the right
1/3rd of the picture so you can't see the laser beam over near
Point 1.
The air molecules in the room are actually scattering laser
light but it's much too weak for us to be able to see it.
When a stronger light source (sunlight) shines through much more
air (the entire atmosphere) we are able to see the scattered
light. The blue light that you see when you look at sky is
sunlight being scattered by air molecules. The last topic
in 1S1P assignment #1 is about the scattering of sunlight, it's
a topic that I hope everyone will do.
Air quality index
I didn't do a
particularly good job explaining this topic so you might
want to read through these online notes even if you were in
class.
A large metropolitan area like Tucson and Pima County is
required to continuously measure concentrations of several air
pollutants. You can read more about air
quality monitoring done by the Pima County Department of
Environmental Quality here.
A photograph of one of the monitoring sites (click here
to see a map of all 18 monitoring sites) is shown below.
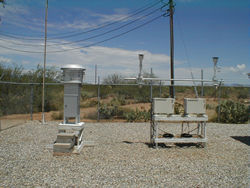
monitoring site at Corona de Tucson (
source)
The main pollutants being monitored are
shown below (see p. 8 in the ClassNotes).
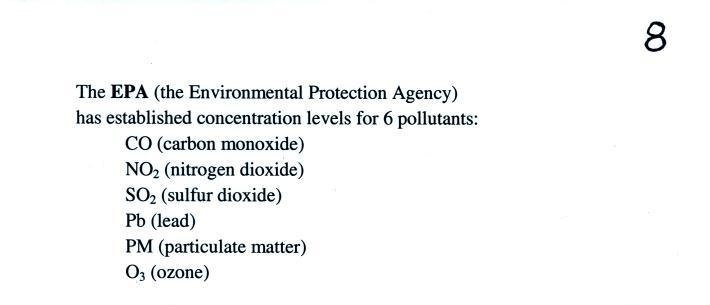
The concentration of
lead in the air has decreased significantly since lead
was removed from gasoline (the following quote is from a
Wikipedia article on gasoline: "In the US,
standards to phase out leaded gasoline were first
implemented in 1973 ..... In 1995, leaded fuel accounted
for only 0.6% of total gasoline sales ...... From 1
January 1996, the Clean Air Act banned the
sale of leaded fuel for use in on-road vehicles.
Possession and use of leaded gasoline in a regular
on-road vehicle now carries a maximum $10,000 fine in
the US.")
In Tucson, carbon monoxide,
ozone, and particulate matter are of primary concern and
daily measurements are reported in the city newspaper.
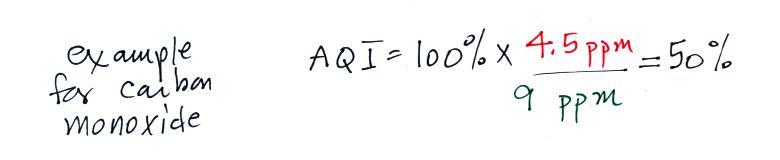
If I
were to tell you that the measured carbon monoxide
concentration yesterday was 4.5 ppm (averaged over an 8 hour
time period) would you be able to tell me whether that was
high or low, hazardous or not? Most people wouldn't be
able to answer that question. Many people wouldn't
know that ppm stands for "parts per million". Those
are units of concentration (4.5 CO molecules mixed in with 1
million air molecules).
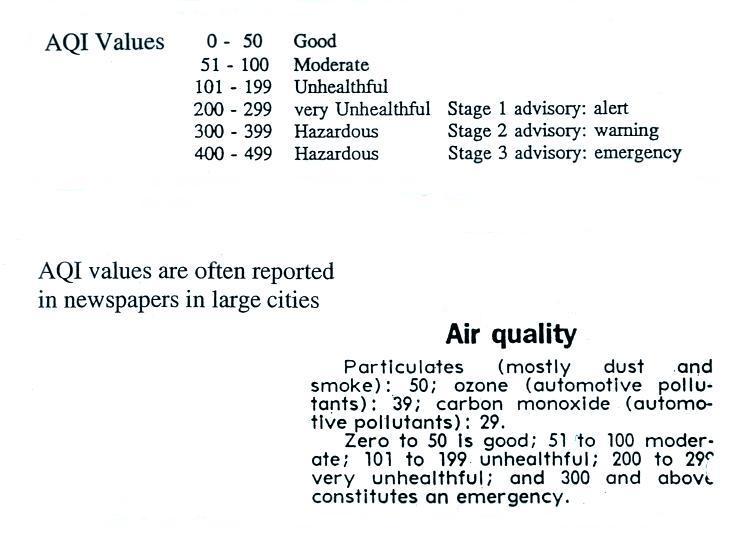
Rather than reporting the actual measured values, an Air
Quality Index value is reported instead.
The AQI is the ratio of the measured to accepted
concentrations multiplied by 100%.
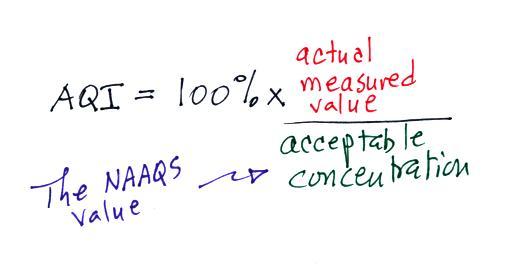
The acceptable levels are known
as the National Ambient Air Quality Standards (NAAQS).
The numbers are different depending on the particular
pollutant.
The NAAQS values for carbon monoxide are:
9 ppm (average value over an 8 hour
period)
35 ppm (average over a 1 hour period)
So we can compute the AQI for a measured CO concentration of 4.5
ppm.
The air quality in this case would be
acceptable. Air becomes unhealthy when the AQI value
exceeds 100%. It's somewhat like computing your
percentage grade on a quiz. You divide the points earned
by the total number of points possible and multiply by
100%. 100% on a quiz is good, an air quality index value
of 100% is bad.
Current Air Quality Index
values for Tucson are probably not in the newspaper
anymore, they're available online.
Symptoms of carbon monoxide poisoning
This last section was mentioned but
not really covered in class.
Carbon monoxide is a
serious hazard indoors where it can build to much
higher levels than would ever be found outdoors.
This next link is to a newspaper article describing an
incident at Virginia Tech (that occurred near the
beginning of the school year in 2007). Carbon
monoxide
from
a malfunctioning hot water heater sickened 23
Virginia Tech students in an apartment
complex. The CO concentration is thought to have
reached 500 ppm. You
can get an idea of what kinds of symptoms and effects that
concentrations this high could cause from the figure in the
middle of p. 9 in the photocopied ClassNotes.
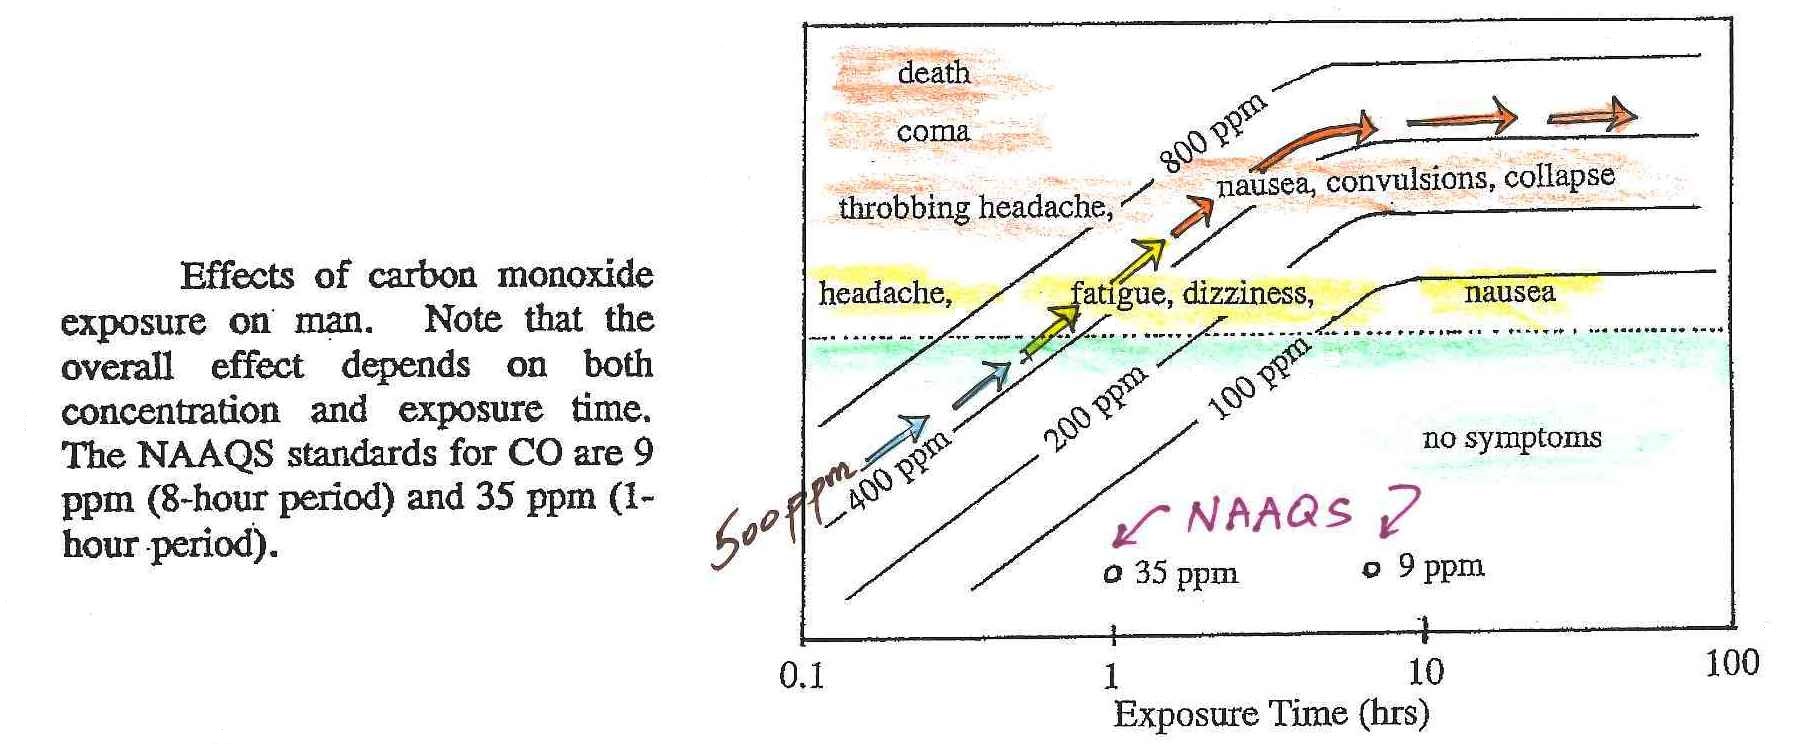
The effects of CO depend on what concentration you exposed to
and the duration of the exposure. In this case we'll
follow the arrows from lower left to the upper right of the
figure. The arrows represent a concentration of about 500
ppm. Beginning at lower left we see that we wouldn't
experience any symptoms with an exposure to even 500 ppm for
just a few minutes. Note also the NAAQS values near the
bottom of the graph. Beginning at about 1 hour exposure
the arrows cross from the lower green half to the upper
yellow and orange half of the graph. Beginning at 1 hour
you would experience headache, fatigue, dizziness, nausea.
The symptoms would worsen if the exposure lasted for a few
hours: throbbing headache, nausea, convulsions, and
collapse. The 500 ppm line comes very close to coma and
death part of the graph. At Virginia
Tech several students were found unconscious and a few had
difficulty breathing on their own but were resuscitated; they
very nearly died.
Carbon monoxide alarms are relatively inexpensive
(~$50) and are available at most hardware stores. I've got
one in my house to protect me and my cats. They will
monitor CO concentrations indoors and warn you when
concentrations reach hazardous levels.
Indoors CO is produced by gas furnaces and water heaters that
are either operating improperly or aren't being properly vented
to the outdoors. A few hundred people are killed indoors
by carbon monoxide every year in the United States. An
operating carbon monoxide alarm probably saved the lives of the
6 Tucson residents in December 2010. You can learn
more about carbon monoxide hazards and risk prevention at the Consumer
Product Safety Commission web page.