One thing about the global warming debate that we know for sure is that concentrations of several greenhouse gases in the atmosphere are increasing due to the activities of man. The gases thought to be the largest contributors to global warming are listed in the tables below. As mentioned previously, the production and use of ozone-depleting CFCs has been greatly reduced in recent years, and the concentrations of these chemicals in the atmosphere have started to decline. However, the the ozone-friendly chemical substitutes, HFCs, PFCs, and SF6 are also greenhouse gases. Another greenhouse gas, ozone, has recently gotten some attention as a potential contributor to global warming. The concern is over increasing concentrations of ozone in the troposphere related to photochemical smog. In the table below, greenhouse gas concentrations are given in either ppm (parts per million), ppb (parts per billion), or ppt (parts per trillion), where, for example, one ppm means one molecule of greenhouse gas per one million gas molecules in the atmosphere.
Six of these greenhouse gases, carbon dioxide, methane, nitrous oxide, HFCs, PFCs, and sulphur hexafluoride, have been targeted for reduction by the Kyoto Protocol of 1997. Countries that signed the Protocol have agreed to reduce their emissions of these gases to 5% below 1990 levels by the year 2010. A few of the countries, which signed the Protocol, seem to be on track to meet this goal, while others have actually continued to increase their emissions of some of these target gases. Note that the United States did not sign or agree to the emission reductions set by the Kyoto Protocol.
While most agree that these modest reductions agreed to in the Kyoto Protocol will have only a very slight impact on the rate of global warming, some say it is an important first step in getting the global community to recognize the issue and work together on possible solutions. The Kyoto agreement runs out in 2012. In December (2009) a world climate conference in Copenhagen was held. This time the conference ended without countries agreeing to legally-bonding reductions in greenhouse gas emissions.
|
Greenhouse Gas |
Concentration 1750 | Present Concentration | Percent Change |
Natural and Anthropogenic Sources (in bold) |
|---|---|---|---|---|
| Carbon Dioxide (CO2) | 280 ppm | 390.5 ppm | 39.5 % | Organic decay; Forest fires; Volcanoes; Burning fossil fuels; Deforestation; Land-use change |
| Methane (CH4) | 0.70 ppm | 1.88 ppm | 169 % | Wetlands; Organic decay; Termites; Natural gas & oil extraction; Biomass burning; Rice cultivation; Cattle; Refuse landfills |
| Nitrous Oxide (N2O) | 270 ppb | 322 ppb | 19 % | Forests; Grasslands; Oceans; Soils; Soil cultivation; Artificial Fertilizers; Biomass burning; Burning of fossil fuels |
| Chlorofluorocarbons (CFCs) | 0 | 850 ppt | Not Applicable | Refrigerators; Aerosol spray propellants; Cleaning solvents |
| Hydrofluorocarbons (HFCs) | 0 | ~53 ppt | Not Applicable | Ozone-friendly CFC substitute |
| Perfluorocarbons (PFCs) | <1 ppt | ~70 ppt | 7000 % | Very minute quantities exist naturally; Ozone-friendly CFC substitute; Aluminum smelting; semiconductor industry |
| Sulfer hexafluoride (SF6) | 0 | ~7 ppt | Not Applicable | Ozone-friendly CFC substitute; electronics, various industrial applications |
| Tropospheric Ozone (O3) | 25 ppb | 34 ppb | 40 % | Created artificially through photochemical smog production |
The increasing concentrations of carbon dioxide and methane from 1750 to 1998 are shown graphically below. Most, if not all, of the increases are due to human activities. Perhaps most alarming is that not only are the concentrations of these greenhouse gases increasing, but the rate of increase is also increasing. For example, lets take a look at how the rate of increase of carbon dioxide has increased over each 25 year period of the last century. Also note that there has been an additional 6.2% increase in carbon dioxide over the 10 year period from 2001-2010. (Note that this is not the case for methane as its growth rate had slowed during the 1990s and actually leveled out from 1998-2006; however, its concentration has increased again after 2006).
|
Year |
CO2 concentration (ppm) |
% increase in 25 years |
1900 | 297 | --- |
|---|---|---|
| 1925 | 306 | 2.9% |
| 1950 | 318 | 3.9% |
| 1975 | 336 | 5.7% |
| 2000 | 366 | 8.9% |
 |
 |
| Carbon dioxide concentration (ppm) 1750-1998 | Methane concentration (ppb) 1750-1998 |
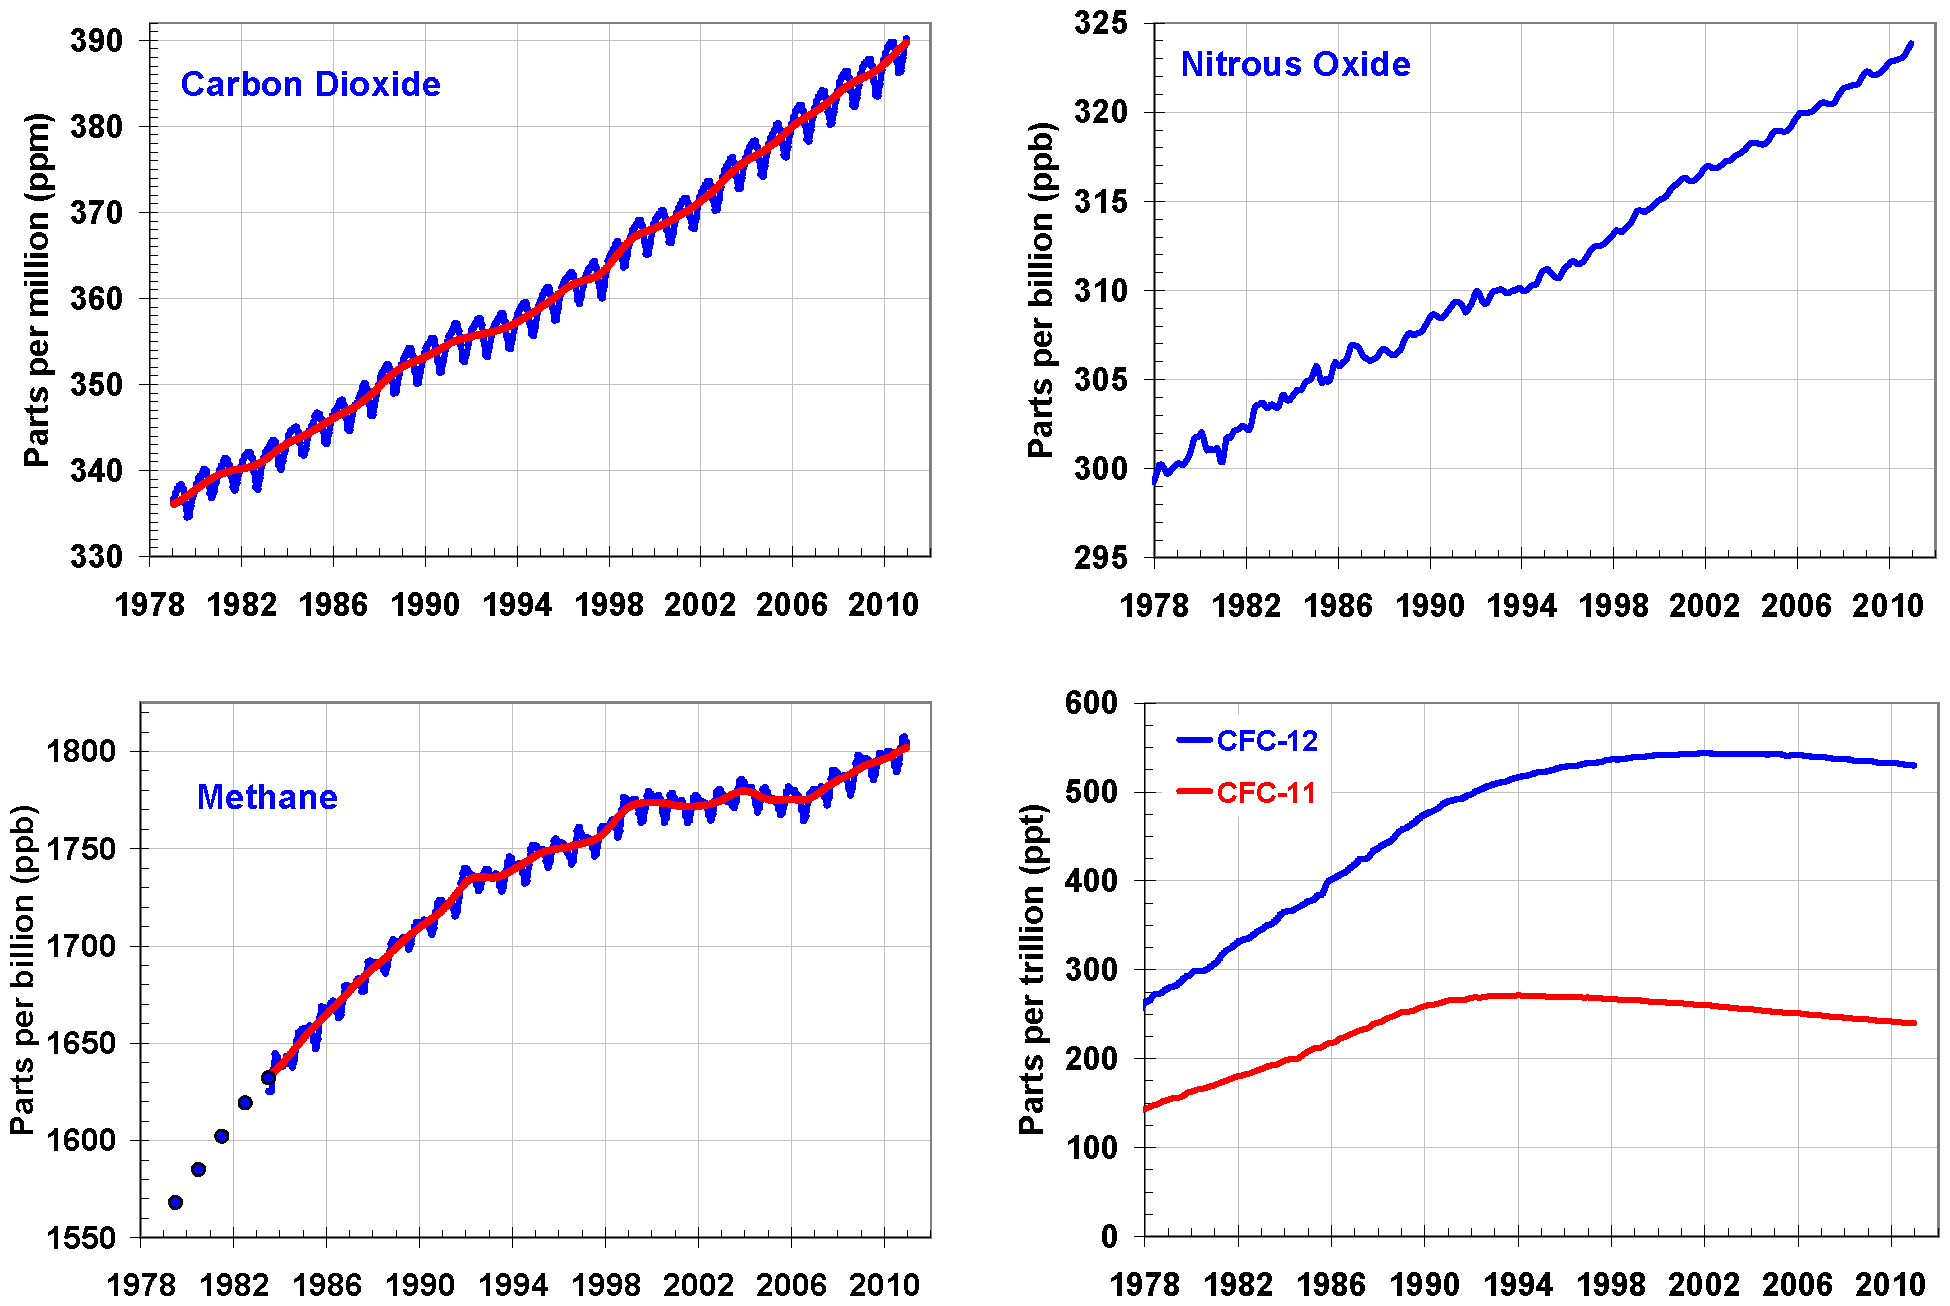
More up-to-date measurements of greenhouse gas concentrations since 1978 are shown below:
On a per molecule basis, not all greenhouse gases are equal in their enhancement to the greenhouse effect. The table below defines something called the global warming potential (GWP). The GWP estimates the relative enhancement to the atmospheric greenhouse effect on a per molecule basis. For example, one molecule of nitrous oxide is about 310 times more effective than carbon dioxide in its enhancement to the greenhouse effect on Earth. Some CFCs and their substitutes are up to 10,000 times more effective.
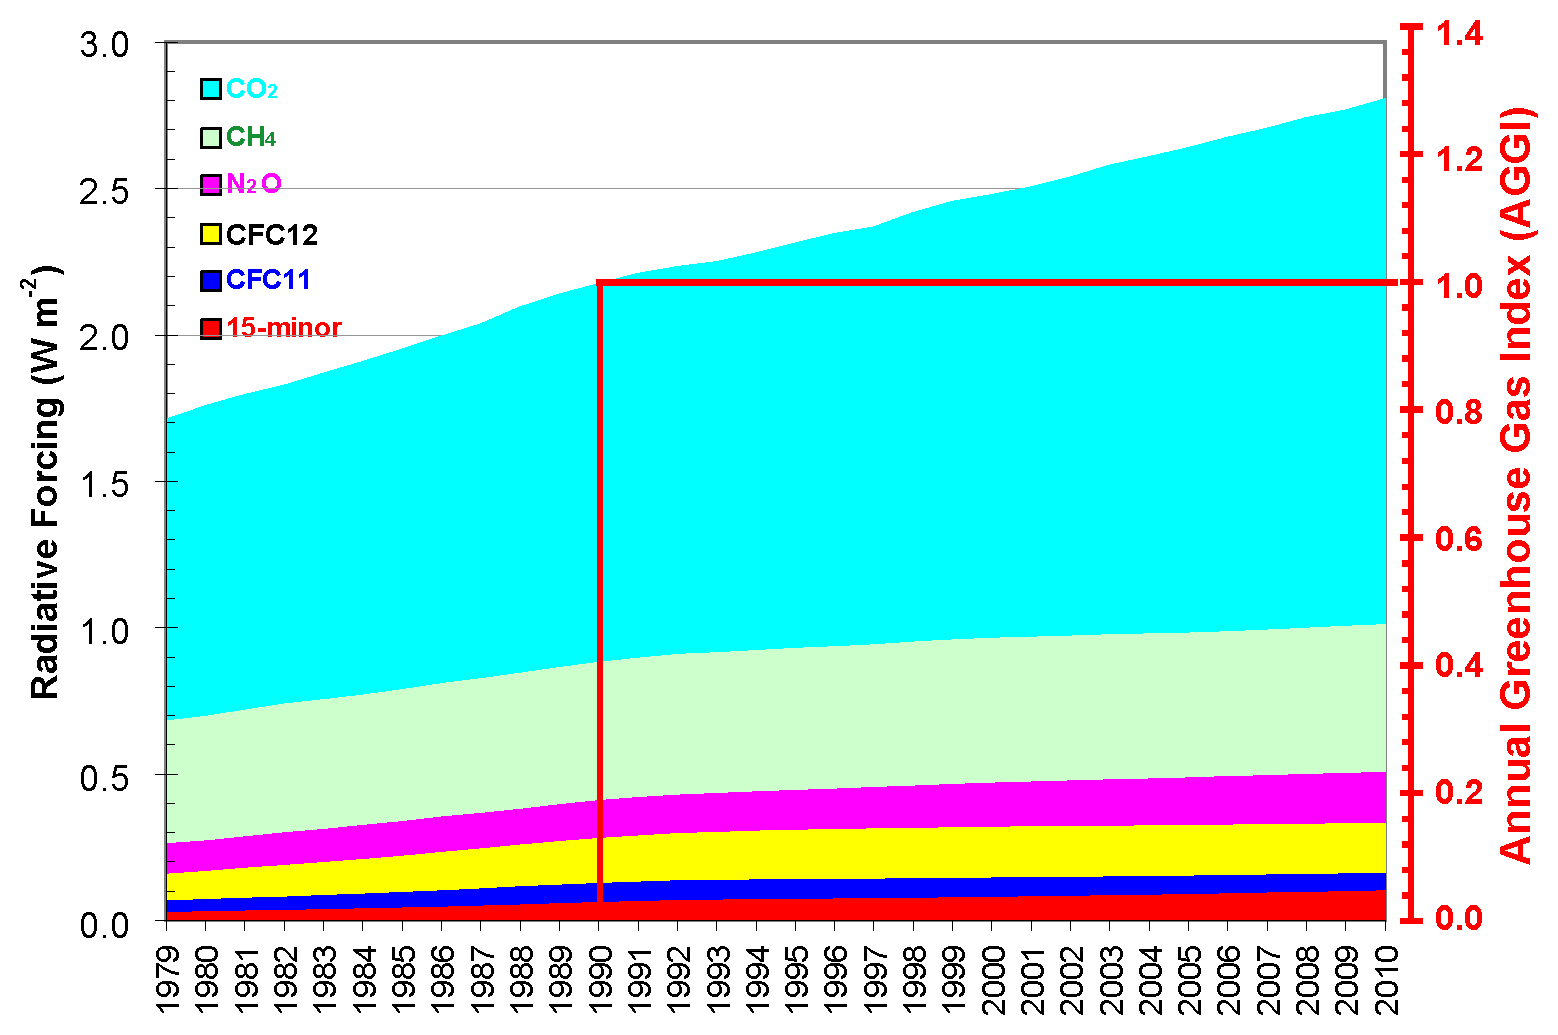
Be careful not to be mislead by the table. The total enhancement to the greenhouse effect depends on the per molecule global warming potential times the number of molecules added to the atmosphere. Overall, carbon dioxide is still the largest contributor to global warming (enhanced greenhouse effect) because there is so much more of it. Presently, it is believed that the enhancement caused by carbon dioxide is still greater than the enhancements caused by all other human added greenhouse gases combined. Researchers have computed a number called "radiative forcing" that is meant to account for the influence that human-added greenhouse gases have had in altering the incoming and outgoing radiation energy for the planet Earth. Please see this figure showing radiative forcing for many human-added greenhouse gases. For more information and a comparison of the climate forcing due to greenhouse gas increases and other anthropogenic and natural causes see section on radiative forcing and figures SPM-1 and SPM-2 located on pages 2-4 of the IPCC Climate Change 2007 (Summary for Policymakers)
|
Gas |
GWP |
|---|---|
| Carbon dioxide (CO2) | 1 |
| Methane (CH4) | 21 |
| Nitrous oxide (N2O) | 310 |
| Hydrofluorocarbons | 560-12,100 |
| Perfluorocarbons | 6,000-9,200 |
| Sulfur hexafluoride | 23,900 |
Note: Typical GWP uncertainties are about ±35 percent.
Detailed inventories of greenhouse gases are available from the EPA Global Warming web page.
There is no arguing that the concentrations of several greenhouse gases are increasing due to the activities of man. We can measure the increases. This increase in greenhouse gases is a perturbation or forcing to the climate system. Based on our discussion of the energy budget for the Earth, adding greenhouse gases should act to warm the surface of the Earth by enhancing the natural greenhouse effect. However, the way in which the climate system will ultimately respond to this perturbation of adding greenhouse gases is uncertain because the climate system is so complex. We simply do not understand all of the complex interactions and feedbacks that operate in the climate system. One source of uncertainty that we will discuss next is called the "Missing CO2 Sink". Even though we know how much CO2 is being released into the atmosphere, we do not know where it all goes. How can we expect to accurately predict future climate changes when we don't even know what happens to all of the CO2 that we add to the atmosphere? This is just one of many sources of uncertainty related to predictions of future climate changes.