![]()
![]()
![]()
![]()
The wind at 500 mb can be determined from the height pattern. The wind blows parallel to the height contours with lower heights to the left of the wind direction. During the winter months across the United States, this means that the 500 mb winds across generally blow from west toward east, but follow the wavy pattern of the height contours. This is because the air temperature generally gets colder as one move toward the north and 500 mb heights generally get lower. This general west to east air motion at the 500 mb height level weakens in the summer as the temperature differences between the tropics and the Arctic becomes weaker. Keep in mind that this is the wind several thousand meters above the Earth's surface and not the wind that would be felt on the ground.
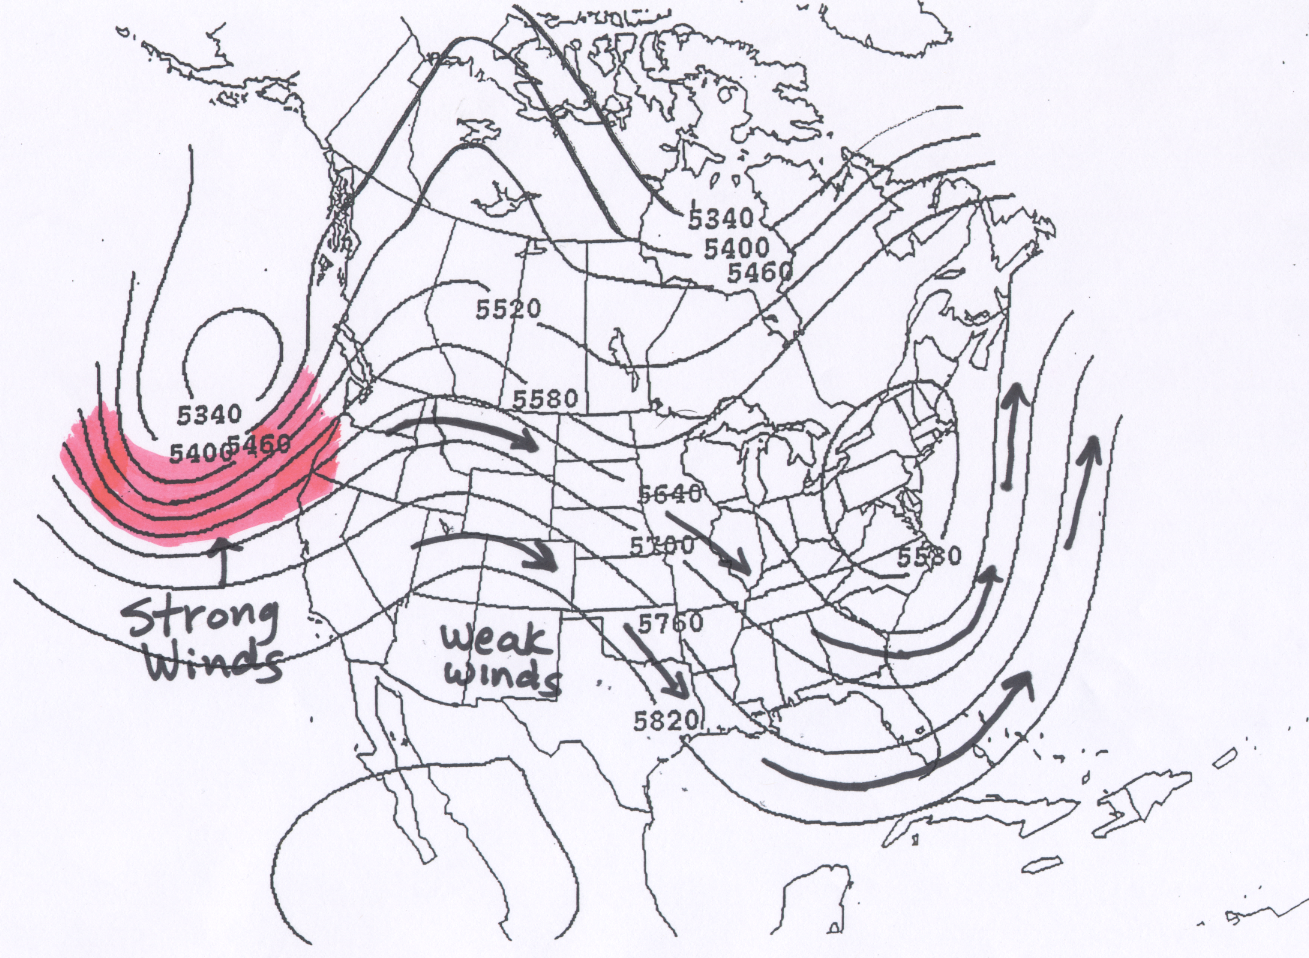
The wind speed is faster where the height lines are closer together, and slower where the height contours are spaced further apart. If this helps, you can think of the 500 mb height lines as channels through which the air moves. The wind follows the wavy pattern of the lines, and gets squeezed together where the lines get closer together, resulting in faster winds. This is just how water would flow in a hypothetical channel. A couple of examples are include below.
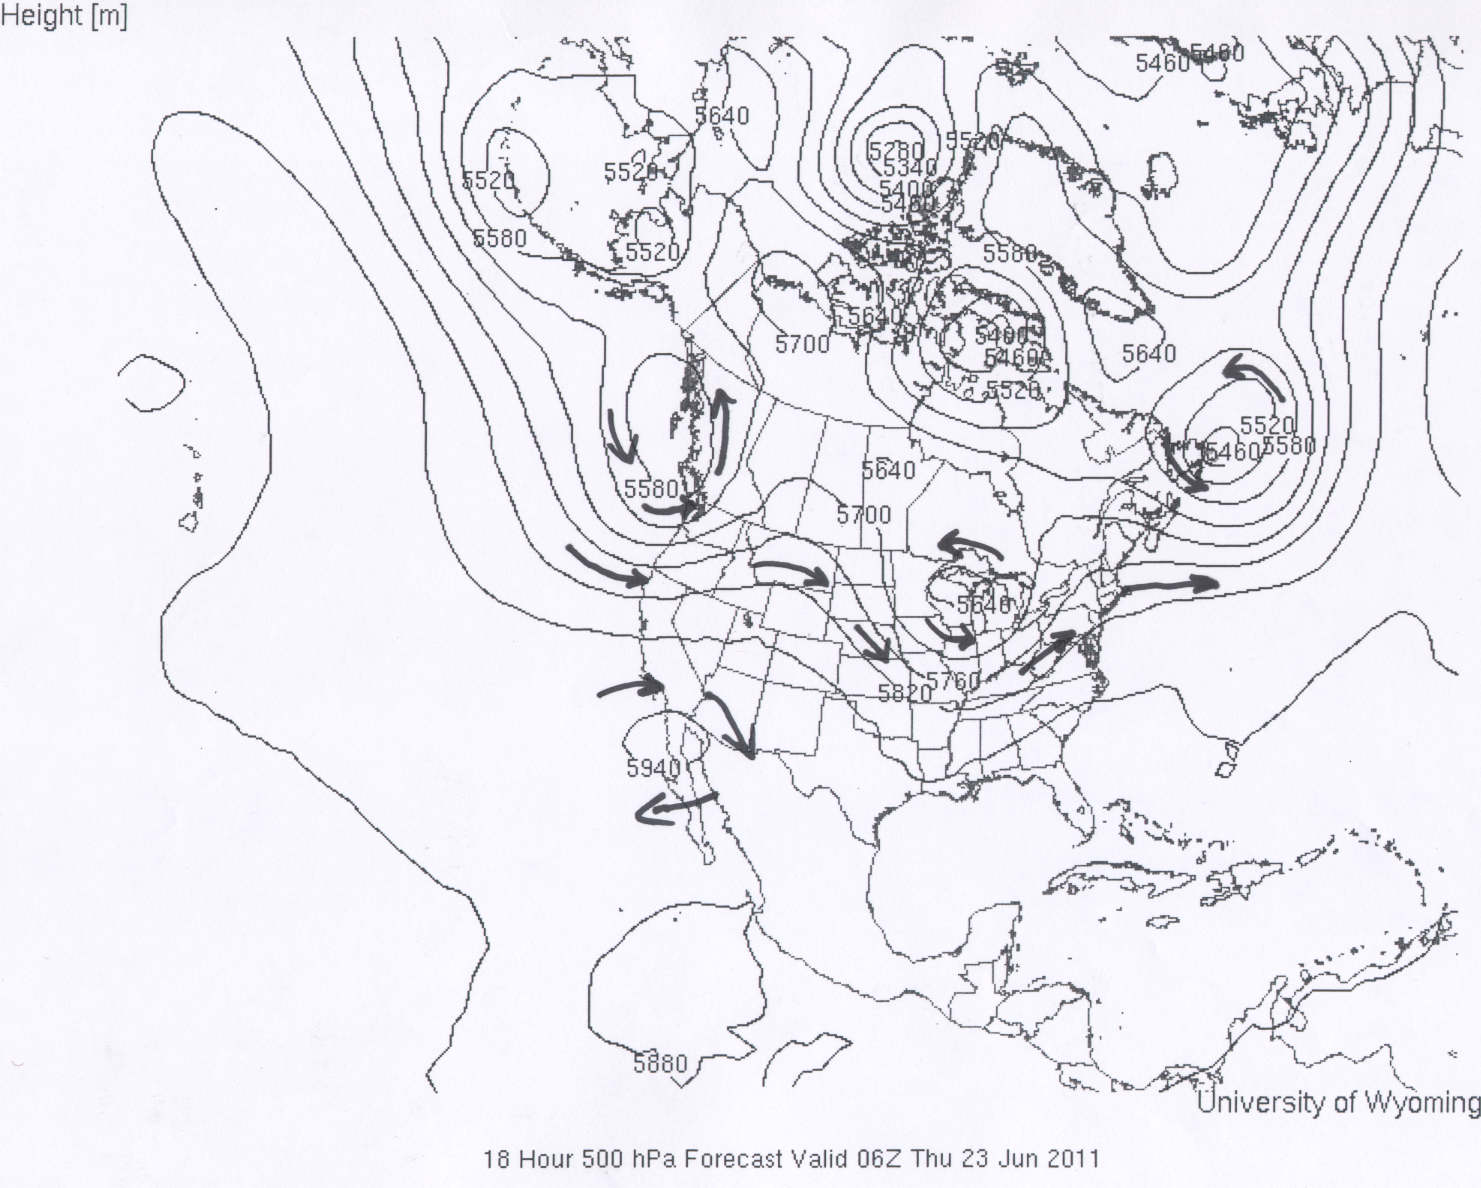
In the first example for 500 mb winds the lines with arrows represent the trajectory of the air flow at various places within the 500 mb height pattern. Regions of strong and weak wind speeds based on the spacing of the height contours are marked on the map. In the second example for 500 mb winds arrows are again used to mark wind trajectories. It is also emphasized that the flow around closed highs is clockwise and the flow around closed lows is counterclockwise.
The 500 mb winds can have a large influence on the motion of smaller-scale weather features, such as the movement of surface low pressure areas, the movement of hurricanes, and the movement of individual thunderstorm cells. In fact where thunderstorms do form, they generally move as a unit in the direction of the winds near the 500 mb pressure level. This is something that we will pay attention to when local (Tucson, AZ) thunderstorms form.
As mentioned above, the typical 500 mb flow over the southwestern United States is generally westerly (west to east). This is a consequence of the fact that for most of the year, the average air temperature between the ground and 500 mb gets colder as one moves toward the north, which means lower 500 mb heights are found toward the north and the corresponding 500 mb winds are west to east (parallel to the height contours with lower heights to the left of the wind direction). One indicator of the southwest monsoon is to have higher 500 mb heights form to the north of southern Arizona. This results in a wind shift at 500 mb, with 500 mb winds that have an easterly component, i.e., winds from east toward west. Note that the rule for 500 mb wind direction is the same. With higher heights to the north of Tucson, the 500 mb wind direction will be generally east to west.
The meteorological definition of a Monsoon is simply a seasonal shift in wind direction. Often a monsoon season is also characterized by a shift in precipitation (as it is in the southwestern United States and India), but it need not be. Please read over the following link, North American Monsoon article by the NWS. You should understand graphics 2 and 3, which show the monsoonal wind shift at the 500 mb height levels (Graphic 1 shows wind patterns just above the ground surface, which we are not covering in this course). Graphic 3 shows one favorable position for the "monsoon high" in the sense that there are southeast winds at 500 mb over Tucson. As long as there is an easterly component to the 500 mb wind direction, Tucson will generally be favored for thunderstorms. Basically if the high center is north of Tucson, there will be an easerly component to the 500 mb wind direction. The chance for thunderstorms also depends on whether or not there is sufficient water vapor in the atmosphere as discussed in the next section.
In reality, the local 500 mb height pattern changes from day to day. When the center of highest heights is south of Tucson, rain generally does not fall in Tucson. Worse yet, when the high center is directly overhead, not only is it generally rain-free, but also quite hot as the core of warmest air is right over us. The best chances for summer rains in Tucson happen when the 500 mb high center is north of our area. Look again at the map for 0600 GMT, June 23 (Second example above), there is a high center located to the southwest of Tucson, and the 500 mb windflow over our area is from the northwest, which is not favorable for clouds and rain. This is expected since the summer monsoon season has not begun as of late June.
![]()
![]()
![]()
![]()