![]()
![]()
![]()
![]()
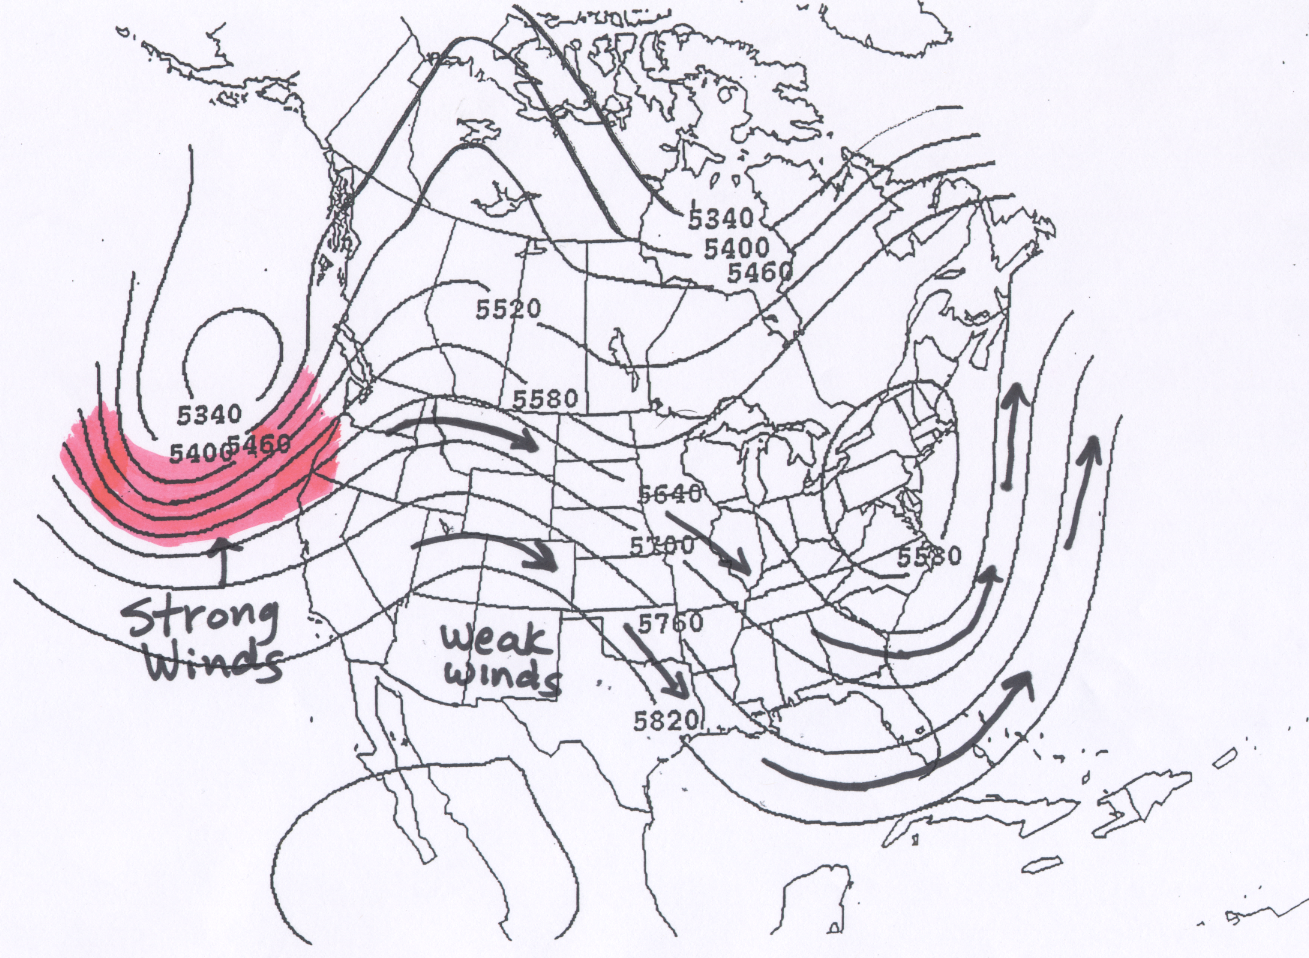
The wind at 500 mb can be determined from the height pattern. The wind blows parallel to the height contours with lower heights to the left of the wind direction. In other words, if you are moving with the 500 mb level wind at your back, lower 500 mb heights will be toward your left and higher 500 mb heights will be toward your right. More information on winds and weather maps is provided below and in the next page of the reading material. During the winter months across the United States, this means that the 500 mb winds across generally blow from west toward east, but follow the wavy pattern of the height contours. This is because the air temperature generally gets colder as one move toward the north and 500 mb heights generally get lower. This general west to east air motion at the 500 mb height level weakens in the summer as the temperature differences between the tropics and the Arctic becomes weaker. Keep in mind that this is the wind several thousand meters above the Earth's surface and not the wind that would be felt on the ground.
The wind speed is faster where the height lines are closer together, and slower where the height contours are spaced further apart. If this helps, you can think of the 500 mb height lines as channels through which the air moves. The wind follows the wavy pattern of the lines, and gets squeezed together where the lines get closer together, resulting in faster winds. This is just how water would flow in a hypothetical channel. A couple of examples are include below.
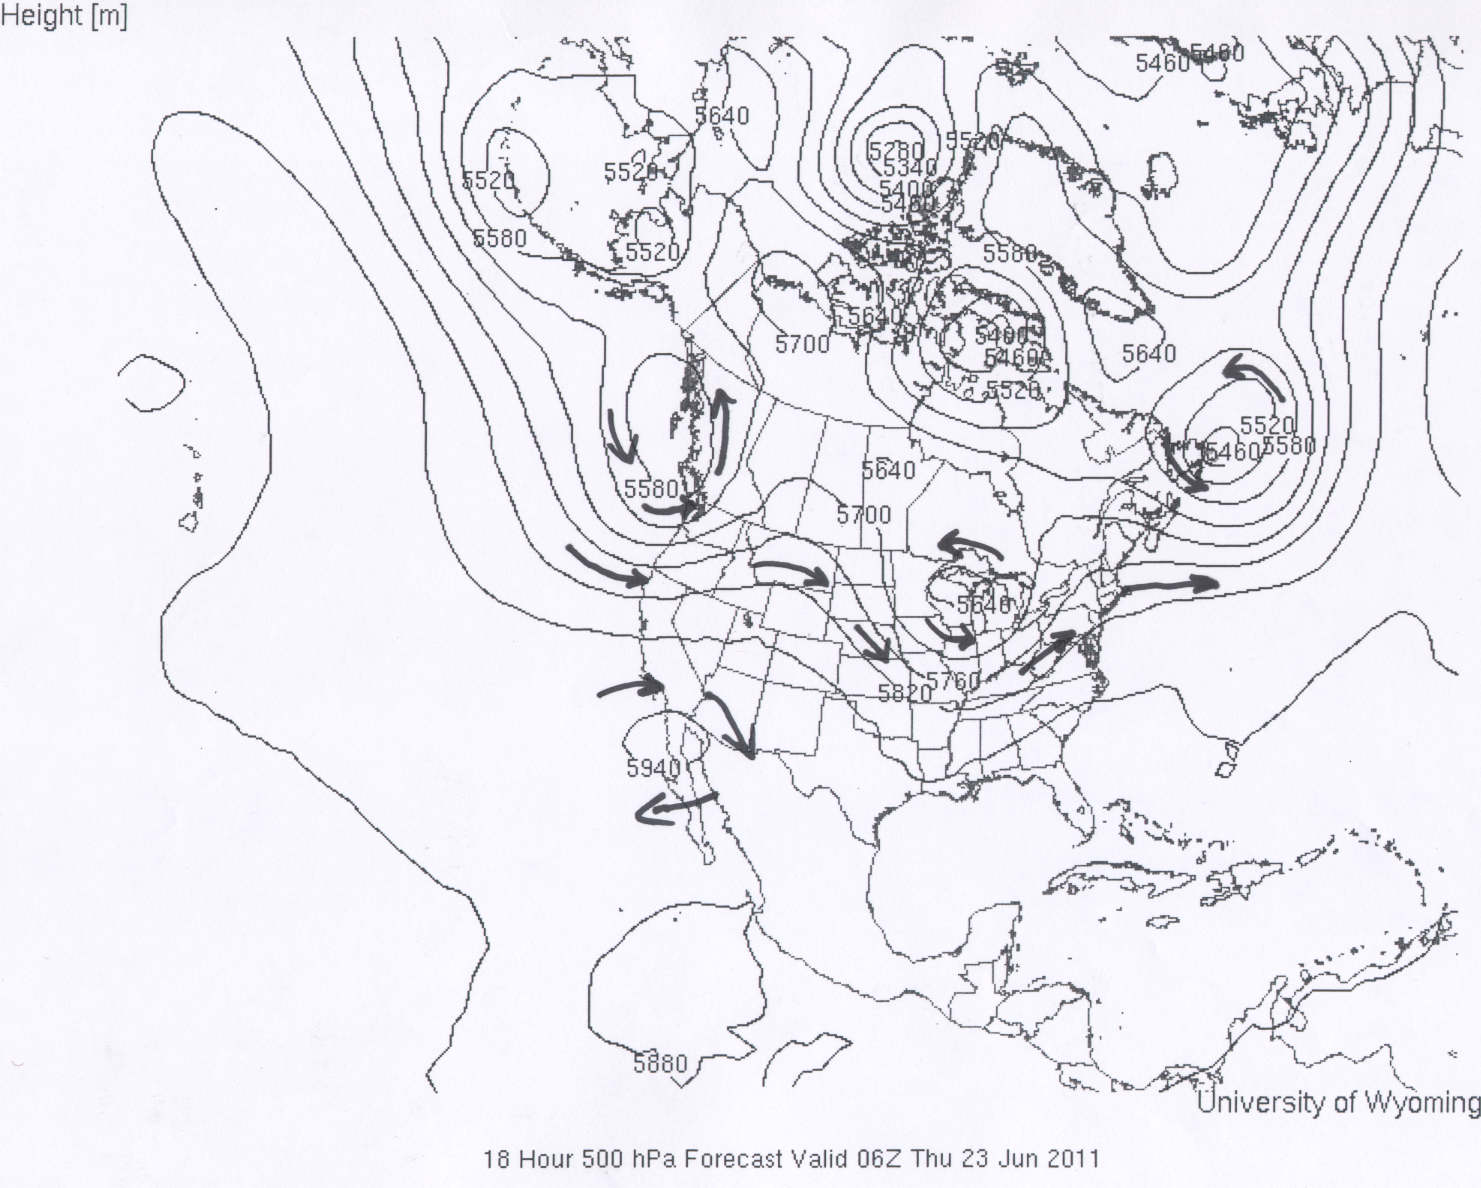
In the first example for 500 mb winds the lines with arrows represent the trajectory of the air flow at various places within the 500 mb height pattern. Regions of strong and weak wind speeds based on the spacing of the height contours are marked on the map. In the second example for 500 mb winds arrows are again used to mark wind trajectories. It is also emphasized that the flow around closed highs is clockwise and the flow around closed lows is counterclockwise.
The 500 mb winds can have a large influence on the motion of smaller-scale weather features, such as the movement of surface low pressure areas, the movement of hurricanes, and the movement of individual thunderstorm cells. In fact where thunderstorms do form, they generally move as a unit in the direction of the winds near the 500 mb pressure level. This is something that we will pay attention to when local (Tucson, AZ) thunderstorms form.
As mentioned above, the typical 500 mb flow over the southwestern United States is generally westerly (west to east). This is a consequence of the fact that for most of the year, the average air temperature between the ground and 500 mb gets colder as one moves toward the north, which means lower 500 mb heights are found toward the north and the corresponding 500 mb winds are west to east (parallel to the height contours with lower heights to the left of the wind direction). One indicator of the southwest monsoon is to have higher 500 mb heights form to the north of southern Arizona. This results in a wind shift at 500 mb, with 500 mb winds that have an easterly component, i.e., winds from east toward west. Note that the rule for 500 mb wind direction is the same. With higher heights to the north of Tucson, the 500 mb wind direction will be generally east to west.
The meteorological definition of a Monsoon is simply a seasonal shift in wind direction. Often a monsoon season
is also characterized by a shift in precipitation (as it is in the southwestern United States and India), but it need not be.
The term monsoon is often misused, even by many TV weather reporters. It is incorrect to call a summer thunderstorm
a "monsoon" or to say it is "monsooning" outside during a summer thunderstorm. There is a monsoonal shift in winds that
happens every year in the southwestern United States and northwestern Mexico though. This shift in wind patterns is most
easily seen by looking at the seasonal shift in wind direction that occurs at the 500 mb pressure level. Below are links to
higher resolution monthly average 500 mb height maps that have been annotated to show the monsoonal shift in wind direction
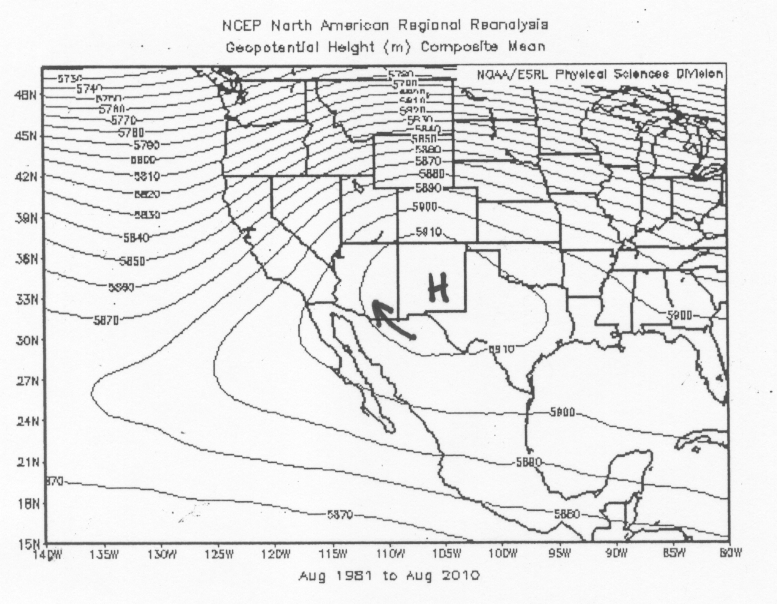
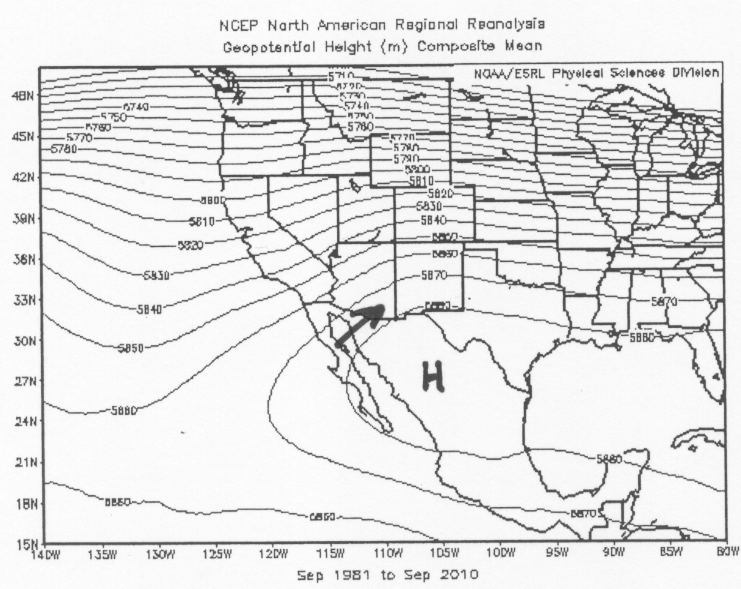
that takes place during the months of July and August over the southwestern United States. In the figures below the 500 mb
height contours are shown every 10 meters, instead of the more common every 60 meters. This is done to better show the wind
direction at 500 mb in Tucson. The bold 'H' indicates where the highest 500 mb heights are located in the vicinity of
the southwestern
United States. The bold arrow indicates the 500 mb wind direction in Tucson based on the average height pattern shown.
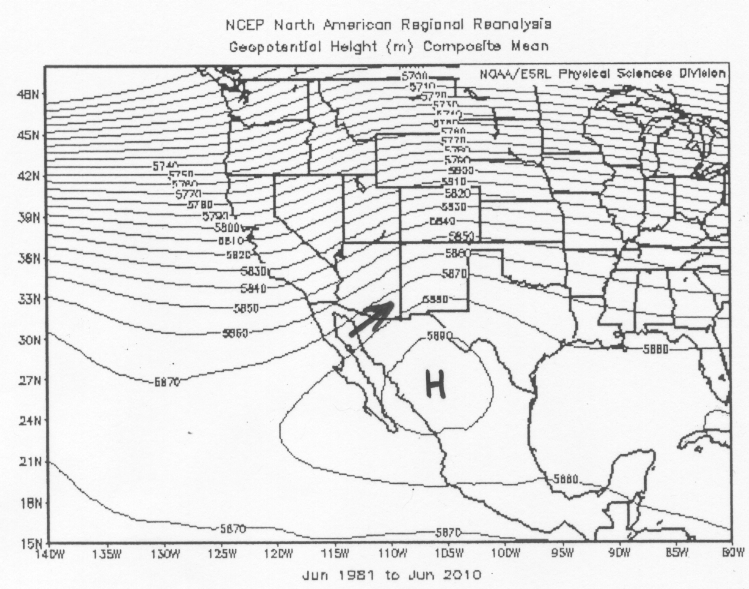
Notice that the average wind direction is southwest (from the southwest) during the month of June. This is prior to
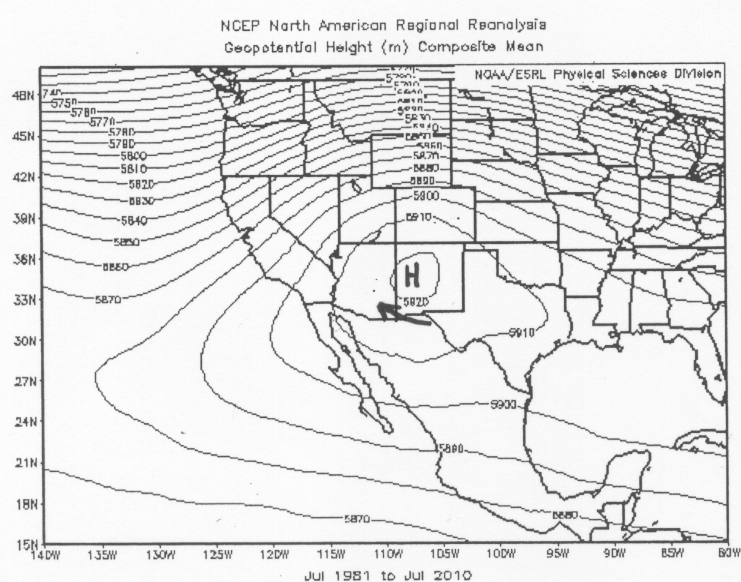
the southwest monsoon season. During the monsoon months of July and August, the 500 mb high moves to the north and
east of Tucson and the average wind direction is from the east and
southeast. In September, the high center moves back to the south of Tucson, the wind direction shifts back to southwest,
which indicates the end of the monsoon season.
June Average 500 mb heights and Tucson wind direction
July Average 500 mb heights and Tucson wind direction
August Average 500 mb heights and Tucson wind direction
September Average 500 mb heights and Tucson wind direction
Please also read over the following link, North American Monsoon article by the NWS. You should understand graphics 2 and 3, which show the monsoonal wind shift at the 500 mb height levels (Graphic 1 shows wind patterns just above the ground surface, which we are not covering in this course). Graphic 3 shows one favorable position for the "monsoon high" in the sense that there are southeast winds at 500 mb over Tucson. As long as there is an easterly component to the 500 mb wind direction, Tucson will generally be favored for thunderstorms. Basically if the high center is north of Tucson, there will be an easerly component to the 500 mb wind direction. The chance for thunderstorms also depends on whether or not there is sufficient water vapor in the atmosphere as discussed in the next section.
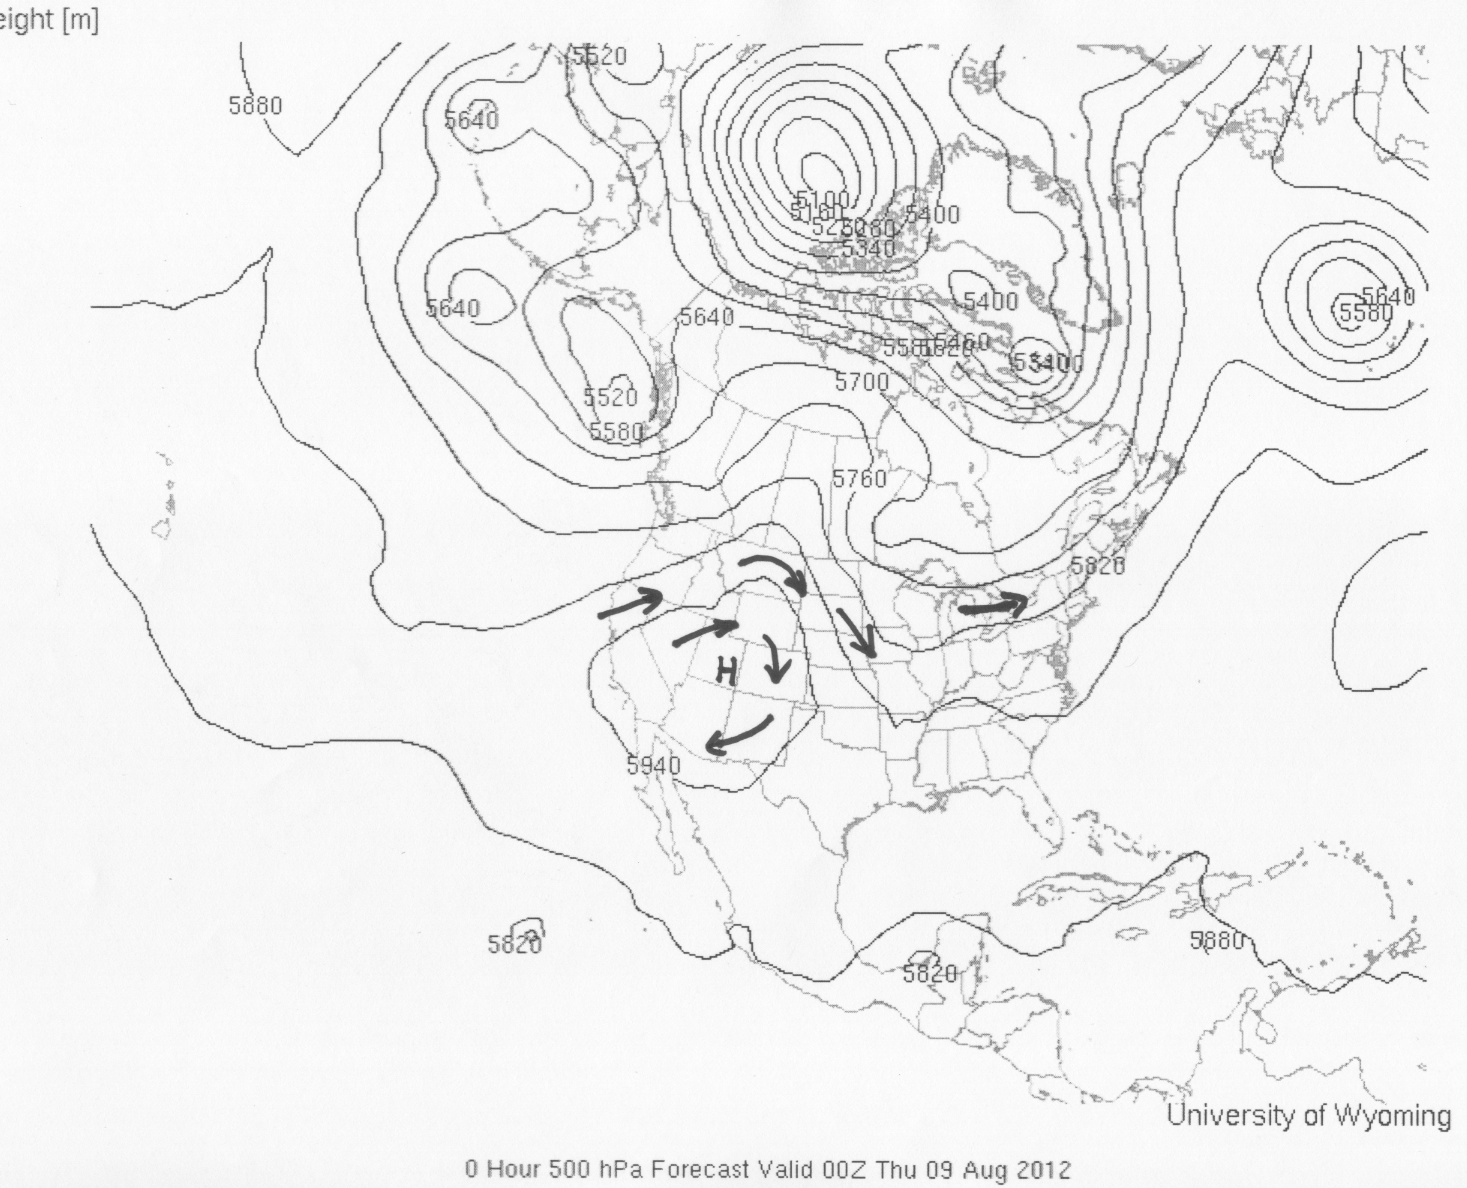
In reality, the local 500 mb height pattern changes from day to day and a monsoonal height and wind pattern comes and goes throughout the months of June through September. It is common for there to be periods of several days to a week with favorable conditions for thunderstorms followed by several days to a week of unfavorable conditions. The officially defined monsoon season runs from June 15 through September 15. When the center of highest heights is south of Tucson, rain generally does not fall in Tucson. Worse yet, when the high center is directly overhead, not only is it generally rain-free, but also quite hot as the core of warmest air is right over us. The best chances for summer rains in Tucson happen when the 500 mb high center is north of our area. An example of a 500 mb height pattern that is unfavorable for summertime thunderstorms in Tucson is shown in the map for 0600 GMT, June 23 (Second example above). On that map, there is a high center located to the southwest of Tucson, and the 500 mb windflow over Tucson is from the northwest, which is not favorable for clouds and rain. An example 500 mb height pattern which is more favorable for thunderstorms in Tucson is shown in this example of a 500 mb pattern favorable for thunderstorms in Tucson. The timestamp at the bottom of the map 00Z, Thursday, August 9, 2012 corresponds to a local time in Tucson of 5 PM Wednesday, August 8, 2012. The approximate center of highest heights is indicated with an "H" along with several arrows showing the wind trajectory at various places on the map. One thing to point out is that the 500 mb height over Tucson is above 5940 meters. This is well above the average height of just over 5880 meters for Tucson during the month of August. Thus, we would expect warmer than average temperatures in the area, which was the case as a record high of 107°F was recorded. With regard to the possibility of summer thunderstorms, notice that the high center is north of Tucson and the 500 mb wind flow is northeasterly (from the northeast). This is a favorable wind direction for monsoon season thunderstorms in Tucson as there is an easterly component to the wind direction. In fact thunderstorms did form in the mountains to the east and northeast of Tucson in the early afternoon and by 5 PM had moved into the Tucson area. Remember that the movement of individual thunderstorms is often in the direction of the 500 mb winds. An interesting weather product provided by the department of Atmospheric Sciences is a movie loop of the 500 mb height pattern over the previous 24 hours. In addition to the 500 mb height pattern, satellite-derived water vapor imagery is superimposed on the images. Without going into details, the water vapor imagery distinguishes areas of high water vapor content and clouds. This allows you to visualize the movement of these features with respect to the 500 mb pattern. Bright white cloud masses are generally steered around by the 500 mb winds.
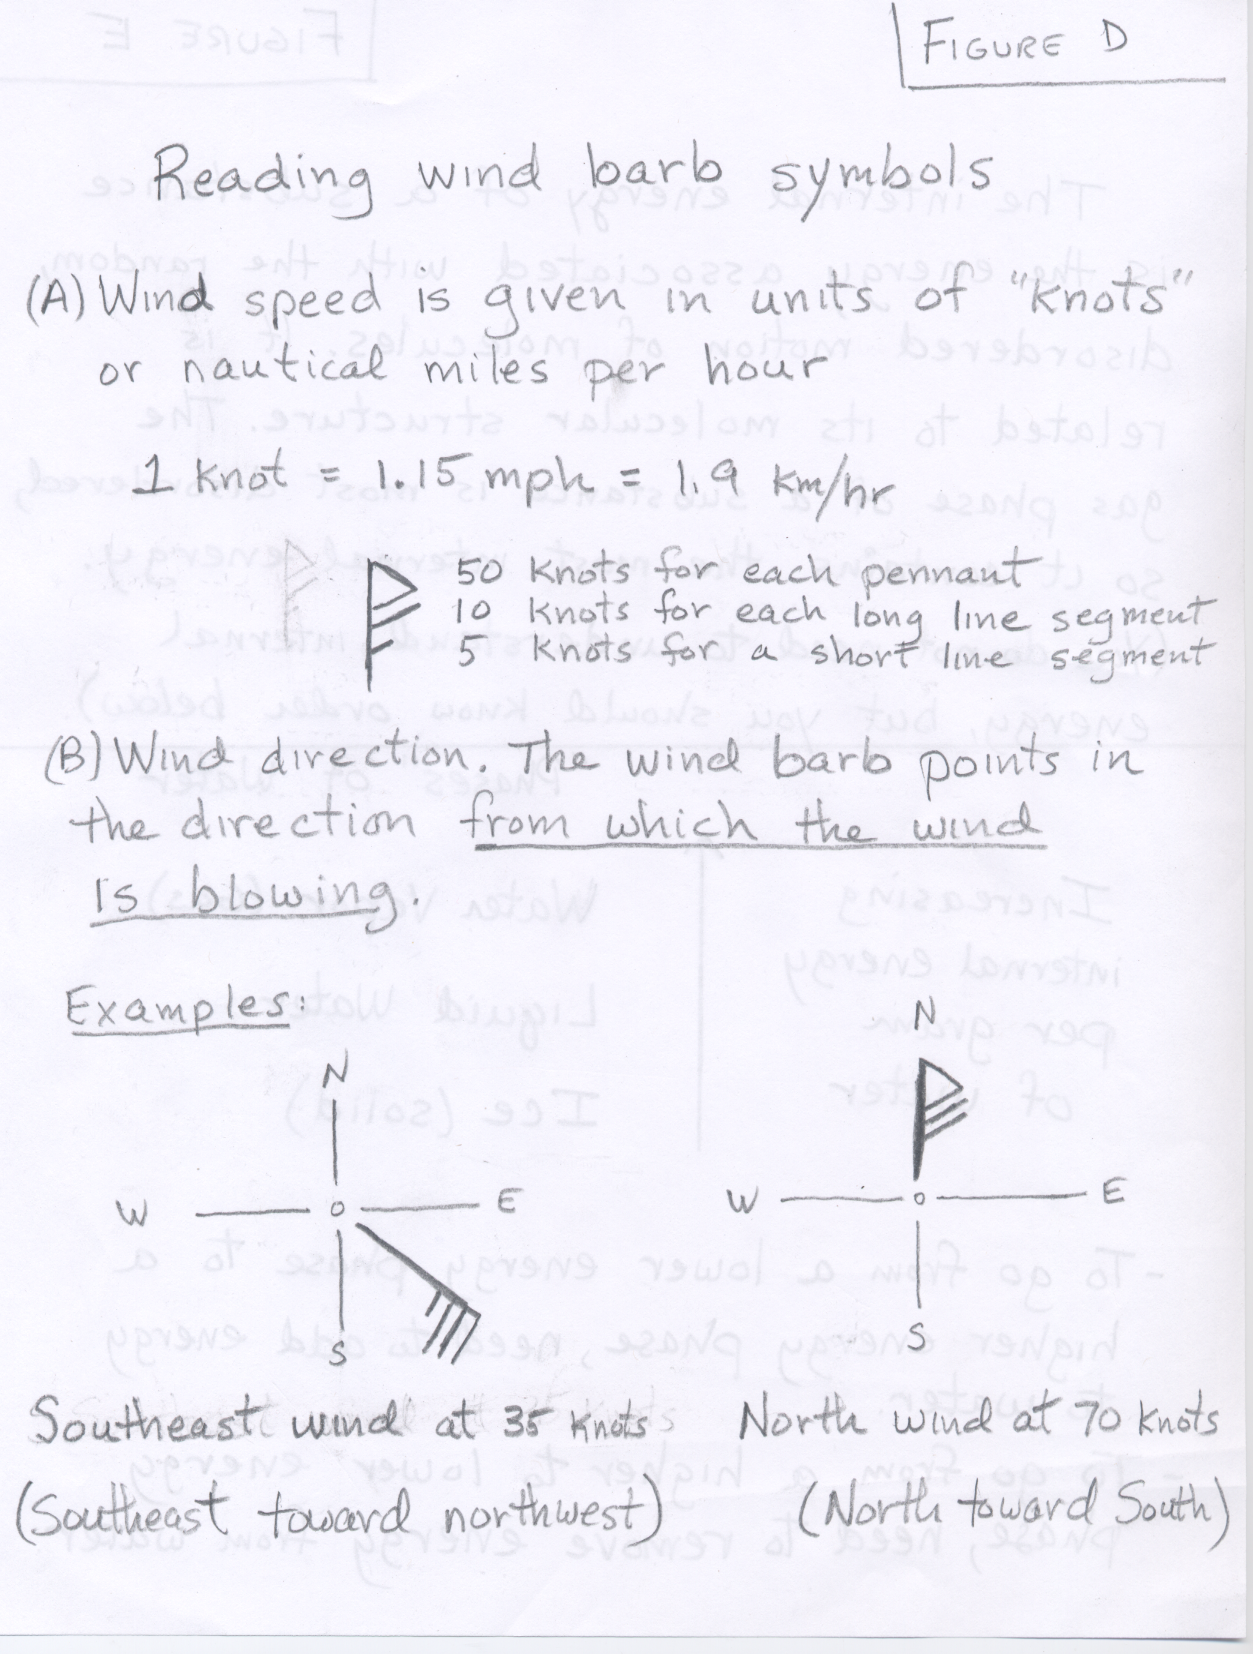
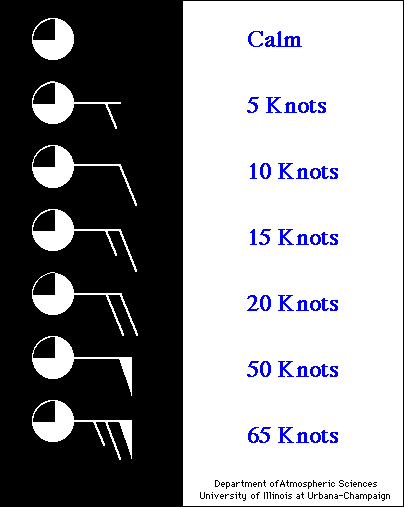
The wind barb symbol is a common way to indicate the wind speed and wind direction at points on weather maps. The wind barb consists of a line segment starting at the location (point on a map) where the wind information is provided and points in the direction from which the wind is coming with shorter line segments and flags attached to the end of the direction line segment to specify wind speed. For a wind from the north the barb sticks straight up, from the east the barb points right, from the south the barb points straight down, and from the west the barb points left. Wind speed is indicated by the line segments and flags attached to the end of the barb. There are long and short line segments. Each long line segment represents 10 knots of wind (there can be up to 4 long line segments). A short line segments represents an additional 5 knots of wind. If the wind speed is less than 5 knots, then an open circle is drawn on top of the location where the wind is indicated. By the way a knot is a nautical mile per hour (1 knot = 1.15 miles per hour). You should look over the links below.
(Figure D Reading wind barb symbols) ; (Legend for wind speed)
ECMWF forecast of 500 mb heights and winds (Courtesy of University of Oklahoma Weather Lab)
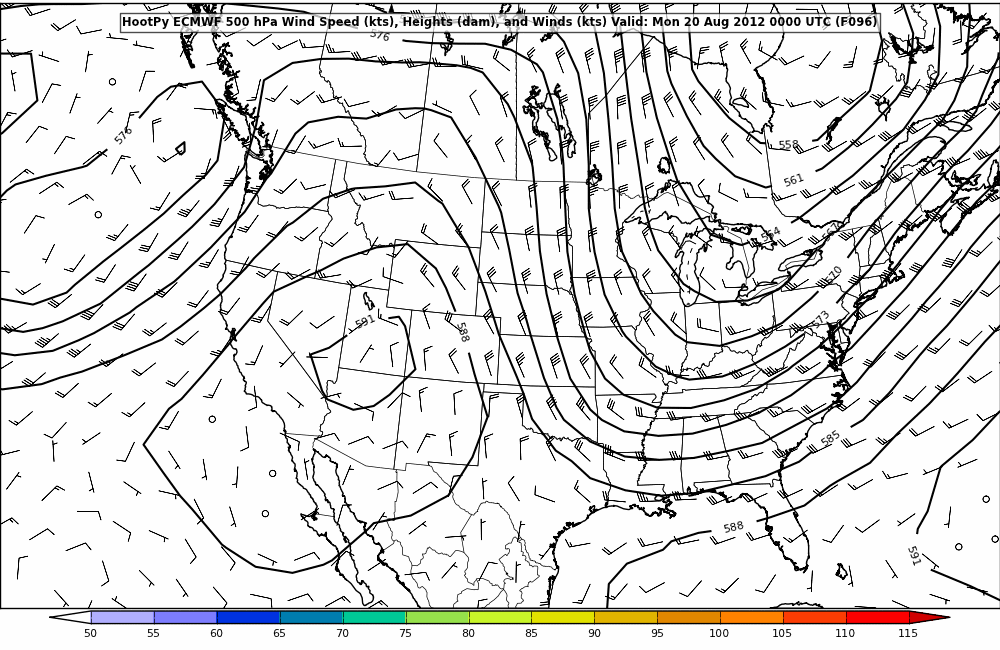
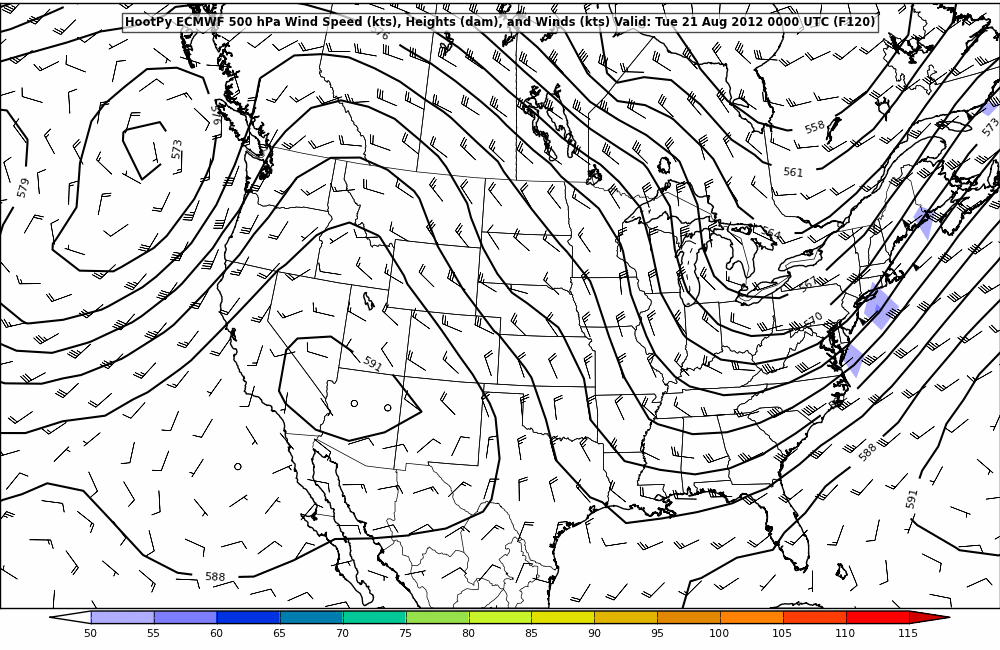
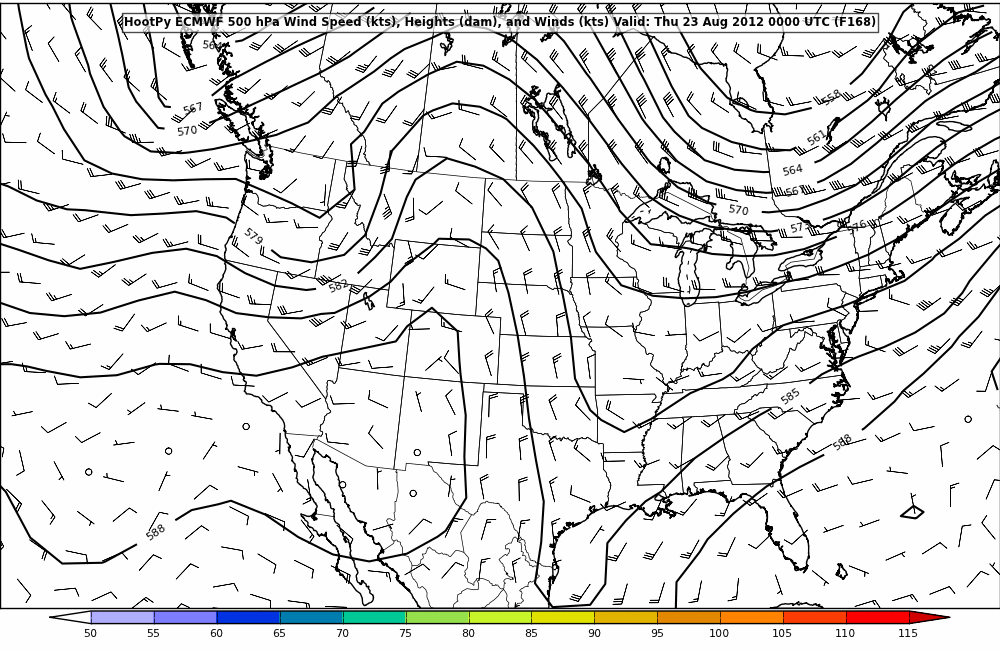
I captured a few forecast images via the link above on Thursday, August 16 and placed them in the table below. Click on the map links to open a large image.| ECMWF 500 mb Forecasts | Points about Map |
| 96 hour forecast | Forecast valid for Monday, August 20, 2012 at 0000 hours (midnight). Tucson local time is 7 hours earlier or 5 PM on Sunday, August 19. The (F096) in top label indicates this was a forecast made 96 hours into the future. The 500 mb height lines on these maps are drawn every 30 meters and the last zero is dropped. The 500 mb height over Tucson is roughly 5895 meters. (Tucson is almost midway between the 588 and 591 lines). Note that center of the highest heights is north of Tucson. The general clockwise air flow around the closed high, which has closed 5910 meter and 5880 meter closed contours, results in east to northeast wind flow at 500 mb over Tucson. This is typically a favorable height and wind pattern for Tucson to get monsoon season thunderstorms. Remember this is a forecast and weather forecasts are not perfect, but according to this forecast, I would expect a good chance for rain on Sunday, August 19, the day before classes begin. | 120 hour forecast | Forecast valid for Tuesday, August 21, 2012 at 0000 hours (Tucson time 5 PM on Monday, August 20). This map is a forecast for 120 hours (5 days) into the future. Again there is a 500 mb closed high that is north of Tucson. The 500 mb winds over Tucson are 10 knots from the east (slightly north of east), which is favorable for monsoon season thunderstorms. Thus, this forecast would indicate a good chance for showers and thunderstorms in Tucson on Monday afternoon and evening for the first day of the semester. Notice the 500 mb ridge and closed high over the western US. 500 mb ridges mean above average temperature. There is a trough in the Eastern United States, which corresponds with below average temperatures. You should verify that the wind directions on the map are consistent with rules for determining wind direction based on the 500 mb height pattern. The wind speeds are also greatest where the height lines are closest together and weakest where the height lines are spread furthest apart. The general west to east wind flow through the trough and rigde pattern exemplify the typical 500 mb wind pattern in the middle latitude regions of Earth. As we move into the fall season, the westerly winds will spread southward (toward the equator) and cover all of Arizona. | 168 hour forecast | Forecast valid for Thursday, August 23, 2012 at 0000 hours (Tucson time 5 PM on Wednesday, August 22, middle of the first week of classes). There is no longer a 5910 meter closed high associated with the ridge. However, based on the wind pattern in Arizona and northern Mexico, there is a 500 mb high center near the open wind circle (wind barb for calm winds) that is south of Arizona near the coast of the Gulf of California. Note the clockwise winds around that point on the map. Thus, the high center is south of Tucson and the 500 mb winds are from the northwest at 10 knots. This is an unfavorable height and wind pattern for summer thunderstorms in Tucson. Based on this map, I would say the rain is not likely in Tucson on August 22. However, this is a 168 hour or 7 day weather forecast and weather forecasts become more uncertain the further you move into the future. |
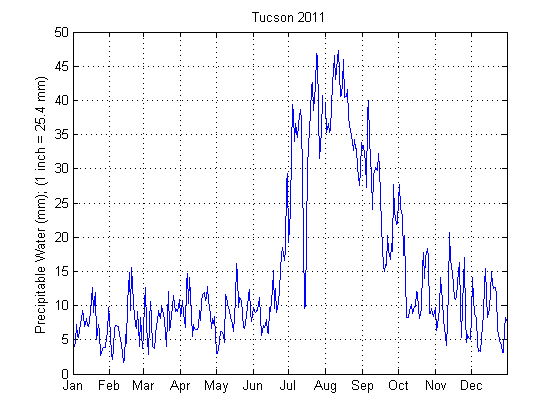
The monsoon season happens every year in the southwestern United States. While a monsoon is defined by the seasonal change in winds, monsoons are often associated with changes in humidity and precipitation. The change in water vapor content is obvious when looking at the changes in precipitable water over a year, for example, Tucson daily average precipitable water for 2011.
As you may know if you are from Tucson or as you may learn if you follow local weather during the monsoon season, accurately predicting whether or not Tucson will get thunderstorms on a given day is very difficult. The department of Atmospheric Sciences runs a local weather model, which makes forecasts for a portion of the southwest US and northwest Mexico. If you are interested in an alternative weather forecast for Tucson, check out Regional forecast for southeast Arizona from ATMO WRF Model.
![]()
![]()
![]()
![]()