![]()
![]()
![]()
![]()
This section is bascially a review of what was covered at the beginning of the semester. The wind at 500 mb can be easily determined from the height pattern. The wind blows parallel to the height contours with lower heights to the left of the wind direction. Based on the maps we have looked at this means that the winds generally blow from west toward east, but follow the wavy pattern of the height contours. This will be shown using the 500 mb maps handed out in class. Keep in mind that this is the wind several thousand meters above the Earth's surface and not the wind that would be felt on the ground.
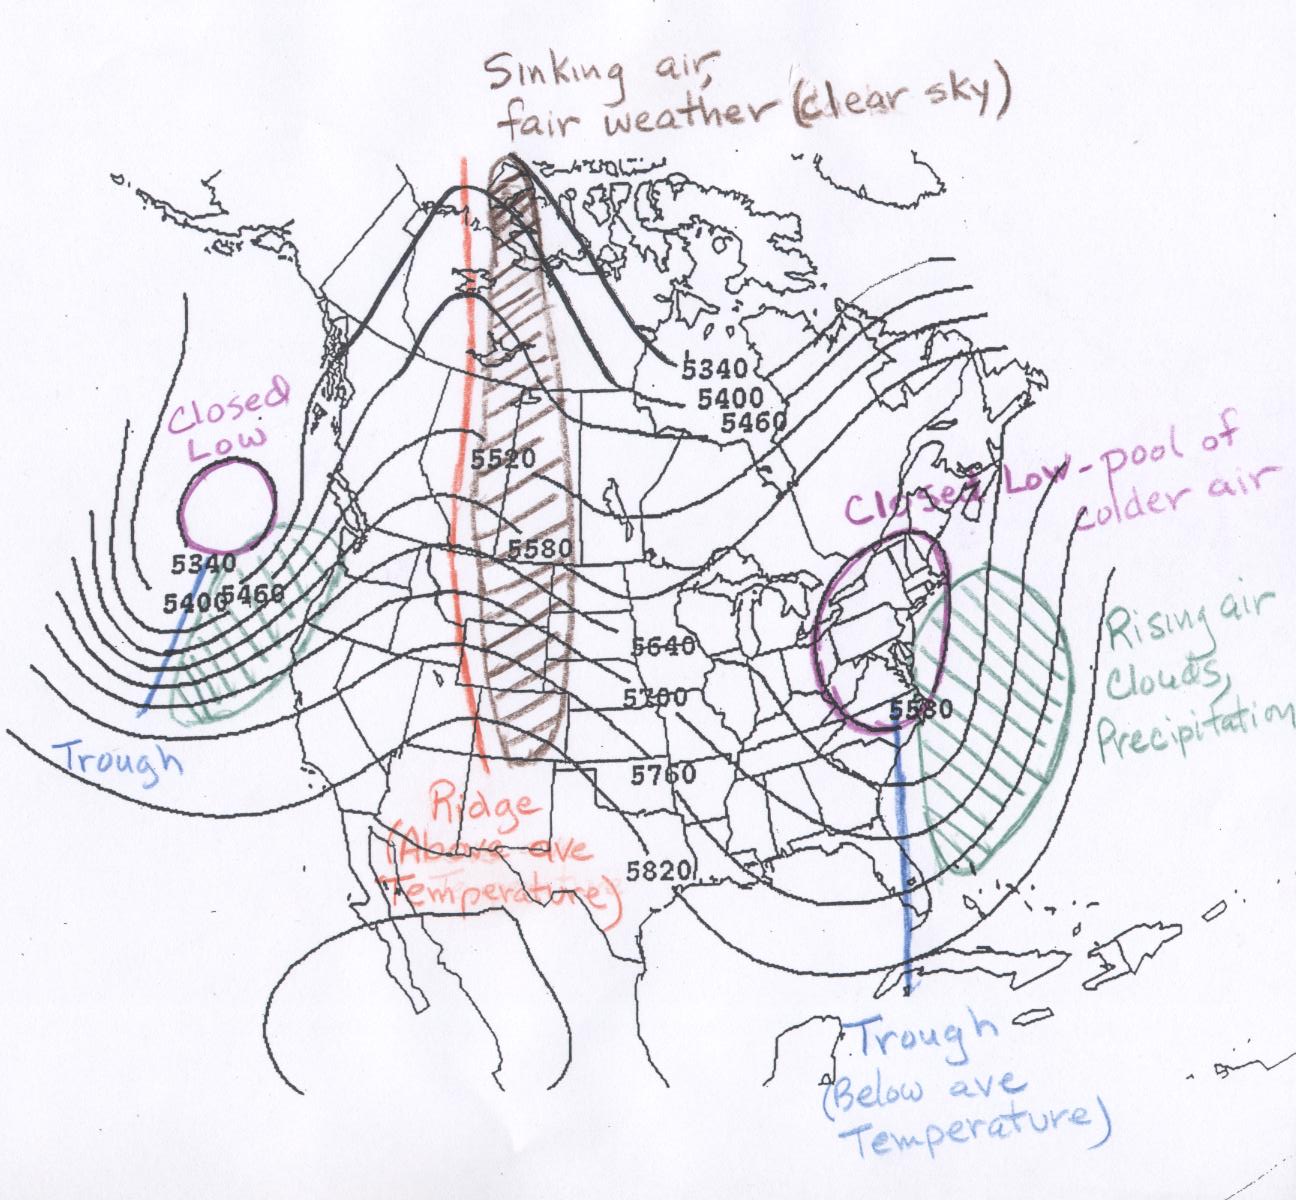
The wind direction at 500 mb can also help you to understand the relationship between troughs and cold temperatures and ridges and warm temperatures. Winds entering a trough often have a component from the north, which generally moves colder air from the north toward the south. Winds entering a ridge often have a component of the wind from the south, which generally brings warmer air from the south.
In general troughs and ridges do not have to be oriented along a north-south axis. The best way to identify troughs and ridges is to visualize the 2-Dimensional wind trajectory based on the 500 mb height pattern. The wind trajectory traces the motion of air. With troughs (and closed lows) the air flow makes a counterclockwise turn and with ridges (and closed highs) the air flow makes a clockwise turn.
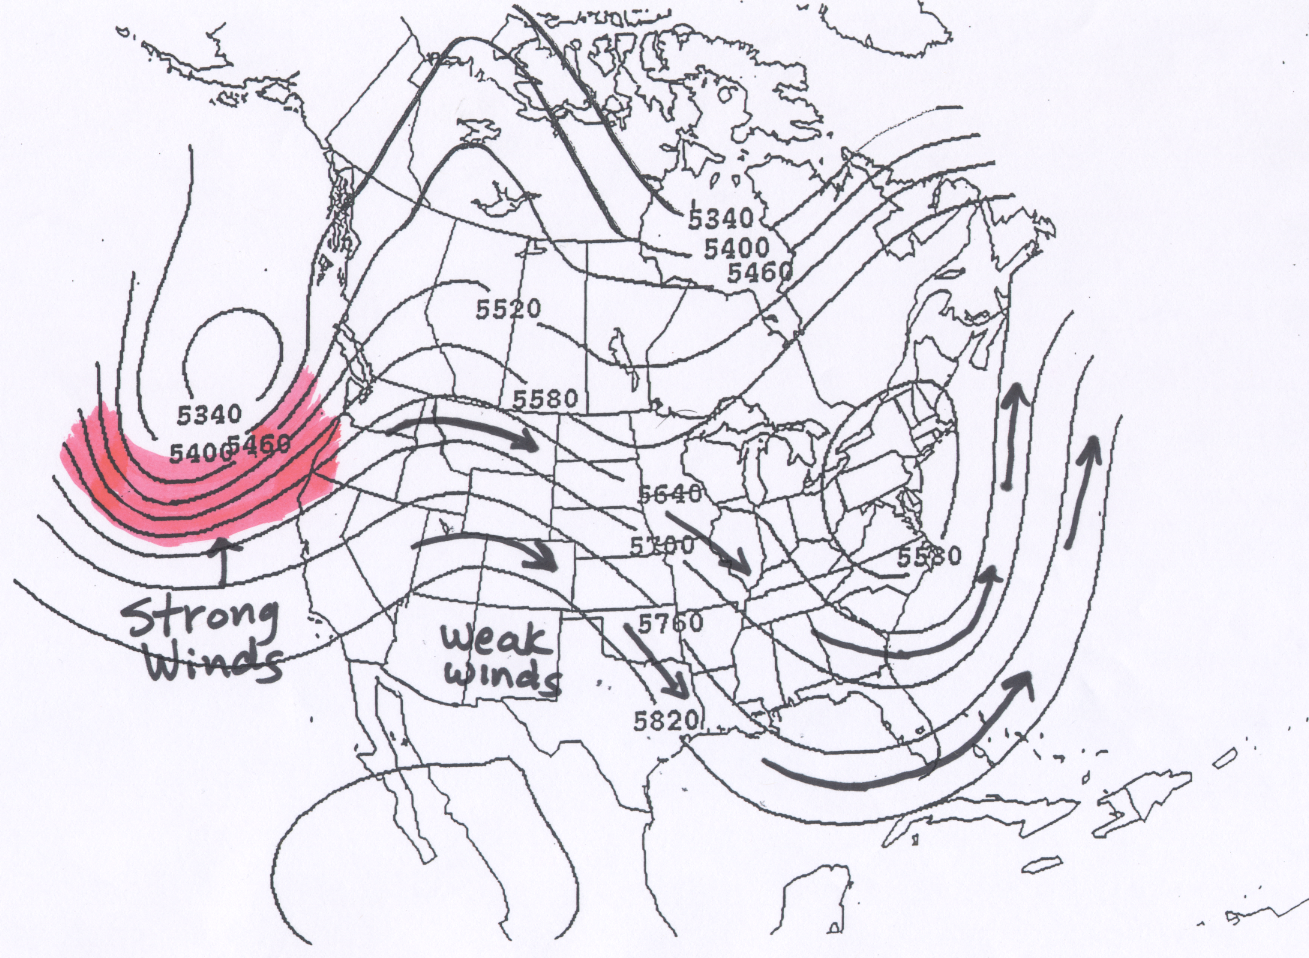
The wind speed is faster where the height lines are closer together, and slower where the height contours are spaced further apart. If this helps, you can think of the 500 mb height lines as channels through which the air moves. The wind follows the wavy pattern of the lines, and gets squeezed together where the lines get closer together, resulting in faster winds. This is just how water would flow in a hypothetical channel. A few examples are included below.
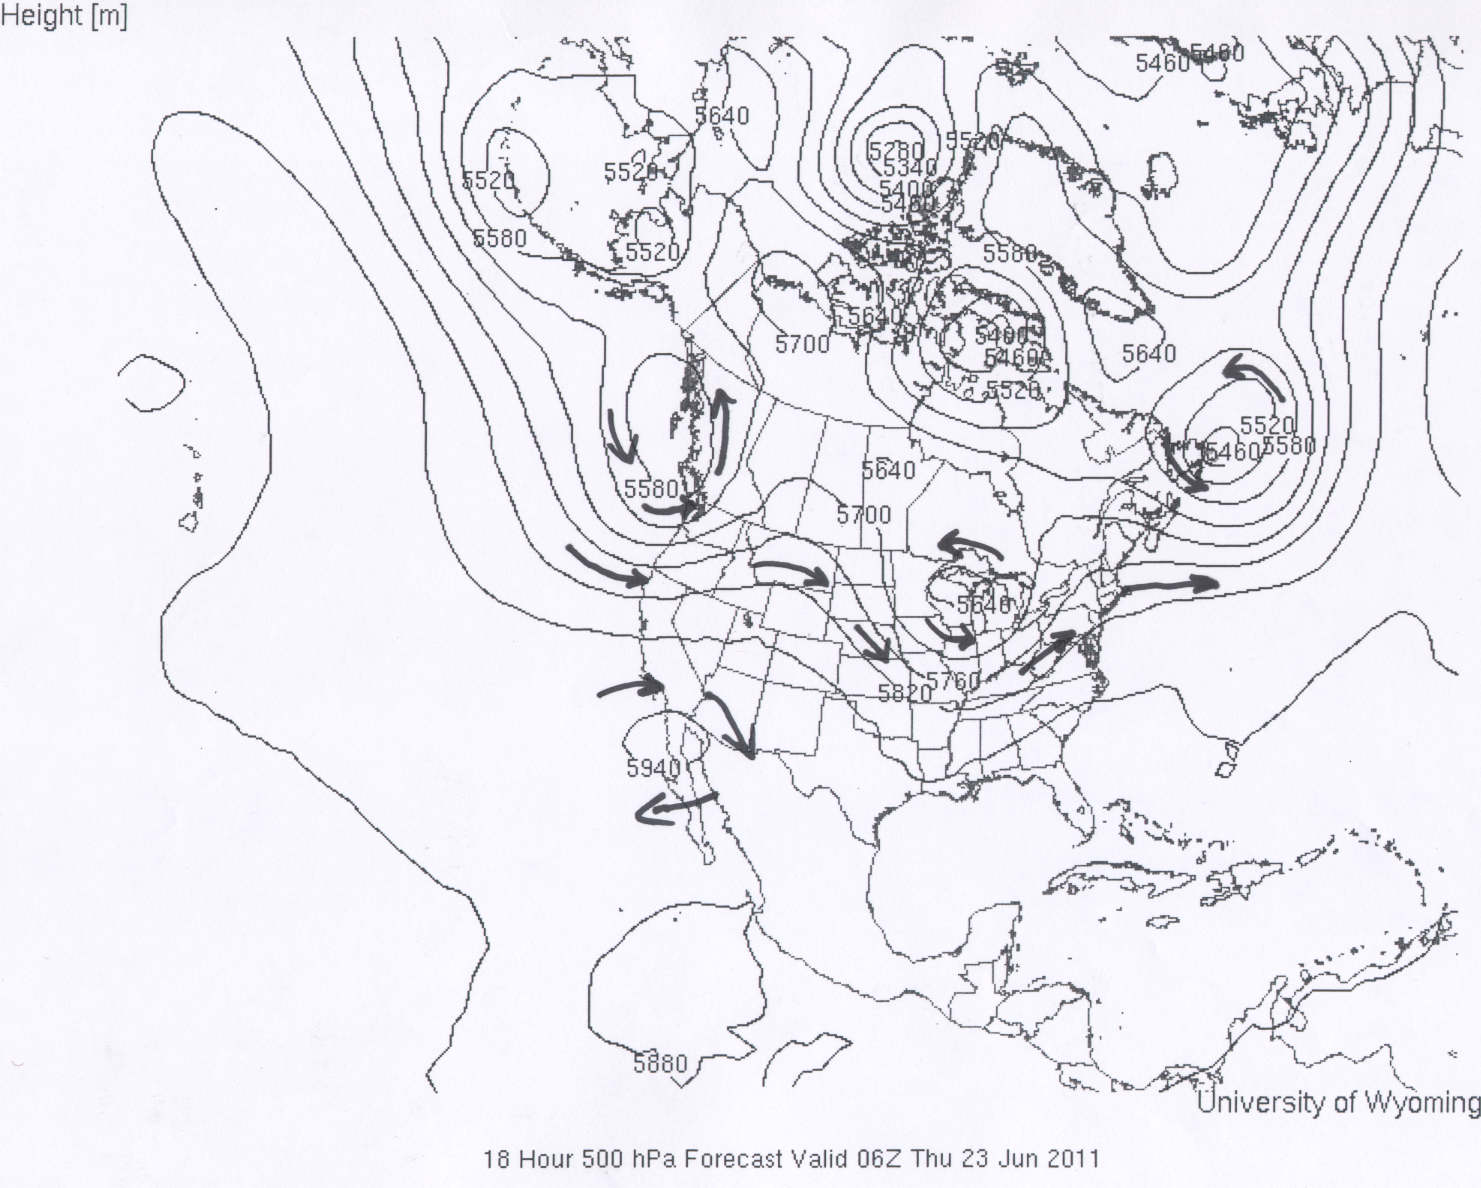
In the first example for 500 mb winds the lines with arrows represent the trajectory of the air flow at various places within the 500 mb height pattern. Regions of strong and weak wind speeds based on the spacing of the height contours are marked on the map. In the second example for 500 mb winds arrows are again used to mark wind trajectories. It is also emphasized that the flow around closed highs is clockwise and the flow around closed lows is counterclockwise. A visualization of the relationship between the 500 mb height pattern and the winds at high alitudes can be seen by looking at a movie of the 500 mb height pattern superimposed over a satellite image that is sensitive to the motions of clouds and water vapor at high altitudes. The weather data available from the UA Department of Atmospheric Sciences produces a movie showing the evolutions of the 500 mb height pattern over the last 24 hours (one frame per hour) superimposed on what is known as a satellite "water vapor image." The water vapor image is able to "see" or "sense" the presence of clouds and relatively high water vapor concentrations at high altitudes. Although, it is most sensitive to clouds and water vapor at altitudes higher than the 500 mb height (lower air pressure), the winds at those altitudes are often similar to those at 500 mb. When you look at the loop, notice that the features in the water vapor image generally move parallel to the 500 mb height pattern with lower heights to the left of the wind direction. It can be a bit tricky because the 500 mb height pattern is changing with time along with the winds. Link to 500 mb movie for the last 24 hours
The 500 mb winds can have a large influence on the motion of smaller-scale weather features, such as the movement of surface low pressure areas, the movement of hurricanes, and the movement of individual thunderstorm cells. In this context, smaller-scale means small compared to the size of the larger scale trough and ridge pattern. For these reasons, the winds at the altitude of the 500 mb pressure level are often referred to as the "steering level" winds.
Clouds and precipitation are most likely to be occurring just downwind (or downstream) from the location of 500 mb troughs. Following the 500 mb wind flow, this is the region just after the wind has gone through the trough and starts heading toward the next ridge. Click here to see Example map, which shows that regions just beyond a 500 mb trough axis are regions where we would predict the best chance of precipitation based on the 500 mb height pattern. The reason for this is that rising air motion is forced in this part of the flow pattern. Rising motion means that air moves vertically upward. At this point you are only expected to be able to identify regions favored for rising air motion based on the 500 mb height pattern, not to understand or be able to explain why rising motion happens in those regions. Clouds and precipitation will develop where air rises (as long as there is sufficient water vapor). Conversely, sinking air motion is forced over areas downstream of ridges. Clouds do not develop where air is sinking, or moving vertically downward. Fair weather is most likely in these areas. By looking at the height patterns on a 500 mb map, you should be able to distinguish where clouds and precipitation are most likely and where fair weather is most likely.
Combining the precipitation guideline in the last paragraph with the definition of a troughs and closed lows, consider the following more general statement: Northern Hemisphere 500 mb troughs can be identified as regions where the air flow makes a counterclockwise turn. Where the 500 mb air flow transitions from a counterclockwise curve to a straighter (less curved) flow (typically just after the air has gone through a trough), is the region where rising air motion happens, which favors the development of clouds and precipitation. Note that the 500 mb air flow is counterclockwise around closed lows. Thus, it is common for there to be areas of precipitation that can "wrap around" the counterclockwise circulation associated with closed lows.
This is somewhat simplistic and will not always give you all the details of where it is and is not raining. One problem mentioned above is that the 500 mb height map does not contain any information about the amount of moisture or water vapor that is present in the atmosphere. Therefore, even a strong trough, which forces strong upward air motions, may not produce any precipitation (or even clouds) if there is not enough water vapor in the air. In fact it is fairly common here in the desert to have troughs move through without much in the way of clouds or rain. Since this is not strictly a weather class, we do not have time to cover details like this. The use of 500 mb maps allows you to make a quick (and often decent) assessment of the large-scale temperature and precipitation patterns.
![]()
![]()
![]()
![]()