Friday Sep. 21, 2012
click here to
download today's notes in a more printer friendly format
The earlier class was finishing a test so we got into the
classroom a few minutes later than normal and there was not quite time
for two complete songs from the Robert Plant and Alison Krauss album
Raising Sand. You heard "Sister Rosetta Goes
Before Us" and part of "Let Your Loss by
Your Lesson".
Quiz #1 has been graded and was returned in class today. Please
check the grading carefully and see that the points are added up
correctly.
The 1S1P reports on the 2012 North American Drought have also been
graded. There is now a link on the class homepage where you can
keep track of report grading status.
About 25 sets of Experiment #2 materials
were distributed in class today. Additional materials will be
handed out as people with extended deadlines finish up Expt. #1.
Back to surface weather maps.
On Monday before the quiz we saw how drawing pressure contours,
isobars, can locate centers of high and low pressure. Winds spin
in a counterclockwise direction and spiral inward around low
pressure. The converging winds cause air to rise, expand, and
cool. If the air is moist and there is sufficient cooling clouds
can form. Pretty much the opposite is true with high pressure
(clockwise winds spiral outward, divergence causes sinking air and
clear skies).
The spacing of the contour lines tells you something about wind
speed. Closely spaced contours, a strong pressure gradient,
create strong winds. Widely spaced contours, a weak pressure
gradient, produce slower winds.
Today we'll see that once the winds start to blow they can affect and
change
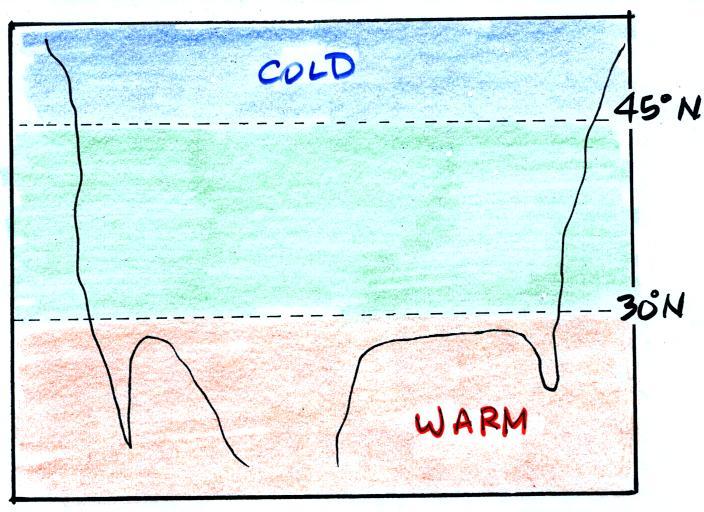
the temperature pattern. The figure below shows the
temperature pattern you would
expect to see if the wind wasn't blowing at all or if the wind was
just blowing straight from west to east. The bands of different
temperature are aligned parallel to the lines of latitude.
Temperature changes from south to north but not from west to
east.
This
picture
gets a
little
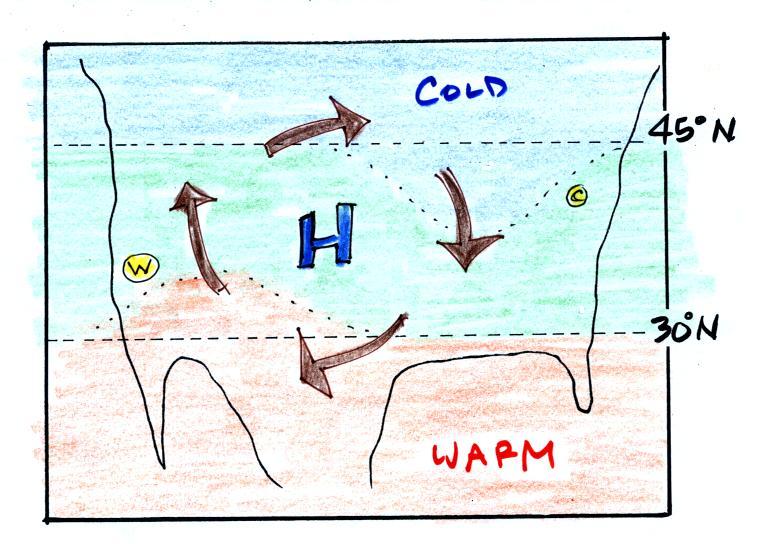
more interesting if you put centers of high or low pressure in the
middle.
In the case of high pressure, the
clockwise spinning winds
move warm air to
the north on
the western
side of the High. The front edge of this northward moving air is
shown with a dotted line (at Pt. W) in the picture above. Cold
air moves toward the south on the eastern
side of the High (another dotted line at Pt. C). The diverging
winds also move the warm and cold
air away from the center of the High. Now you would experience a
change in temperature if you traveled from west to east across the
center of the picture.
The transition from warm to cold along the boundaries (Pts. W and
C) is spread out over a fairly long distance and is gradual. This
is because the winds around high pressure blow outward away from the
center of high pressure. There is also some mixing of the
different temperature air along the boundaries.
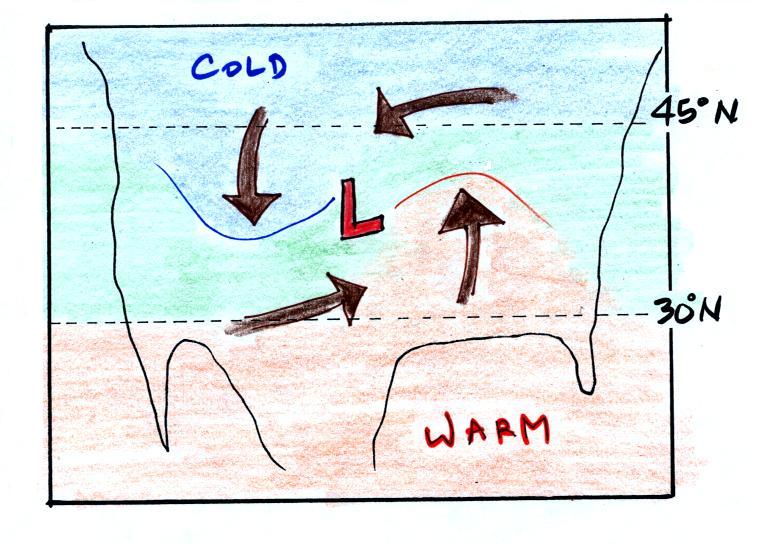
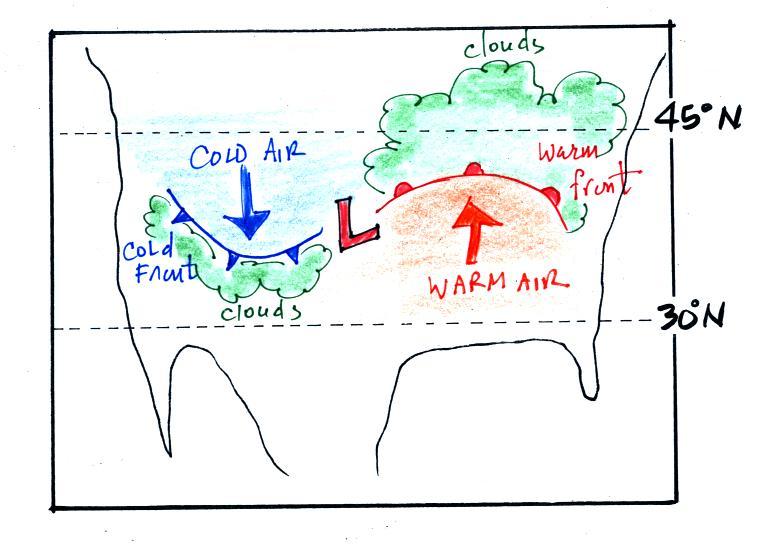
The
converging winds in the case of low pressure will move the air
masses of different temperature in toward the center of low
pressure. The transition zone between different temperature air
gets squeezed and compressed. The change from warm to cold occurs
in a shorter distance and is more abrupt. Solid lines have been
used to delineate the boundaries above. These sharper and more abrupt
boundaries between are called fronts.
A cold front is drawn at the front edge of the southward moving
mass of cold air on the west side of the Low. Cold fronts are
generally drawn in blue on a surface weather map. The small
triangular symbols on the side of the front identify it as a
cold front and show what direction it is moving. The fronts are
like spokes on a wheel. The "spokes" will spin counterclockwise
around the low pressure center (the axle).
A warm front (drawn in red with half circle symbols) is shown on
the
right hand side of the map at front edge of the northward moving mass
of. A warm front is usually drawn in red and has half circles on
one side of the front to identify it and show its direction of motion.
Both types of fronts cause rising air motions. Fronts are
another way of causing air to rise. Rising air expands and
cools. If the air is moist and cools enough, clouds can form.
The storm system
shown in the picture above (the Low together with the fronts) is
referred to
a middle latitude storm or an extratropical cyclone. Extra
tropical means outside the tropics, cyclone means winds spinning
around low pressure (tornadoes are sometimes called cyclones, so are
hurricanes). These storms form at middle latitudes
because that is where air masses coming from the polar regions to the
north and the more tropical regions to the south can collide.
Large
storms that form in the tropics (where this mostly just warm air) are
called tropical cyclones or, in our part of the
world, hurricanes.
We'll be looking in more detail at the structure
of
warm and cold fronts and the weather changes that can occur as they
approach and pass through. We'll also look at how you might go
about locating fronts on a surface weather map.
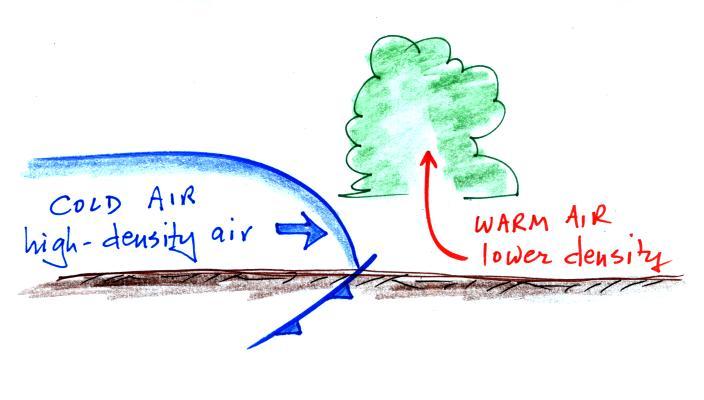
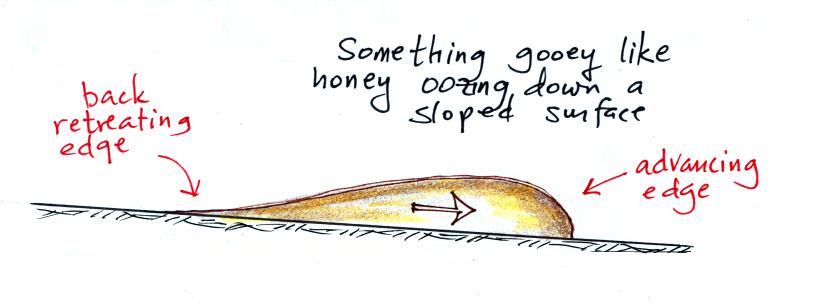
A vertical slice through a cold front is shown below at left. Pay
particular attention to the shape of the advancing edge of the cold air
mass. Friction with the ground causes the front edge to "bunch
up" and gives it the blunt shape it has. You'd see something
similar if you were to pour something thick and gooey on an inclined
surface and watch it roll downhill.
The cold dense air mass behind a
cold front moves into a region occupied by warm air. The warm air
has lower density and will be displaced by the cold air mass. In
some ways its analogous to a big heavy Cadillac plowing into a bunch of
Volkswagens.
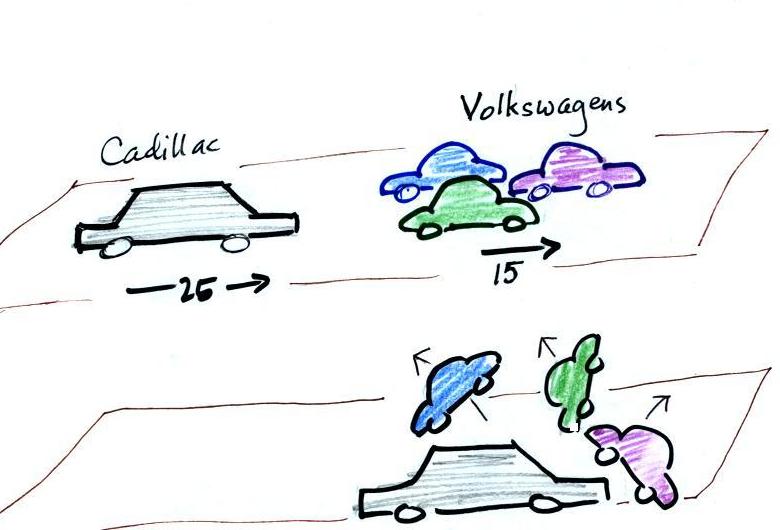
The VWs would be thrown up into the air by the Cadillac.
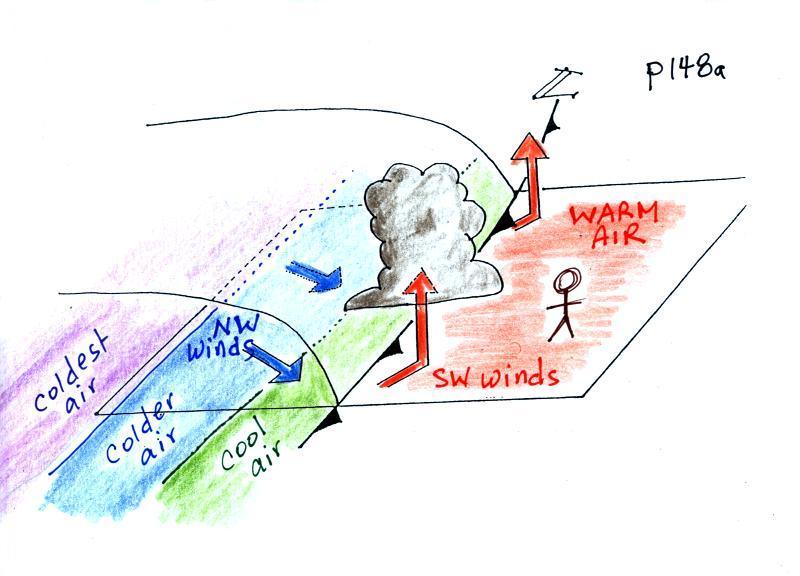
A sort of 3-dimensional crossectional view of a cold
front is shown below (we've jumped to p.
148a in the photocopied ClassNotes)
The person in the figure is positioned ahead of an approaching cold
front. It might be the day before the front actually passes
through.
The warm air mass ahead of the front has just been sitting there and
temperatures are pretty uniform throughout. The air behind the
front might have originated in Canada. It might have started out
very cold but as it travels to a place like Arizona it can change
(warm) considerably. The air right behind the front will have
traveled
the furthest and warmed the most. That's the reason for the
cool, cold, and colder temperature gradient behind the front.
Here are some of the specific weather changes that might precede and
follow a cold front
Weather
variable
|
Behind
|
Passing
|
Ahead
|
Temperature
|
cool, cold, colder*
|
|
warm
|
Dew Point
|
usually much drier
|
|
may be moist (though that
is often
not the case here in the desert southwest)
|
Winds
|
northwest
|
gusty winds (dusty)
|
from the southwest
|
Clouds,
Weather
|
clearing
|
rain clouds, thunderstorms
in
narrow band along the front
(if the warm air mass is moist)
|
might see some high clouds
|
Pressure
|
rising
|
reaches a minimum
|
falling
|
*
the
coldest
air
might
follow
passage
of
a cold front by a day
or two. Nighttime temperatures often plummet in the cold dry air
behind a cold front.
A temperature drop is probably the most obvious change associated with
a cold front. Here is southern Arizona, gusty winds and a wind
shift are also often noticeable when a cold front passes.
The pressure changes that precede and follow a cold front are not
something we would observe or feel but are very useful when trying to
locate a front on a weather map.
We watched a couple of short video segments at this point.
The first was a time lapse movie of an
actual cold front that passed through Tucson on Easter Sunday, April 4,
in 1999. It actually snowed for a short time during the passage
of the cold front (hard to imagine cold weather and snow on a day as
warm and nice as it is today). Click here
to see the cold front video (it may take a minute or two to transfer
the data from the server computer in the Atmospheric Sciences Dept., be
patient). Remember the video shows a time
lapse movie of the frontal passage. The front seems to race
through Tucson in the video, it wasn't moving as fast as the video
might lead you to believe. Cold fronts typically move 15 to 25
MPH.
The 2nd video was another cold
front passage that occurred last spring on February 12.
We'll learn a little bit about warm fronts and Monday and then
look at how meterologists go about locating fronts on surface maps.
And finally something completely different. The Fall Equinox
is tomorrow. We can't let a big event like
that go unnoticed.
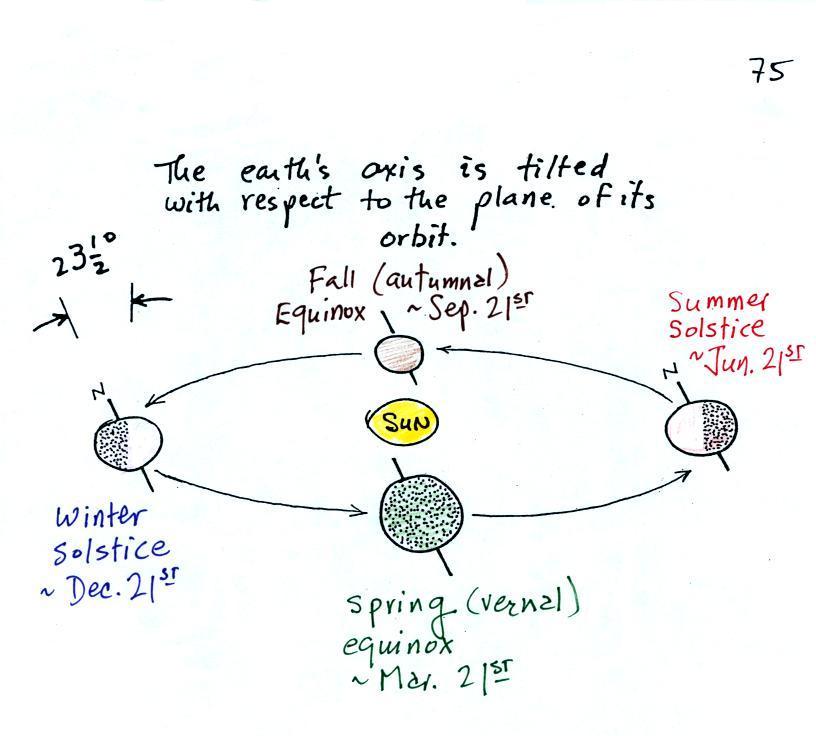
The figure above shows the earth
orbiting the
sun.
On
or
around Dec. 21st, the winter solstice, the north pole is tilted away
from the sun. Note that a small portion of the earth near the N.
Pole (north of the Arctic Circle) spends 24 hours in darkness.
Days are less than 12 hours long in the northern
hemisphere and the sun is low in the sky. Both factors reduce the
amount of sunlight energy reaching the ground. That's why it's
cold and wintry.
On June 21st, the
summer solstice, the north pole is tilted toward the sun. Now
there are 24 hours of sunlight north of the Arctic Circle. Days
are more than 12 hours long in the northern hemisphere and the sun is
high in the sky at noon. A lot more sunlight energy reaches the
ground; that's why it is summer.
The equinoxes are a time of transition. On the equinoxes,
the N. Pole still tilted just not toward or away from the sun.
The line
separating day and night passes through the pole and the days
and nights are each about 12 hours long everywhere on earth (except
perhaps
at
the poles).
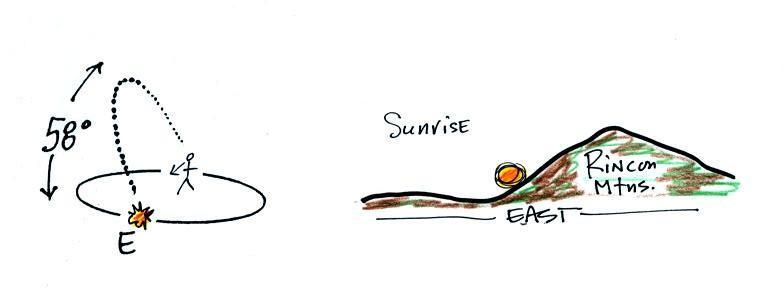
The drawing below shows you what you would see at sunrise (about
6:30 am) on the Spring Equinox here in Tucson (the same would happen on
the Fall Equinox). The sun rises exactly in the east
on the equinoxes. The rest of the year it is a little to the
north or south of east.
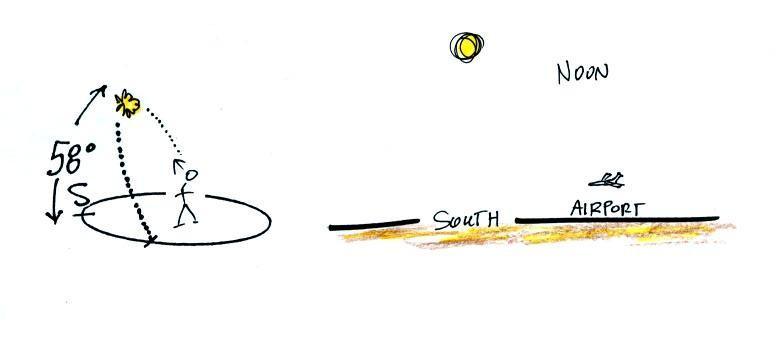
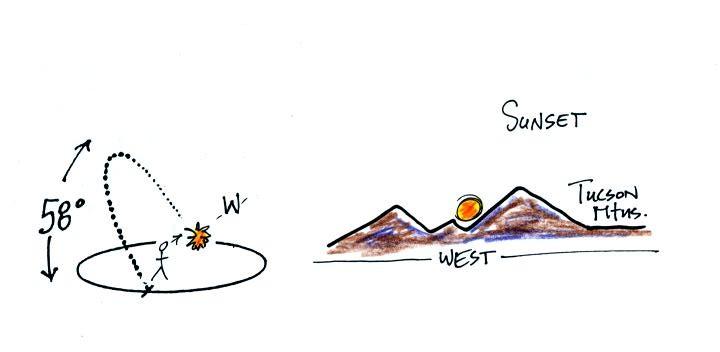
At noon you
would need to look south to see the sun.
The sun reaches its
highest point in the sky at noon. On the equinoxes in Tucson
that's almost 60 degrees. The sun is lower in the sky (34.5
degrees
above the horizon) on the winter solstice. That together with the
fact that the days are shorter means much less sunlight energy reaches
the ground. In the summer the days are longer and the sun gets
much higher
in the sky at noon (81.5
degrees
above
the
horizon,
nearly
overhead). Much more sunlight energy reaches the ground and it is
much warmer.
The sun passes directly overhead at the equator at noon on the
equinoxes.
The
sun
sets exactly in the west on the equinoxes at about 6:30 pm in
Tucson.
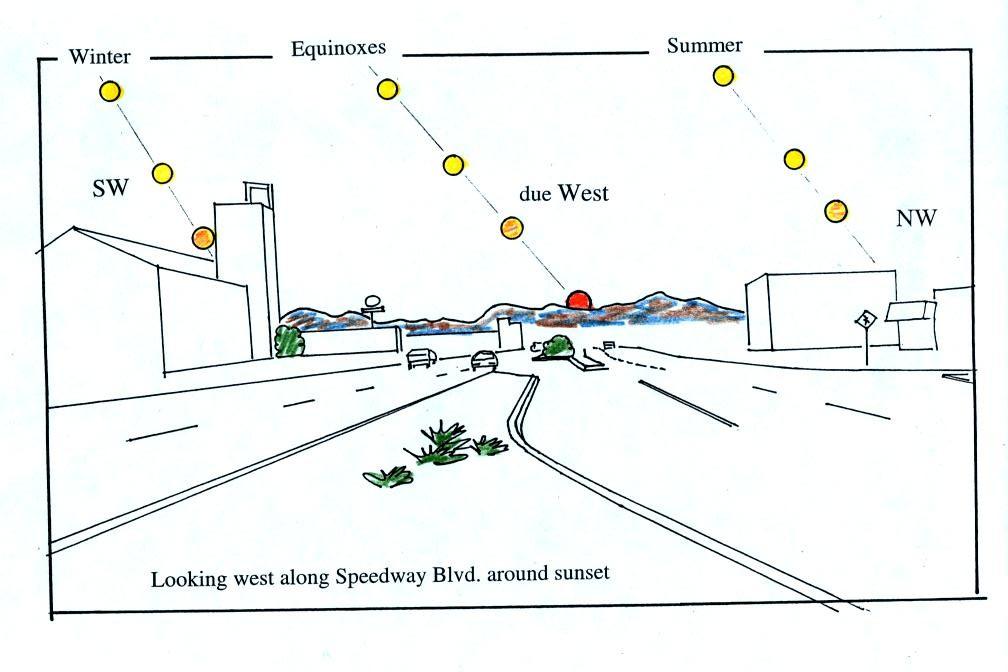
This is the 2 pm class.
Most of you are more likely
(perhaps) to see the sun set than see the
sun
rise. The figure below shows you about what you would see if you
looked west on Speedway (from Treat Ave.) at sunset. In the
winter the sun will set south of west, in the summer north of west
(probably further south and north than shown here). On the
equinoxes the sun sets exactly in the west. This is something you
should check out for yourself this week before the sun moves noticeably
to the north of due west.
Several years ago I
positioned myself in the median near the
intersecton of Treat and Speedway and pointed my camera west. I
took a multiple exposure photograph of the sun over a 2 or 3 hour
period
that ended at sunset. I'll bring the slide photograph to
class one of these days.
Something else to note in this figure and something I didn't
mention in class. Note how the sun is changing
color. It changes from a bright yellow white to almost red by the
time it sets.. This is due to scattering of sunlight by
air. The shorter wavelengths (violet, blue, green) are scattered
more readily than the longer wavelengths. At sunset the rays of
sunlight take a much longer slanted path through the atmosphere and
most of the shorter wavelengths are scattered and removed from the beam
of sunlight. All that's left in the beam of light that reaches
your eyes are the longer wavelengths: yellow, orange, and red.
If you aren't
careful, you can get yourself seriously
injured,
even
killed,
on
or around the equinoxes. Here's
an article that appeared in the Arizona Daily Star at the time of the
equinox last fall (Thu., Sep. 22).
I forgot to
mention the following picture in class.

December 21, the
summer solstice, is the shortest day
of the
year (about 10 hours of daylight in Tucson). The days have slowly
been getting longer since then. The rate of change is greatest at the
time of the equinox.
This will continue up until June 21,
the summer solstice, when there will be about 14 hours of
daylight. After that the days will start to shorten again as we
make
our way back to
the winter solstice.
There was
a very interesting coicidence last fall. We were
covering some of this same material in class on Friday Sep. 23.
There
were a few parents in class because it was Parent's
Weekend. I showed these same pictures on that
afternoon. One of the parents came up to the front
after class and mentioned having seeing the sun right at the end of
77th St.
in New York City around this time of year. That got me thinking
that a picture of sunset at the end of one of the long streets with all
the tall buildings might be spectacular.
When I started looking however I found that the major streets in
Manhattan aren't oriented EW and NS. You can see this on a Google
map
of
Manhattan. 77th St. is oriented in more of a NW-SE
direction. So the sun doesn't shine straight down 77th St.
at sunrise and sunset on the equinoxes. I was pretty disappointed
but then I stumbled on the this
Manhattanhenge
map which shows the direction of sunset (the left, west,
side of the map) and sunrise (the right, east, side of the map) at
various times of the year.
If you remember that as you move past the Spring Equinox toward
summer
sunrise move north of east and sunset is north of west. On May 31
the sun has moved far enough north that it does set right at the west
end of 77th St. Sunset continues to move north up until the
summer solstice on June 21. Then the sunset starts to move back
south. You can again see the sunset at the west end of 77th St.
on July 12 and 13. An
article with several Manhattanhenge
photographs from the May 31 event appeared in a story on
the Business Insider webpage. That would certainly
make a worthwhile field trip in Atmo 170A1 if the semester went that
long. The "henge" part of the
name comes from Stonehenge
where the rising and setting sun aligns with
stones on the solstices.
Manhattanhenge is a little confusing and hard to figure out.
But do look at the photographs with the idea that you can see something
similar here in Tucson on the equinoxes (minus all the tall buildings).
You can also see the sunrise at the east end of 77th St. But
sunrise has to be in the southeast. This takes place on Dec. 5
and Jan. 8, just before and just after the winter solstice.