There's a lot going on in this picture, we'll examine it step by
step.
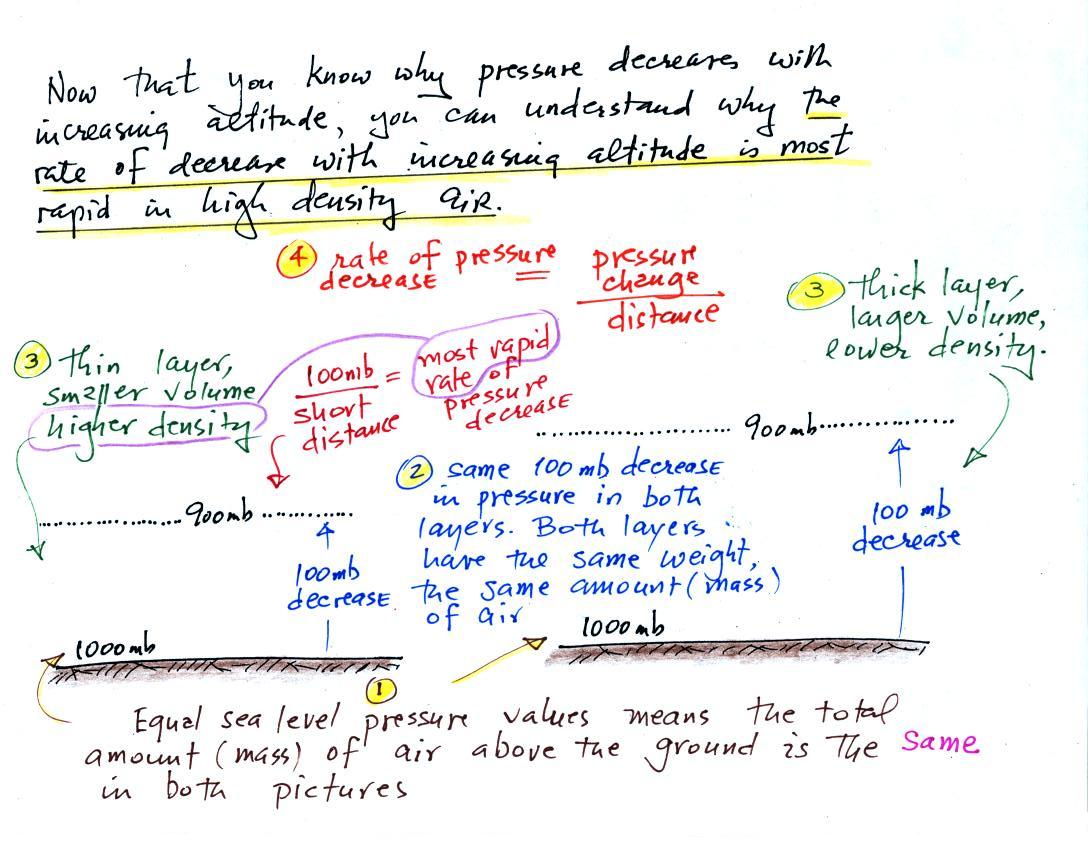
1.The sea level pressure is the same, 1000 mb, in both pictures.
Since pressure is determined by the weight of the air overhead, the
weight of the air overhead in the left picture is the same as in the
right picture. The amount (mass) of air above sea level in both
pictures is the same.
2. There is a 100 mb drop in pressure in both air
layers. Pressure has decreased because air that was overhead (the
air between the ground the level of the dotted line) is now
underneath. Because the pressure change is the same in both
pictures the weight of the air layers are the same. The thin
layer at left has the same weight as the thicker layer at right.
Both layers contain the same amount (mass) of air.
3. Both layers contain the same amount (mass) of air.
The air in the layer at left is thinner. The air is squeezed into
a smaller volume. The air in the layer at left is denser than the
air in the layer at right.
4. To determine the rate of pressure decrease
you divide the pressure change (100 mb for both layers) by the distance
over which that change occurs. The 100 mb change takes place in a
shorter distance in the layer at left than in the layer at right.
The left layer has the highest rate of pressure decrease with
increasing altitude.
So both the most rapid rate of pressure decrease with altitude and
the densest air are found in Layer A.
The fact that the rate of pressure decrease with increasing
altitude depends on air density is a fairly subtle but important
concept. This concept
will come up 2 or 3 more times later in the semester. For
example, we will need this concept to explain why hurricanes can
intensify and
get as
strong as they do.