Monday Oct. 15, 2012
click here to
download today's notes in a more printer friendly format
"Sometimes"
from
the
Punch
Brothers
was the first song you heard today (here's a live
version). After that you heard part of "Movement and Location".
The In-class Optional Assignment from last Friday was returned in
class today. Everyone earned at least 0.1 extra credit
points. Only a handful of students received full credit (0.2 pts
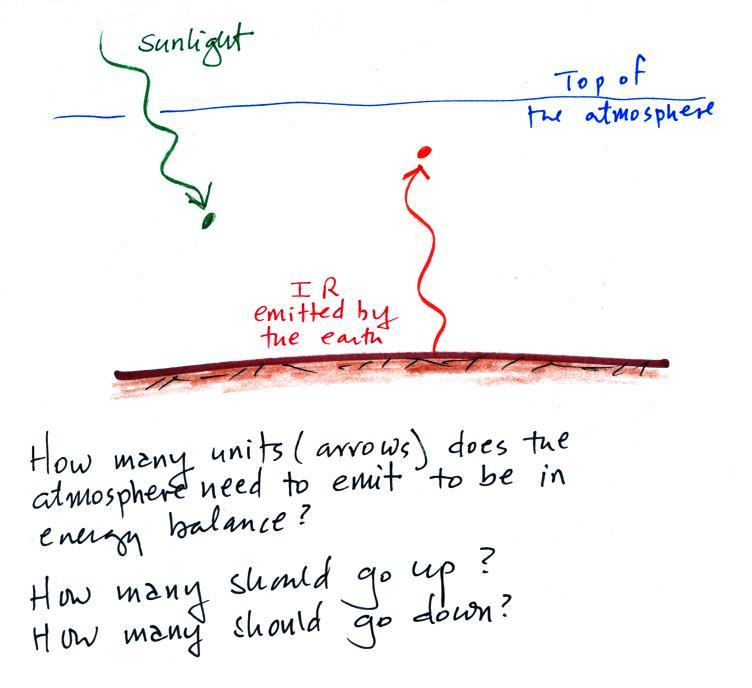
of extra credit). You were supposed to bring the picture shown
below at left into energy balance.
We now have a preceptor for this class, Nicole Venn. She has
taken the class and already served once as a Preceptor. You'll
find contact information on the class home page.
The Scientific Paper
option is now open for students that don't want to do either an
Experiment or Book report. The Scientific Paper reports are due
by Monday, Nov. 5.
Two of the three 1S1P
Assignment #2
reports are due Wednesday this week. The 3rd topic isn't due
until next Wednesday.
Hurricane Paul is moving northward along the coast of Baja
California. The clouds in the sky today are from that
hurricane. There is a chance that it might bring some moisture
and showers to S. Arizona later this week. You can get the latest
information from the National Hurricane Center (www.nhc.noaa.gov).
And finally, something
that
I
didn't mention in class. I am working hard to
finish grading the Experiment #2 reports so that I can put all the
grades into my computer and printout midterm grade summaries. I
am hoping to have them ready to handout on Friday this week.
Next we used our simplified representation of the greenhouse
effect to understand the effects of clouds on daytime high and
nighttime low temperatures. The following can be found on pps.
72a & 72b in the ClassNotes (I've rearranged things slightly to try
to make it clearer)
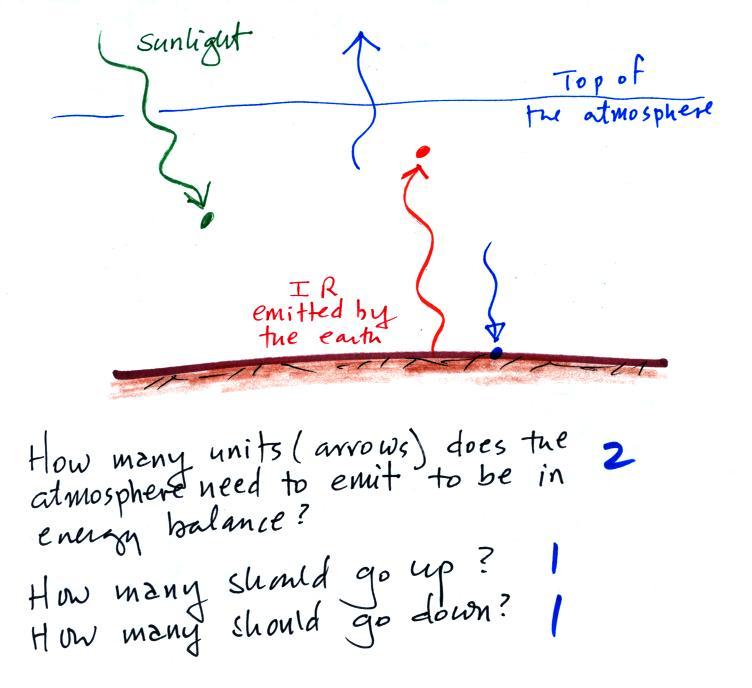
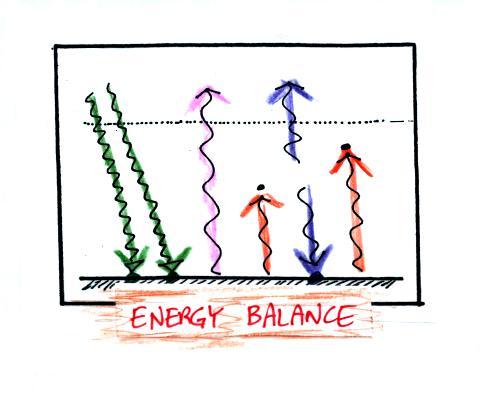
Here's the simplified picture of
radiative equilibrium again (you're probably getting pretty tired of
seeing this). You should be able to say something
about every arrow in the picture. The
two pictures below show what happens at night
when you remove
the
two green rays of incoming sunlight.
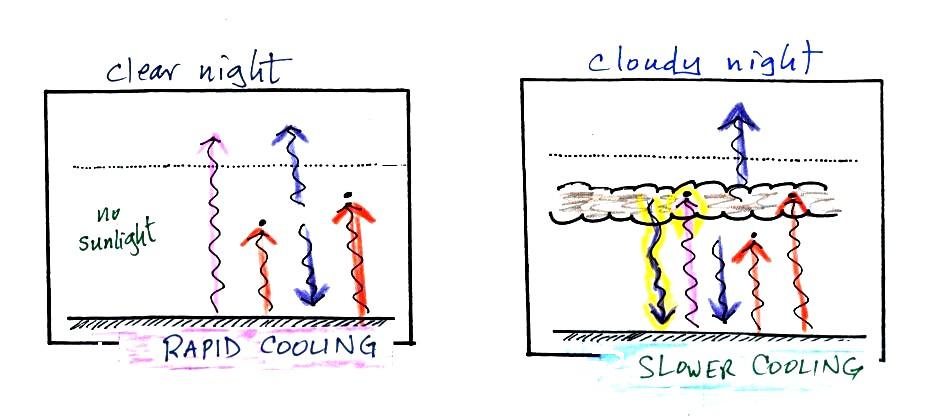
The picture on the left shows a
clear night. The ground is losing
3
arrows of energy and getting one back from the atmosphere. That's
a
net loss of 2 arrows. The ground cools rapidly and gets cold
during
the night.
A cloudy night is shown at right. Notice the effect of the
clouds.
Clouds are good absorbers
of infrared
radiation. If we could see IR light,
clouds would appear black, very different from what we are used
to (because clouds also emit IR light, if we could see IR light the
clouds might also
glow). Now none of
the IR radiation emitted by the ground passes through the atmosphere
into space. It is all absorbed either by greenhouse gases or by
the
clouds. Because the clouds and atmosphere are now absorbing 3
units of
radiation they must emit 3 units: 1 goes upward into space, the other 2
downward to the ground. There is now a net loss at the ground of
only
1 arrow.
The ground won't cool as quickly and won't get as cold on a cloudy
night as it does on a clear night. That makes for somewhat warmer
early
morning bicycle rides this time of the year.
The next two figures compare clear and cloudy days.
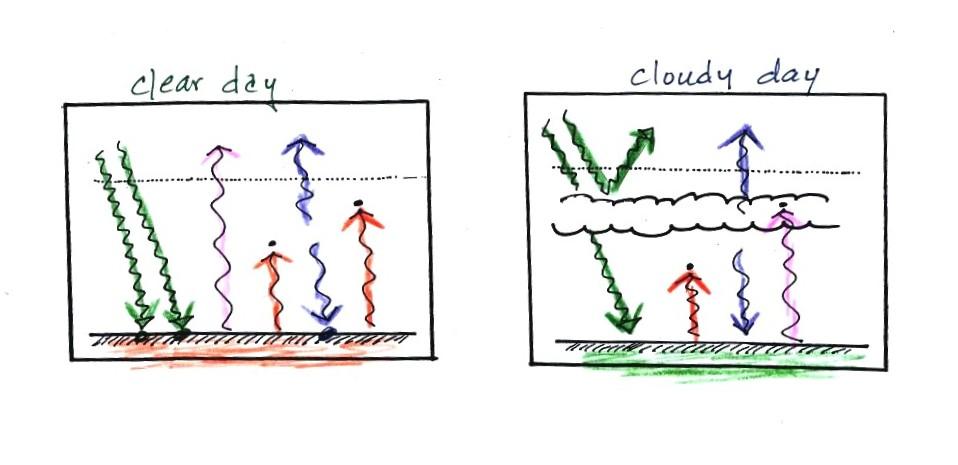
Clouds are good reflectors
of visible
light (we see visible light and clouds appear white). The effect
of this is to
reduce the amount of sunlight energy reaching the ground in the right
picture. With less sunlight being absorbed at the ground, the
ground
doesn't need to get as warm to be in energy balance.
It is generally cooler during the day on a cloudy day than on a
clear
day.
Clouds raise the nighttime minimum temperature and lower the
daytime
maximum temperature. Here are some typical daytime high and
nighttime
low temperature values on clear and cloudy days for this time of the
year.
We'll use
our simplified representation of radiative equilibrium to understand
enhancement of the greenhouse effect and global warming.
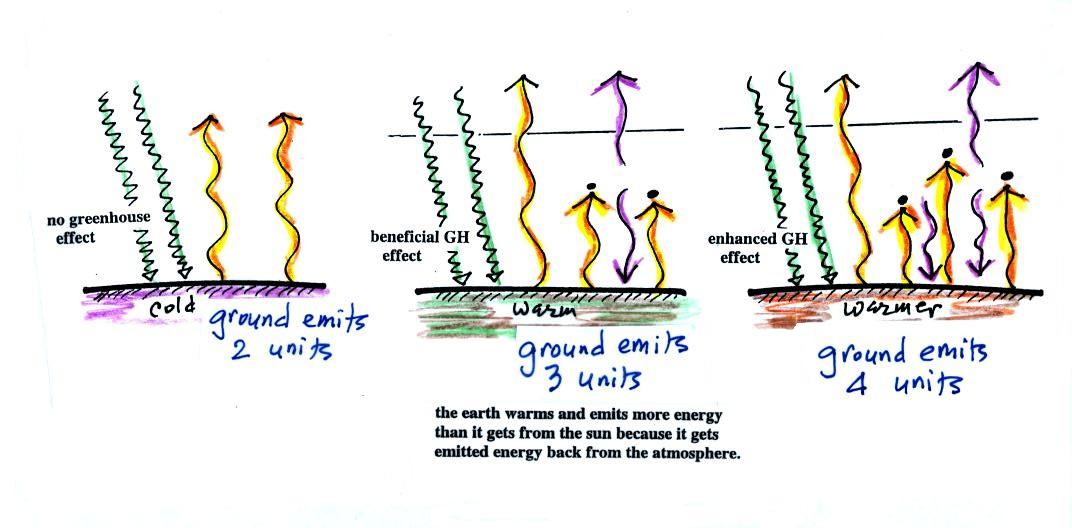
The figure (p. 72c in the
photocopied Class Notes) on the
left
shows
energy balance on the earth
without
an atmosphere (or with an atmosphere that doesn't contain greenhouse
gases). The ground achieves energy balance by emitting only 2
units of energy to balance out what it is getting from the sun.
The ground wouldn't need to be
very warm to do this.
If you add an atmosphere and greenhouse gases, the atmosphere will
begin to absorb some of the outgoing IR radiation. The atmosphere
will also begin to emit IR radiation, upward into space and downard
toward the ground. After a period of adjustment you end up with a
new energy balance. The ground is warmer and is now emitting 3
units of energy even though it is only getting 2 units from the
sun. It can do this because it gets a unit of energy from the
atmosphere. This is what I refer to as the beneficial greenhouse
effect. It makes the earth more habitable (average surface
temperature of 60 F versus about 0 F without a greenhouse effect).
In the right figure the concentration of greenhouse gases has
increased
even more (due to human activities). The earth would find a new
energy balance. In this case the ground would be warmer and would
be emitting 4 units of energy, but still only getting 2 units from the
sun. With more greenhouse gases, the atmosphere is now able to
absorb 3
units of the IR emitted by the ground. The atmosphere sends 2
back to the ground and 1 up into space.
The next figure shows a common misconception about the cause of
global
warming.
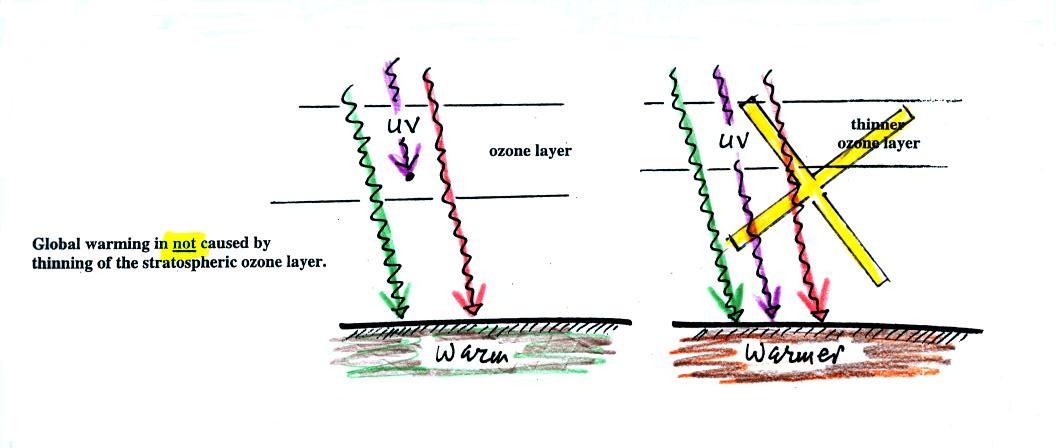
Many people know that sunlight
contains UV light and that
the ozone
absorbs much of this dangerous type of high energy radiation.
People also know that release of chemicals such as CFCs are destroying
stratospheric ozone and letting some of this UV light reach the
ground. That is all
correct.
They then conclude that it is
this additional UV energy reaching the ground that is causing the globe
to warm. This
is not correct. There isn't much (about 7%) UV light in
sunlight in
the
first place and the small amount of additional UV light reaching the
ground won't be enough to cause global warming. It will cause
cataracts and skin cancer and those kinds of problems but not global
warming.
If all of the UV light in sunlight were to reach the ground it
probably would cause some warming. But it probably wouldn't
matter because some of the shortest wavelength and most energetic forms
of UV light would probably kill us and most other forms of life on
earth.
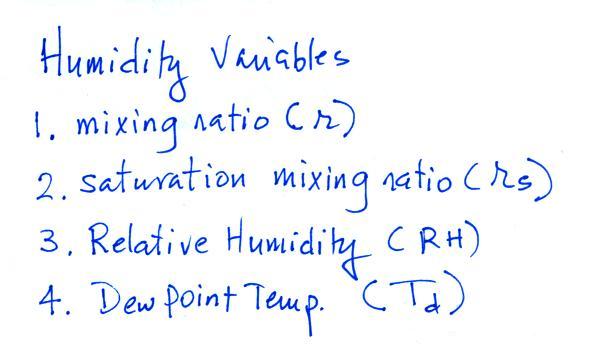
We spent the remainder of the class period on an introduction to
the next major topic we will be covering: humidity
(moisture in the
air). This topic and the terms that we will be
learning and using can be confusing. That's the reason for this
introduction. We will be mainly be
interested in 4 variables:
Our first job will
be to figure out what their "jobs" are and what can cause them to
change value. What follows is a pretty detailed explanation of
what will initially be confusing.
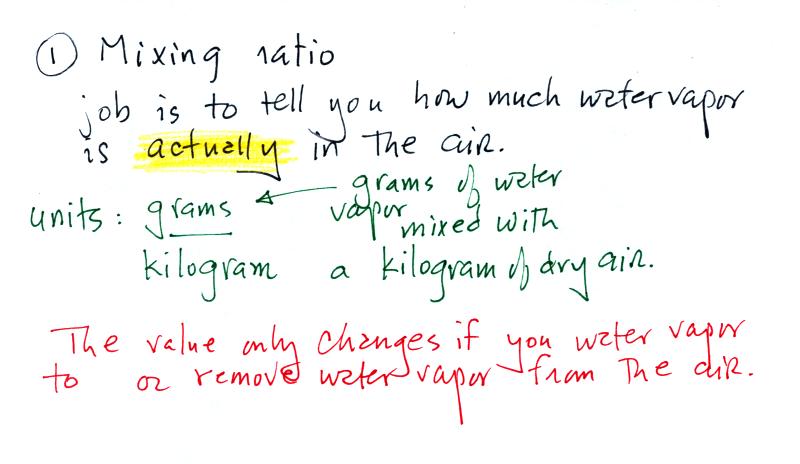
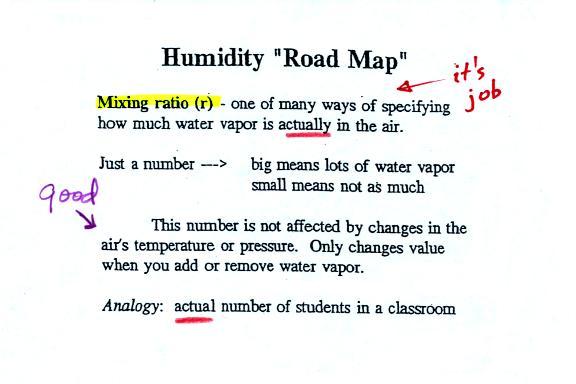
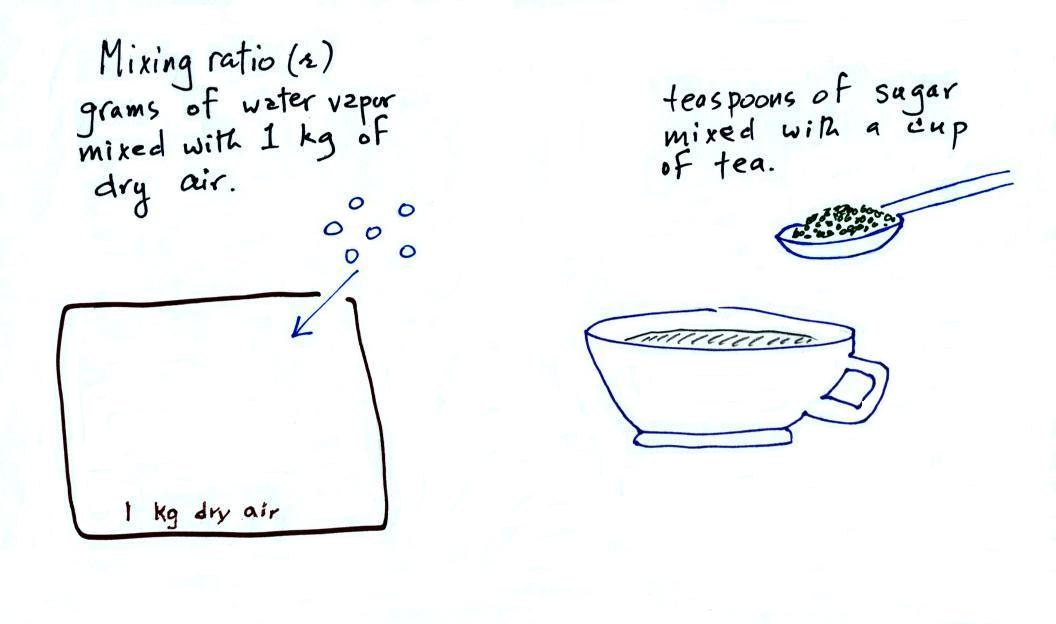
Mixing ratio
tells you how much water vapor is actually
in
the
air. You can think of it as just a number: when the value is
large there's more water vapor in the air than when the value is
small. But it's not a difficult concept to grasp. Mixing
ratio has units of grams of water vapor per kilogram
of dry air (the amount of water vapor in grams mixed with a
kilogram
of dry air). It's basically the same
idea as teaspoons of
sugar
mixed in a cup of tea.
The value of the mixing ratio won't
change unless you add
water
vapor to or remove water vapor from the air. Warming the air
won't
change the mixing ratio. Cooling the air won't change the mixing
ratio
(unless
the air is
cooled below its dew point temperature and water
vapor starts to condense). Since the mixing ratio's job is to
tell you how much water vapor is in the air, you don't want it to
change unless water vapor is actually added to or removed from the air.
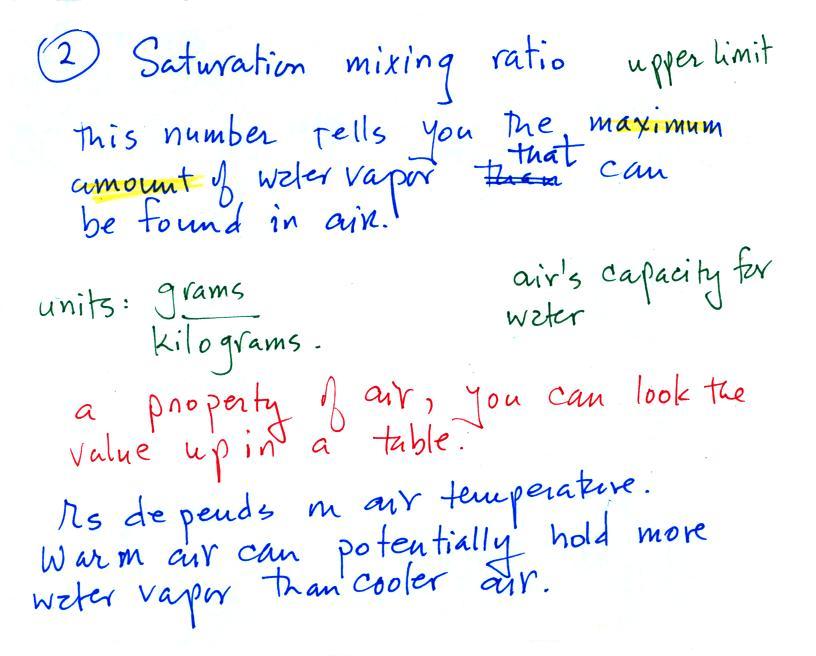
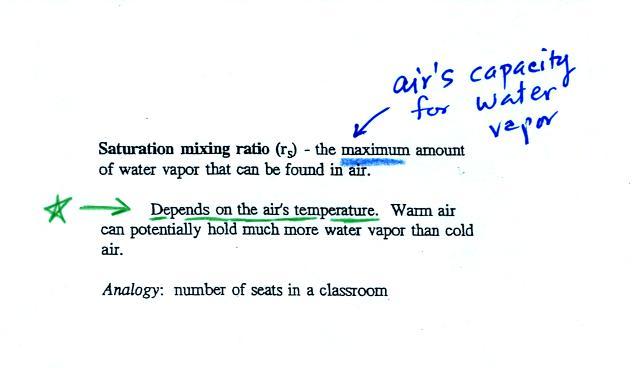
Saturation
mixing ratio is just an upper limit
to how much
water vapor
can be found in air, the air's capacity
for water
vapor. It's a
property of air and depends on the air's temperature; warm
air can potentially hold
more
water
vapor
than
cold
air. It doesn't say anything about how much water
vapor is actually in the air (that's the mixing ratio's
job).
This
variable
has
the
same
units: grams of water vapor per kilogram of
dry air. Saturation mixing ratio values for different air
temperatures are listed and graphed on p. 86 in the photocopied class
notes.

The sugar
dissolved in tea analogy is still helpful. Just as is the case
with water vapor in air, there's a limit to
how much sugar can be dissolved in a cup of hot
water. You can dissolve more sugar in hot water
than in cold
water.
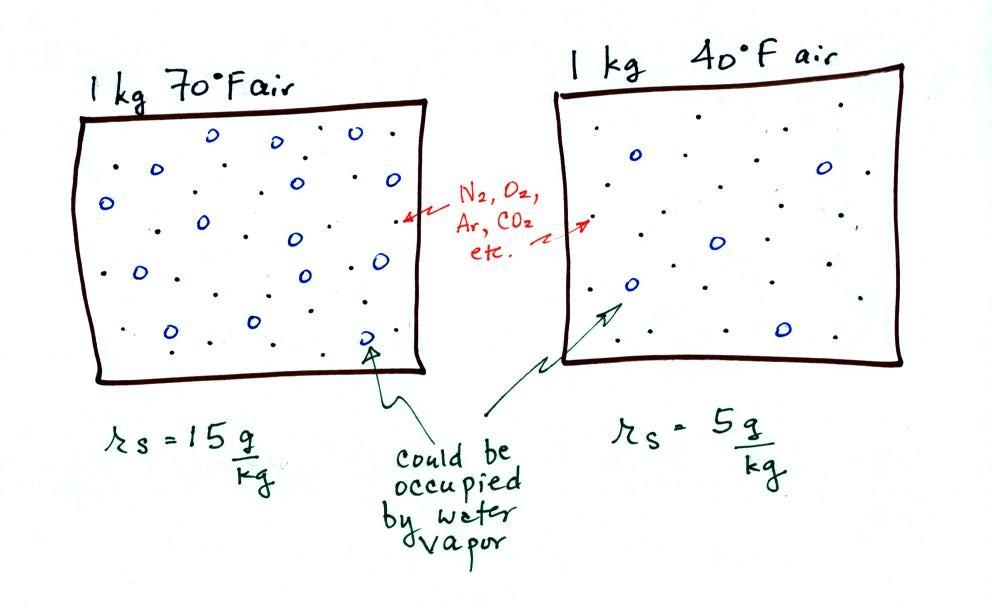
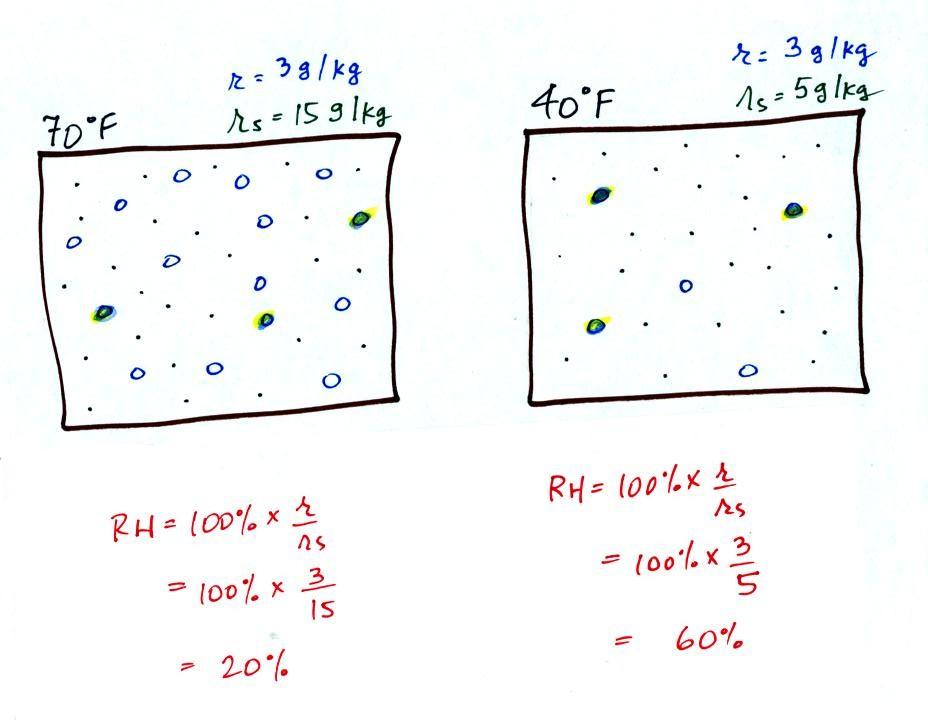
The dependence of saturation mixing ratio on air temperature is
illustrated below:
The small
specks represent all of the gases in
air except
for the water
vapor. Each of the open circles represents 1 gram of water vapor
that the air could
potentially hold. There are 15 open circles
drawn in the 1
kg of 70 F air; each 1 kg of 70 F air could hold up to 15 grams of
water vapor. The 40 F air only has 5 open circles;
this cooler
air can only hold up to 5 grams of water vapor per kilogram of dry
air. The numbers 15 and 5 came from the table on p. 86.
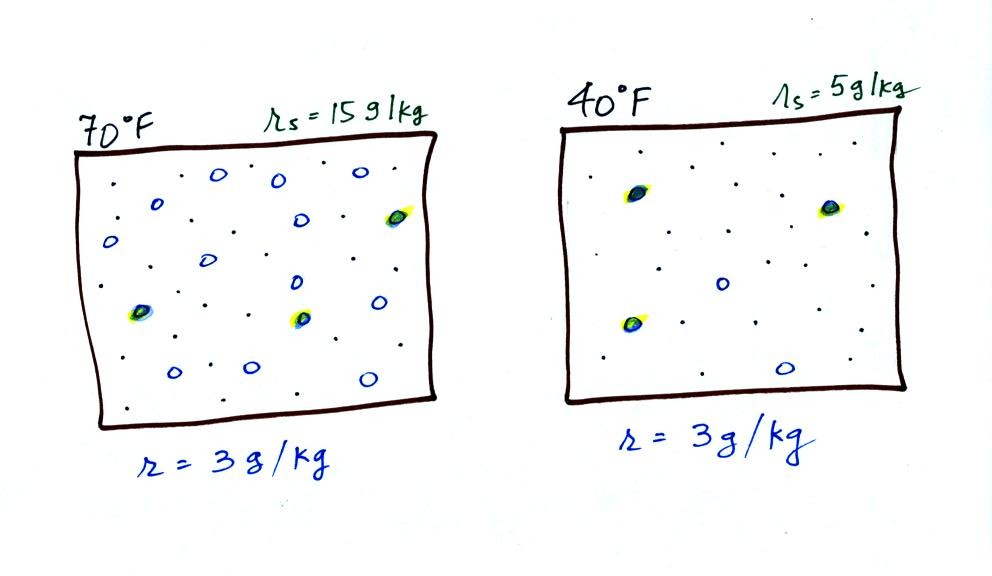
Now we have gone and actually put some water
vapor
into the
volumes of
70 F and 40 F air (the open circles are colored in). The same
amount, 3 grams of water vapor, has
been added to each
volume of air. The mixing ratio, r, is 3 g/kg in both cases.
After looking at the figure above you might start to guess at what
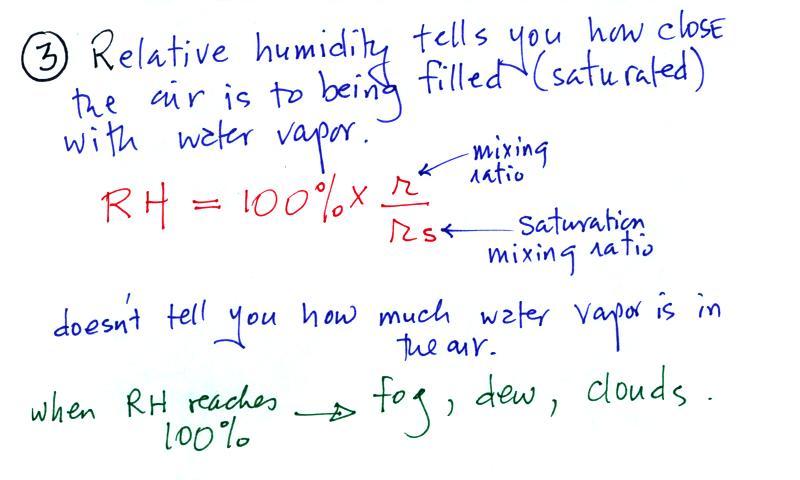
relative humidity might mean.
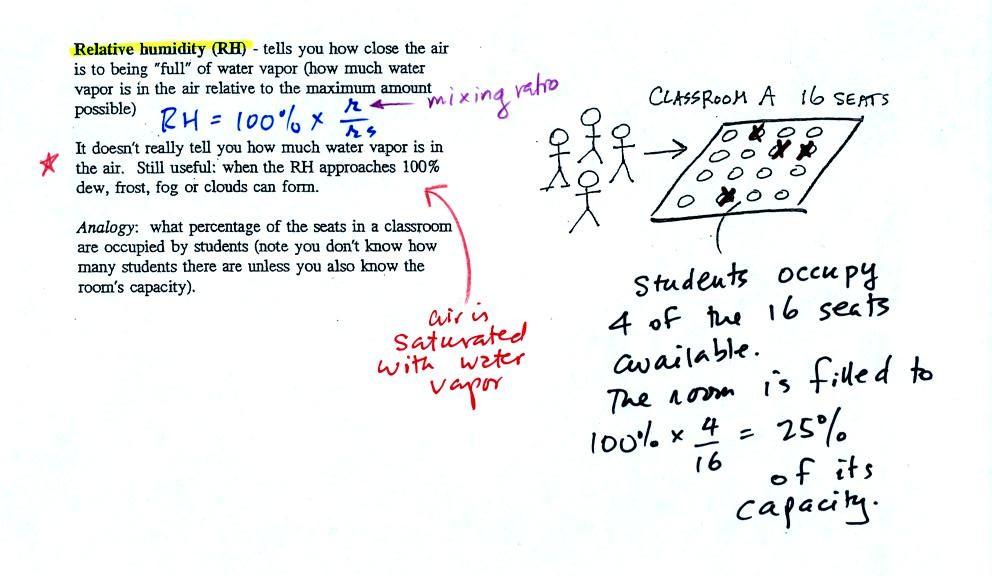
The relative
humidity is the variable most people are familiar with. It tells
you
how "full" the air is with water
vapor, how close it is to being
filled to capacity with water vapor.
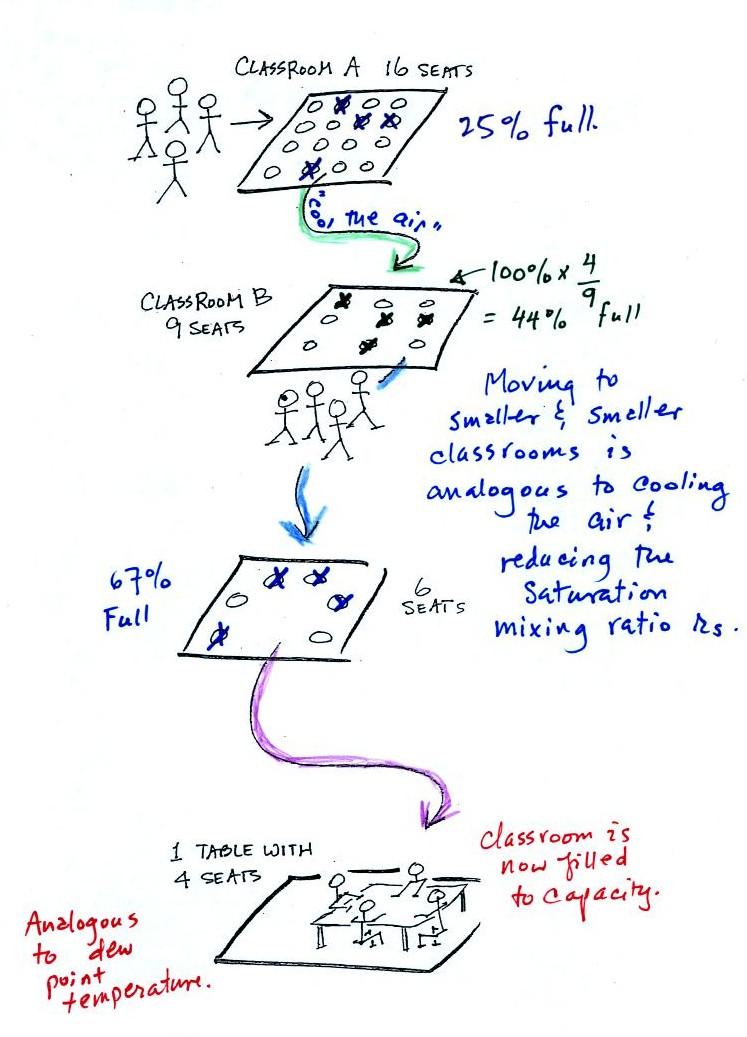
In the analogy (sketched on the right hand side of p.
83 in
the photocopied notes) 4 students wander into Classroom A which has 16
empty
seats. Classroom A is filled to 25% of its capacity.
You
can
think
of
4,
the
actual
number
of
students,
as
being
analogous
to
the
mixing
ratio.
The
classroom
capacity
is
analogous
to
the
saturation mixing ratio. The percentage occupancy is analogous to
the relative humidity.
The figure below goes back to the
volumes (1 kg each) of 70 F and 40 F air that could potentially hold 15
grams or 5 grams of water vapor.
Both the 70 F and the 40 F
air each
contain 3 grams of water vapor. The 70 F air is only filled to
20% of capacity (3 of the 15 open circles is colored in) because
this warm air's capacity, the saturation mixing ratio, is large.
The RH in the
40 F is 60% even though it has the same actual amount of water vapor
because the 40 F air can't hold as
much water vapor and is closer
to
being saturated.
Something important to note: RH
doesn't really tell you how much water
vapor is
actually in the air. The two volumes of air above contain
the
same amount of water vapor (3 grams per kilogram) but have very
different
relative humidities. You could just as easily have two volumes of
air with the same relative humidities but different actual amounts of
water vapor.
|
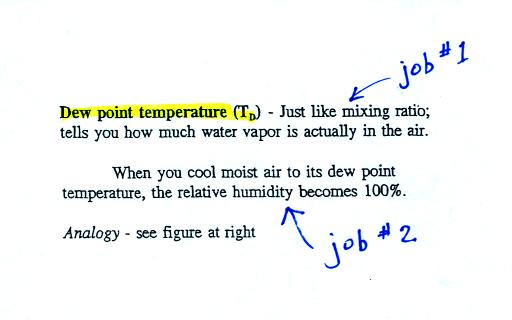 |
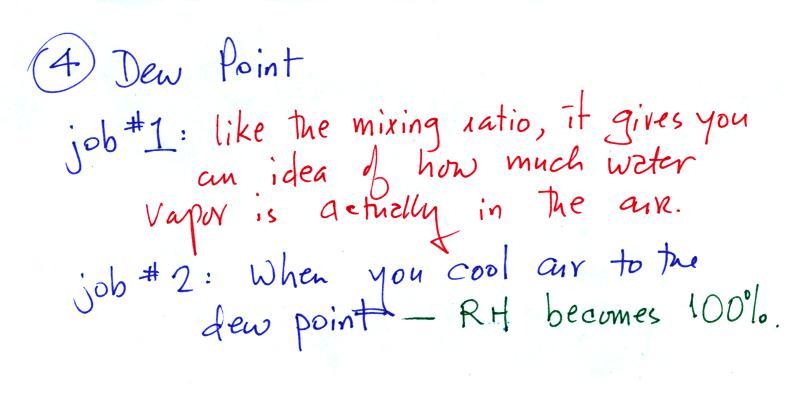
The dew point temperature has two jobs. First it gives
you an
idea of
the actual amount of water vapor in the air. In this
respect it
is just like the mixing ratio. If the dew point temperature is
low the air doesn't contain much water vapor. If it is high the
air contains more water vapor.
Second the dew point tells you how
much you must cool the air in order
to cause the RH to increase to 100% (at which point a cloud, or
dew or
frost, or fog would form).
We ran out of time at this point, but I'm going to include a few
more figures to finish this introduction. We'll come back and
quickly review all of this again on Wednesday.
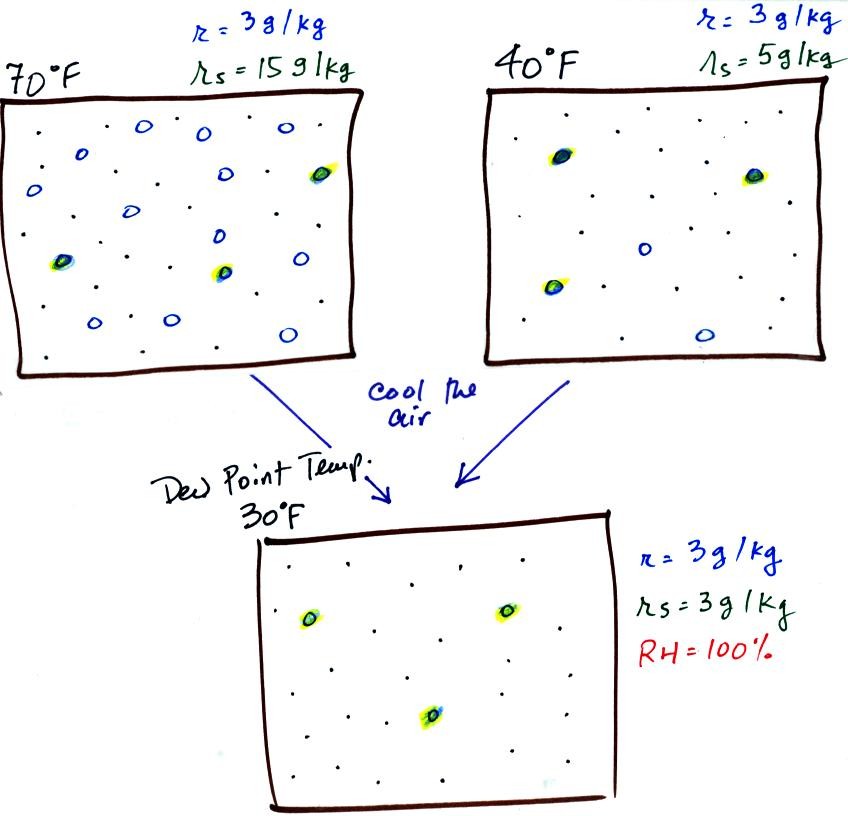
If we cool the 70 F air or the 40 F air to 30 F we would
find that the
saturation mixing ratio would decrease to 3 grams/kilogram. Since
the air actually contains 3 g/kg, the RH of the 30 F air would become
100%. The 30 F air would be saturated, it would be filled to
capacity with water vapor. 30 F is the dew point temperature for
70 F air that contains 3 grams of water vapor per kilogram of dry
air. It is also the dew point temperature for 40 F air that
contains 3 grams of water vapor per kilogram of dry air.Because
both
volumes
of
air
had
the
same
amount
of
water
vapor,
they
both
also
have
the
same
dew
point
temperature.
Now back to the
student/classroom analogy
The 4 students
move into classrooms of smaller and smaller capacity. The
decreasing capacity of the classrooms is analogous to the
decrease in saturation mixing ratio that occurs when you cool
air. Eventually the students move into a classroom that they just
fill to capacity.
This is analogous to cooling the air to the dew point.