![]()
![]()
![]()
![]()
The plots of global temperature changes prior to 1860 (i.e., before the period of instrumental records) provided in the previous lecture pages and in an in-class handout should not be interpreted as a literal and exact reconstruction of global average temperature changes. There is a great deal of difficulty and uncertainty in trying to reconstruct global average temperature changes based on proxy data. One thing we can say with some certainty is that global average temperatures have fluctuated all throughout Earth's history, including the last 2000 years. Prior to 1900, we can safely say that the changes were not caused by anthropogenic additions of greenhouse gases, but were natural fluctuations.
The plots provided to you are only one estimation for global average temperature change and do not give you any indication about the uncertainty. Other research groups have come up with different reconstructions based on their interpretation of available proxy evidence for global average temperature changes. The figure below gives some indication of the unceratainty as it shows 10 different published global temperature reconstructions for the last 2,000 years (note that most of the reconstructions shown only go back about 1,000 years). The point here is that there is not one single correct reconstruction.
![[Temperatures of the Last 2,000 years]](2000_Year_Temperature_Comparison.png)
|
One of the most controversial (and often referenced) reconstructions was first released by Michael Mann and co-authors in 1998 (shown below). This particular reconstruction has been labeled the "Hockey stick" because of the hockey stick shape of the trend lines: gradual cooling from 1000 - 1900 AD, followed by a sharp warming after 1900. This reconstruction turns the medieval warm period and little ice age in non-events globally. (NOTE: based on written historical evidence, we can be fairly certain that these periods were relatively warm and cold throught much of Europe. Mann's study indicates that global average temperature did not behave like that of Europe.)
|
| "Hockey stick" reconstruction of global average temperature changes over 1000 years (ending in 1998). Reconstruction performed using proxy data before 1900 and instrumental data after 1900. Yellow and red shading show author's estimation of uncertainty in the reconstruction. |
It is difficult to decide which, if any, of the reconstructions of global mean temperature is an accurate reflection of temperature fluctuations during the last 1000 years. However, it is likely that such reconstructions, accurate or not, will play a significant role in the ongoing discussions of global climate change and global warming.
If you "believe" the temperature reconstruction presented in the in-class handout, then global average temperature during the medieval warm period was nearly the same as it is today. This may lead some to conclude that the present warm conditions are not extraordinary when viewed in the context of the last 1000 years. In other words there are recent natural climate fluctations with global average temperature very close to what they are today.
If you "believe" the hockey stick reconstruction, then the current global average temperature is much warmer than at any time over the last 1000 years. This can lead to the conclusion that the conditions today are extraordinarily warm compared with the recent past and more likely can be attributed mainly to anthropogenic greenhouse gas increase.
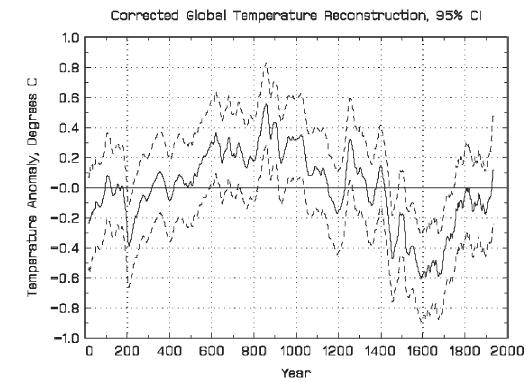
The debate about the validity of the hockey stick reconstruction still continues more than 10 years after its initial publication. The graph has been used almost as an icon of global warming due to human emissions of greenhouse gases. It was published in the 2001 IPCC report as "evidence" that the increase in global average temperature since 1900 was unprecendented over the last 1000 years . However, I believe that we can now say that the methodology used to create the original hockey stick graph was flawed. The biggest problem is due to mathematical and statistical errors in Mann's method that were discoverd and proven to exist. This is discussed in a non-technal manner in this article, A Global Warming Bombshell: A prime piece of evidence linking human activity to climate change turns out to be an artifact of poor mathematics written by Richard Muller, who says he is concerned about global warming and thinks that human-created carbon dioxide has contributed. In the article, Muller makes the point that a blind belief about the implications of the hockey stick could actually weaken the case of human-caused gloabal warming if the Earth were to begin a period of global cooling as this would be difficult to explain if humans are the only cause recent climate changes. Another criticism of Mann's work is that the results are highly influenced by the use of tree ring proxy data. Without going into the details, it can be difficult and misleading to interpret past temperatures based on tree ring data. Note that the hockey stick graph was not included in the most recent IPCC 2007 report. For another point of comparison, the temperature reconstruction shown below was constructed based on many sources of proxy data, but not including tree rings.
|
| A Temperature reconstruction with 95% confidence intervals shown, from Loehle and McCullough (published in Energy and Environment, 2008): Correction to: A 2000 year global temperature record based on non-tree ring proxies. As this reconstruction is based soley on proxy data, the recent, measured global average temperature was not added to the end of the record as was done by Mann. The last data point represents a 29 year average centered around 1935. |
We certainly cannot resolve this issue here. There is lively debate on these reconstructions even among the "experts". In any case, all reconstructions of global average temperature based on proxy data are so uncertain that one cannot be used to disprove another. As with many other issues in the global warming debate, we are forced to decide how to act based on uncertain information.
![]()
![]()
![]()
![]()