![]()
![]()
![]()
![]()
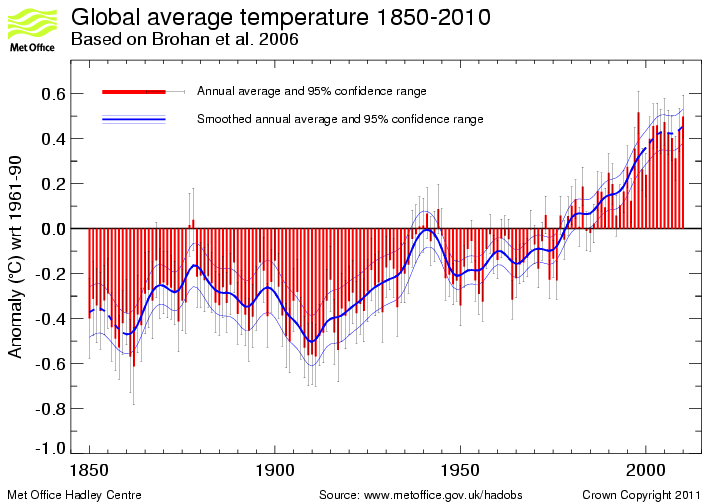
We will now take a look at the temperature record since 1850. This record is constructed from actual measurements and thus can be considered reasonably accurate. According to the first figure below, the global average surface temperatures on Earth have risen by about 0.8°C (1.4°F) since 1850. The red bars indicate the global average temperature each year relative to the average temperature over the period 1961-1990. The blue line is a smoothed version of the plot drawn to highlight trends in temperature. There is some uncertainty in determining global average temperatures from the available measurements due to instrumental errors and the fact that measurements are quite sparse over some areas of the world, but even the most conservative estimates indicate that the surface temperature has risen at least 0.5°C (0.9°F) since 1850.
The second figure below shows the temperature differences for the year 2006 compared to the 1961-1990 average temperature. Even though the average global temperature for 2006 was about 0.4°C higher than the 1961-1990 average, note that some regions of the world showed much larger warm anomalies (over 4°C in some areas), while other regions actually had lower temperatures (over 1°C in some areas) for the year 2006. This again shows that even if the global average temperature goes up, there will be quite a bit of variability expected at regional spatial scales.
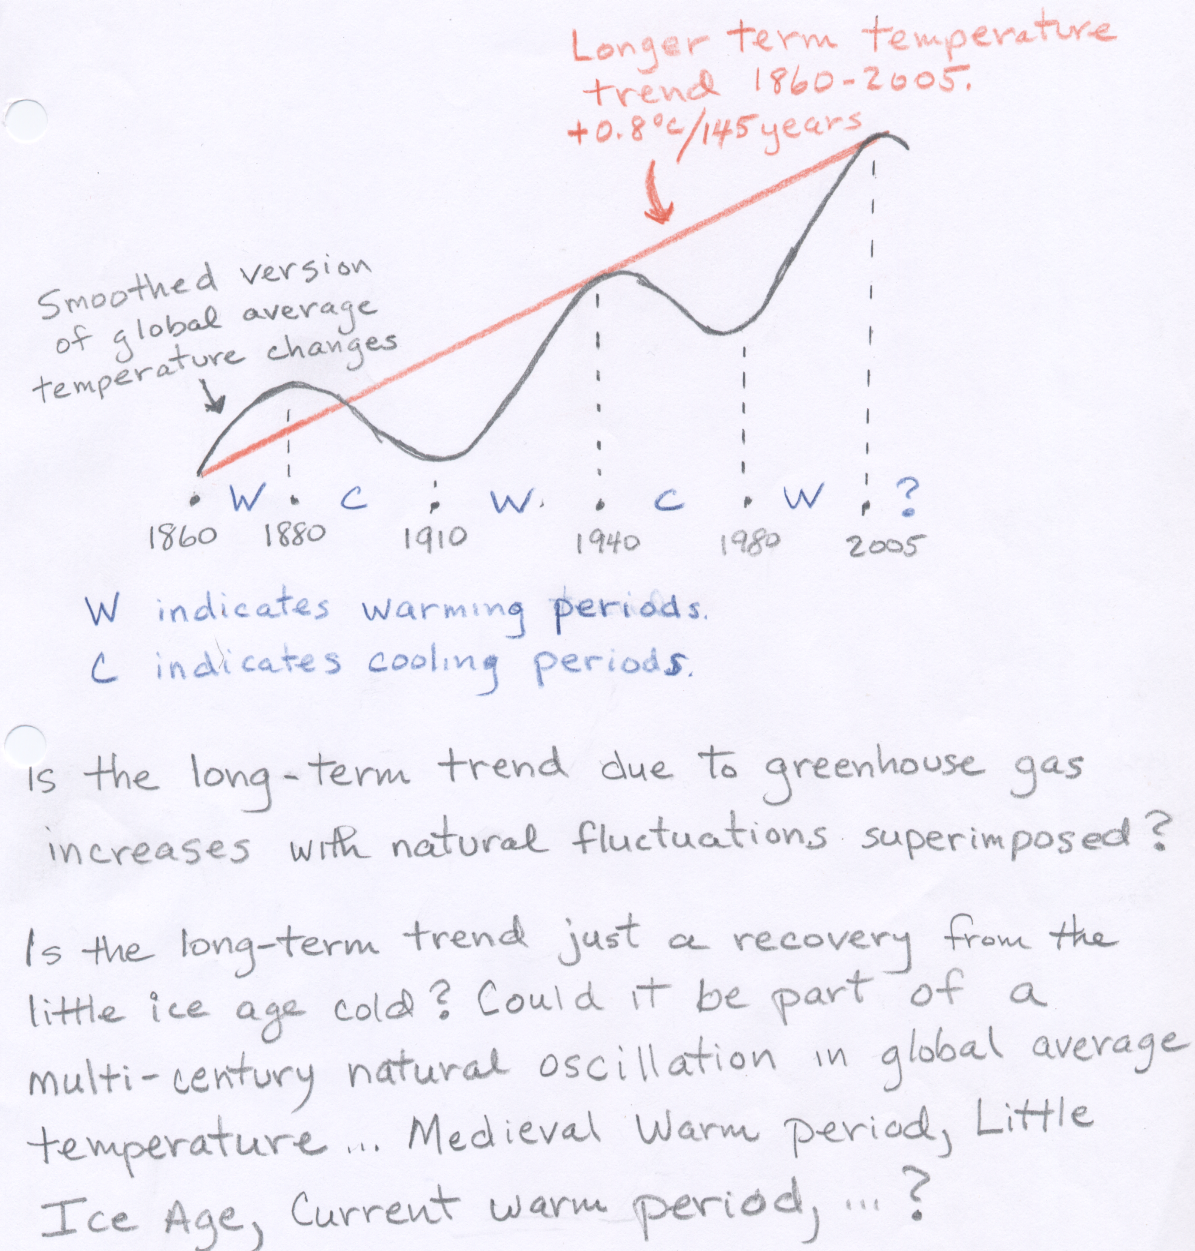
We need to consider the question: Is the recently measured warming of global average surface temperatures caused by the increasing amounts of greenhouse gases in the atmospere, or is it part of a natural cycle?
According to climate models the warming is largely due to the additional greenhouse gases. If greenhouse gas concentrations are left fixed at pre-industrial levels, the models show little if any warming during the twentieth century, while the same models do predict warming when they include the observed increases in greenhouse gases. However, climate models are unable to reconstruct the irregular pattern of the observed warming since 1860.
The irregular warming has been used by global warming opponents as evidence that natural climate fluctuations dominate over the effects caused by increased greenhouse gases. In particular, they point to two periods:
Proponents of global warming caused by greenhouse gas increases contend that even during the general warming trend expected as greenhouse gases increases, there will be fluctuations along the way. The cooling period from 1940-1970s can possibly be explained by high aerosol concentrations in the atmosphere during this period related to "dirty" coal burning. "Dirty" coal burning has since been curtailed due to concerns about acid rain. Once the aerosols cleared, we started to again see global warming caused by increasing greenhouse gases.
Based on the historical temperature record, some claim that the warming since 1980 appears to be the fastest rate of increase over the last 10,000 years, but we cannot prove that since we would be unable to resolve all short term temperature variations that have occurred over the last 10,000 years. In other words, because we cannot resolve year to year variations in global avearge temperature from proxy records, temperature reconstructions based on proxy records are a "smoothed" version of the real temperature changes. (Also, note in the global average temperature reconstruction shown above that the rate of increase in global average temperature between 1910 and 1940 is not that much different from the rate of warming between 1980 and today). Thus, there is no way to conclude that the rate of temperature increase today is faster than any other time in the last 10,000 years. However, we can say with some confidence that through the year 2008, the warmest 13 years in the measured temperature record (since 1860) have been recorded since 1995 and the 15 warmest years have all occurred since 1990 (see Rank diagram warmest to coldest years from Hadley Centre). For many, this is enough evidence that the recent temperature increases are not part of some natural cycle, and must be due to human activity, caused by increasing greenhouse gas concentrations in the atmosphere.
However, if we go back 800 years to the Medieval warm period (or Little Climatic Optimum), current global average temperatures may be only slightly warmer than that period. (If we go back 6,000 years to the Holocene Optimum, global average temperature was most likely warmer than it is today.) Again, a possible difference today is that the rate of warming (0.8°C in 100 years) may be faster than the rate of warming that lead up to the Medieval Warm Period, although as stated above we cannot confirm this.
Another issue, which has been gaining attention lately, is that the rate of warming of global average surface temperatures has certaintly slowed in the last 10 years. There is even a hint that the smoothed annual average global temperature may have topped out around 2002 and is beginning to trend downward. Keep in mind that we will need more years of data to see if this does indeed happen. Note also that the year 2010 was a warm year, which hints that we may not be entering a cooling period. Nevertheless, after about three decades of warming global average temperature, it is entirely possible that the Earth is now be entering another multi-decadal period of cooling global average temperature. There is evidence for a multi-decadal oscillation in global warming and global cooling since 1860. In fact, several multi-decadal natural oscillations have been identified in climate records in recent years. For example the Pacific Decadal Oscillation (PDO) contains identifiable warm and cold phases in sea surface temperature in the north Pacific Ocean (a similar North Atlantic Oscillation [NAO] has also been identified). Several researchers have gone out on a limb to predict global cooling over the next 20-40 years based on a reversal of the PDO from warm phase, which began in 1977, to cold phase, which may have begun around 2000 (see another perspective on recent temperature changes.) Supposing that we are entering a period of cooling global average temperatures, what might this mean in terms of answering the question of whether or not global average temperature is significantly warmer due to anthropogenic greenhouse gas increases?
For those convinced that our emissions of greenhouse gases are significantly warming global averge surface temperature, a cooling period is simply explained as a natural climate variation sitting on top of a longer term rise in global average temperature due to increased greenhouse gases. It is difficult to dismiss this possibility.
For those convinced that recent increases in greenhouse gases are not significantly changing global average temperature, this indicates that natural variations dominate over higher greenhouse gas concentrations. The longer term rise in global average temperatures on top of the multi-decadal oscillation is simply a recovery from the little ice age cold. Some point to a possible longer term multi-century oscillation between warm and cold peroids, i.e., medieval warm period, little ice age, current warm period, etc.
You should realize that even if we enter a period of 30 years of global cooling, this does not prove or disprove anthropogenic global warming. However, 30 years of global cooling is not predicted by climate models or the 2007 IPCC report, so if it does occur, it may be seen as a failure of current climate models to predict future climate changes.
![]()
![]()
![]()
![]()