Thursday Oct. 27, 2011
click here to
download today's notes in a more printer friendly format
A couple of songs from the Andrea Bocelli Vivere Live in Tuscany
concert: "La Voce del
Silenzio"
with
Andrea
Bocelli
and
Elisa,
and
"Dancing"
sung
by
Elisa. "Vivere"
with Andrea Bocelli and Laura Pausini is also nice but there wasn't
time to play it before class.
Quiz #3 is one week from today and the Quiz
#3
Study Guide has appeared online.
The recent Humidity Problems Optional Assignment has been graded
and was returned in class. Click here for
answers and a step by step guide to solving the problems.
The Experiment #3 reports are due next Tuesday. At this
point you'll need to bring the materials to my office in PAS 588 if you
want to pick up the supplementary information handout before next
Tuesday. There's a box for your materials just inside my office
door and copies of the supplementary information are nearby. So
you can come by just about anytime between 9:30 am and 5:00 pm.
We spent probably the first 30 minutes of classes finishing up the
section on naming and identifying clouds. You'll find all of this
at the end of the Tues., Oct. 25 online notes.
I also briefly explained the grade summaries that were handed out in
class on Tuesday. You'll find that at the bottom of today's notes.
Since we've been learning how to
identify clouds this seemed like a logical
time to learn a little bit about the 2
most common types of satellite photographs. You'll find this
discussed on pps 99-100 in the photocopied ClassNotes.
IR satellite photographs

When you see satellite photographs
of clouds on the TV weather you are probably seeing an infrared
satellite photograph.
1.
An
infrared
satellite
photograph
detects
the
10
μm IR
radiation
actually
emitted by the ground, the ocean and by clouds. You don't depend
on seeing
reflected
sunlight, so clouds
can be photographed during the day and at
night. You may recall that 10 μm radiation is in the
middle of
the atmospheric window, so emitted radiation is able to pass through
air
without being absorbed. If clouds don't get in the way, you can
see the ground and the ocean on an IR photograph.
2. Clouds do absorb 10 μm
radiation and then emit
10 μm IR radiation upwards toward the satellite
and down toward the
ground. The top surface of a low altitude cloud will be
relatively warm. Warmer objects emit IR radiation more intensely
than cooler objects (the Stefan Boltzmann law).
Relatively strong IR emissions appear grey on an IR satellite
photograph. A
grey
unimpressive
looking
cloud
on
an
IR
satellite
photograph
may
actually
be
a
thick
nimbostratus cloud that is
producing rain or snow.
3. Cloud tops found at high altitude are cold and emit
IR
weaker radiation (lower rate or lower intensity). This shows up
white on an IR photograph.
4. Two very different clouds (a thunderstorm and a
cirrostratus cloud) would both appear white on the satellite photograph
and would be difficult to distinquish. Meteorologists are
interested in locating thunderstorms because they can produce
hazardous severe
weather. This can't be done using just IR photographs.
5. The ground changes temperature during the course of
the
day. On an infrared satellite animation you can watch the ground
change from dark grey or black (afternoon when
the ground is warmest) to lighter grey (early morning when the ground
is cold)
during the course of a day. Because of water's high specific
heat, the ocean right alongside doesn't
change temperature much during the day and remains grey throughout the
day.
Land and ocean temperatures during the warmest and coolest part of
the day are shown at the top of this figure. Sketches of how the
land and ocean might appear on an IR photograph are shown below.
Here's a link
to an IR satellite photograph loop on the UA Atmospheric Sciences Dept.
webpage.
Visible satellite photographs

1. A visible satellite photograph "sees" sunlight that is
reflected
by clouds. It shows what you would see if you were out in space
looking down at the earth. You won't see clouds on a visible
satellite photograph
at night.
2. Thick clouds are good reflectors and appear
white. The low altitude layer cloud and the
thunderstorm would
both appear white on this photograph and would be difficult to
distinquish.
3. Thinner clouds don't reflect as much light and appear
grey.
Here's a summary. The
figure below wasn't shown in class.
The figure below shows
how,
if
you
examine
both
visible
and
IR
photographs,
you
can
begin
to
distinquish
between
different
types of
clouds.
You can use this figure to answer
the satellite
photograph
question that is on the Quiz #3 Study Guide.
There is a 3rd type of satellite photograph, a water vapor
image. This is just for your information and wasn't mentioned in
class (they are very occasionally shown on the TV weather
forecast)
This is also an IR satellite
photograph, but the satellite detects and photographs 6.7 μm
radiation.
This type of image can show
air motions in regions where there aren't any clouds because the
6.7 um radiation (Point 1) is absorbed by water vapor. The water
vapor then emits IR radiation upward toward the satellite where it can
be photographed. Water vapor from lower in the
atmosphere emits more strongly and appears grey (Point 2), water
vapor
from
high
in
the
atmosphere
emits
weak
radiation
and
appears
white (Point 3).
The last
big topic we will cover
before next week's quiz is precipitation formation and types of
precipitation. Only two of the 10 main cloud types (nimbostratus
and cumulonimbus) are able to produce
significant amounts of
precipitation. Why is that?
This figure shows typical sizes of
cloud
condensation nuclei (CCN), cloud droplets, and raindrops (a human hair
is about 50 μm thick for comparison). As
we
saw in the cloud in a bottle demonstration it is relatively easy to
make cloud droplets. You cool moist air to the dew point and
raise the RH to 100%. Water vapor
condenses pretty much instantaneously onto a cloud condensation nucleus
to form a cloud droplet. It
would take much longer (a day or more) for condensation to turn a cloud
droplet
into a
raindrop. You know from personal experience that once a cloud
forms you don't have to wait that long for precipitation to begin to
fall.
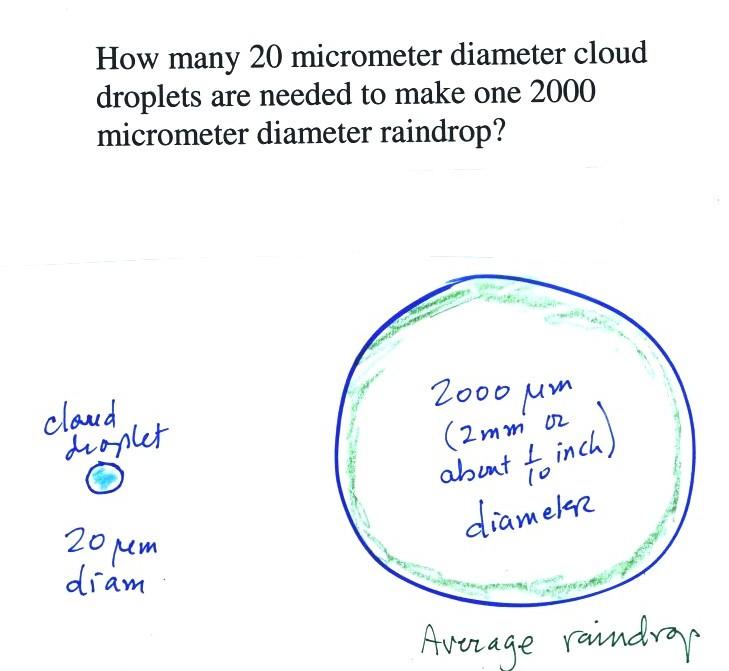
Part of the problem is that it
takes quite a few 20 μm
diameter cloud
droplets to make one 2000 μm diameter
raindrop. How many
exactly? Before answering that question we will look at a cube
(rather than a sphere).
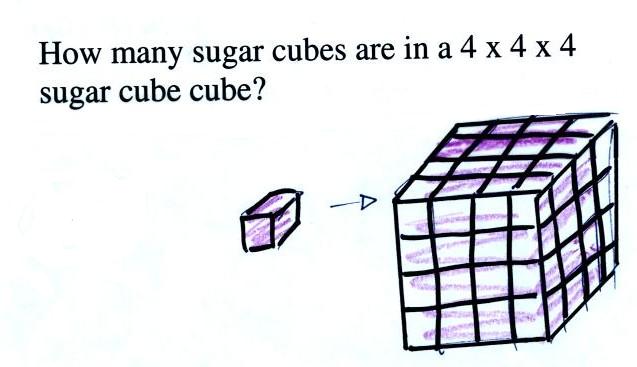
It would take 64 individual sugar
cubes to make a 4 cube x 4 cube x 4 cube cube. That is because
the bigger cube is 4 times wider, 4 times deeper, and 4 times
taller. Volume is the product of all three dimensions. (27
sugar cubes would be
needed to make a 3 cube x 3 cube x 3 cube box etc)
The raindrop is 100 times wider,
100 times
deeper, and 100 times taller than the cloud droplet. The raindrop
has a volume that is 100 x 100 x 100 = 1,000,000 (one million) times
larger than the volume of
the cloud droplets.
Fortunately
there
are
two
processes
capable of quickly
turning small cloud droplets
into much larger precipitation particles in a cloud.
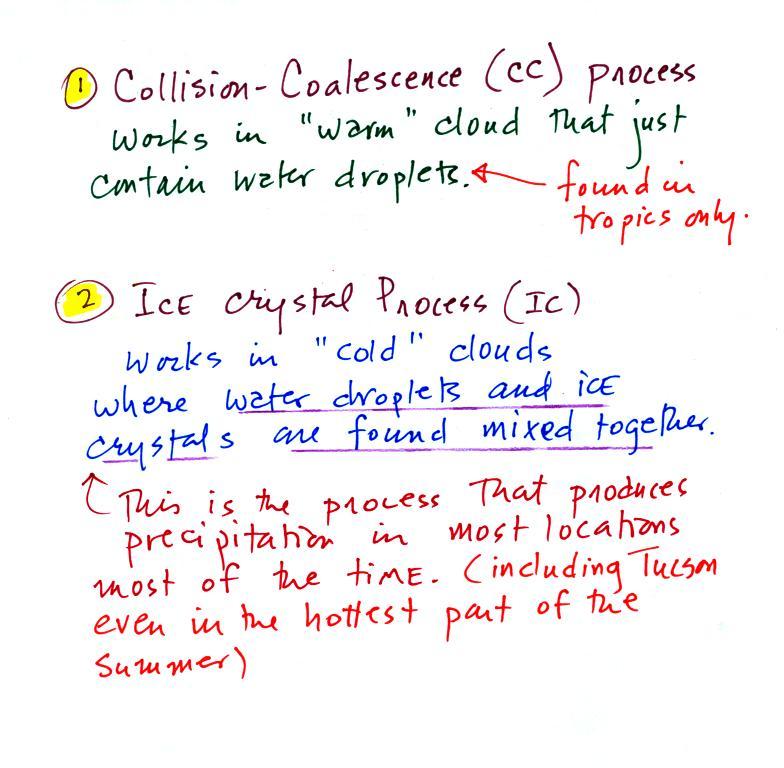
The collision coalescence process
works in clouds that
are
composed of water droplets only. Clouds like this are only found
in
the tropics. We'll see that this is a pretty easy process to
understand. This process will only produce rain, drizzle, and
something called virga (rain that evaporates before reaching the
ground).
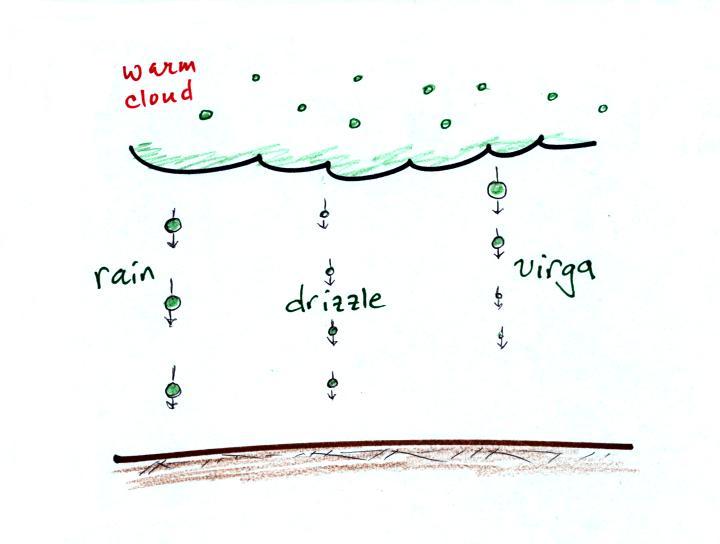
Here's a look at the types of precipitation that the
collision-coalescence process can produce.
Not much variety. Basically big raindrops, small raindrops
(drizzle) and rain that doesn't even reach the ground (virga), it
evaporates on the way down.
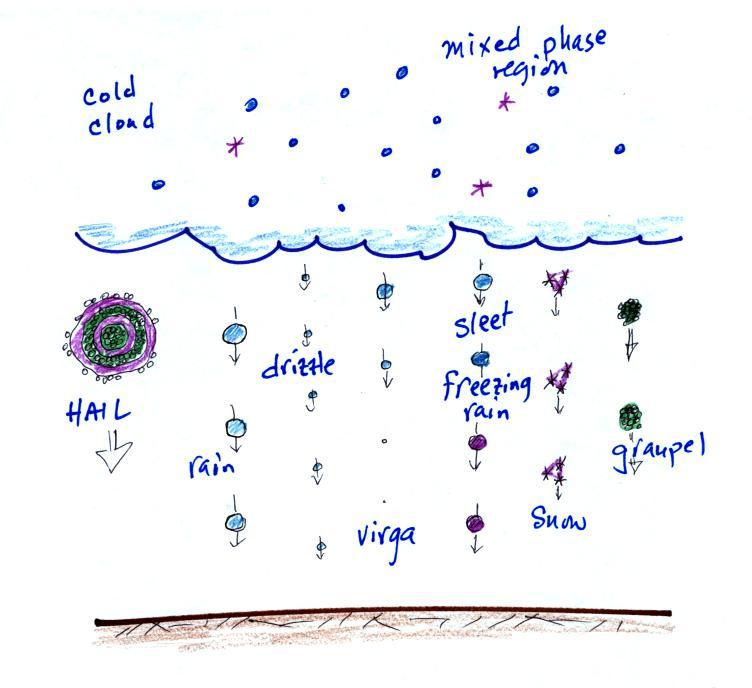
The ice crystal process produces precipitation everywhere
else.
This is the process that makes rain in
Tucson, even on the hottest day in the summer (summer thunderstorm
clouds are tall and reach into cold parts of the atmosphere, well below
freezing. Hail and graupel often
fall from these storms; proof that the precipitation started out as an
ice particle). There is one part
of this process that is a little harder to understand. This
process can produce a variety of different kinds of precipitation
particles (rain, snow, hail, sleet, graupel, etc).
And looking ahead to next Tuesday, here's what the ice crystal process
can do.
Here's a midterm grade summary example (numbers in the
example are
class averages)
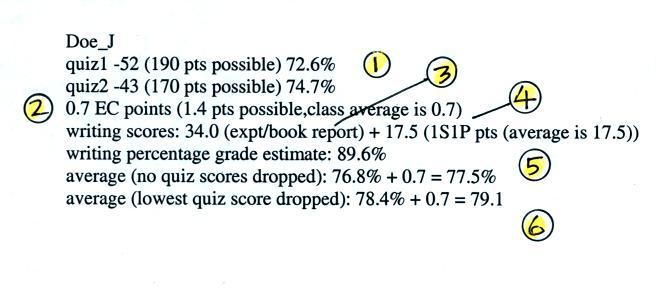
1. You should find your two quiz scores
here. The quiz percentage grades are used to compute your overall
grade; all the quizzes have the same weight.
2. This is the total number of extra credit points
you have earned on the Optional Assignments. You could have
earned up to 1.4 pts at this point in the semester. By the end of
the semester that total will be at least 3 pts and maybe a little more.
3. If you have turned in an experiment or book report
and it has been graded you should see the score here. If there is
a 0 here, an average grade of
34 out of 40 has been used by the computer to show the effect of the
experiment report on your overall grade. The Expt. #1 and Expt.
#2 reports have been graded. The Expt. #1 revised reports haven't
been graded yet.
4. This shows the total number of 1S1P pts you have
earned so far (the computer in this case uses a 0 in the calculation if
you haven't done any 1S1P reports). You should try to earn 45
1S1P pts by the end of
the semester. Assignment
#2
is currently available.
There'll be another assignment after that.
The writing percentage grade is based on both the experiment report
grade and the 1S1P pts total. It makes an allowance for the fact
that
you couldn't have earned all of the 45 1S1P pts at this point in the
semester (though there are a few students that are pretty close).
5. This average is based on your quiz scores and your
writing percentage grade. This is the grade that needs to be
90.0% or
above in order for you to not have to take the final exam. Note
the extra credit points are added on to the quiz + writing grade
average.
6. This is the average with the lowest quiz score
dropped (the writing score is not dropped). This is the grade
that would be used together with your
Final Exam score to determine your overall grade.
These mid term grade estimates try to give you an idea of the grade you
would
receive at the end of the semester if you continue to perform as you
have done so far. It is still possible for you to significantly
raise
your
grade between now and the end of the semester. It is also
possible, of course, for your grade to drop.
Please check your
grade summary carefully for errors and/or omissions.