Wednesday Sep. 30, 2009
click here to download today's notes in
a more printer friendly format
Music today featured Andrea Bocelli & Elisa in La Voce del Silenzio and Andrea Bocelli with Laura Pausini in Dare to Live
(Vivere).
The Experiment #1 reports have been graded. You are allowed to
revise
your report and try to raise your grade if you want to. Revised
reports
are due in 2 weeks - on or before Wed., Oct. 14. Please return
your
original report with your revised report. You don't need to
rewrite your
whole report, only sections where you want to earn additional credit.
The latest Optional
Assignment was handed
out in class
and is due next Wednesday (Oct. 7).
We've been spending some time learning about surface weather
maps. Maps
showing conditions at various altitudes above the ground are also
drawn.
Upper level conditions can affect the development and movement of
surface
features (and vice versa)
We started with three basic things to know about upper level
charts.
First the overall appearance is somewhat different from a surface
weather
map. On a surface map you generally find circular (more or less)
centers
of high and low pressure. You can also find closed high and low
pressure
centers at upper levels, but mostly you find a wavy pattern like
sketched
below. The busy looking figure drawn in class has been split into
3
figures for clarity.
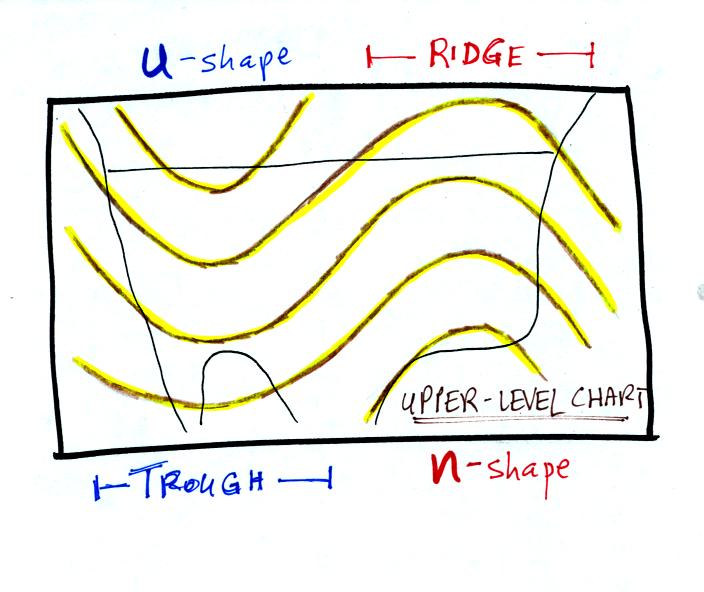
The u-shaped
portion of the pattern is called a trough. The n-shaped portion
is called
a ridge.
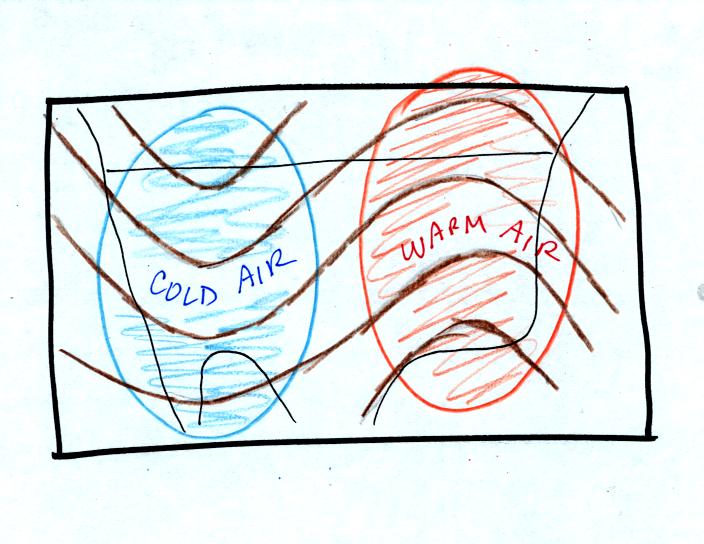
Troughs
are produced by large volumes of cool or cold air
(the cold air is found between the ground and the upper level that the
map
depicts). The western half of the country in the map above would
probably
be experiencing colder than average temperatures. Large volumes
of warm
or hot air produce ridges.
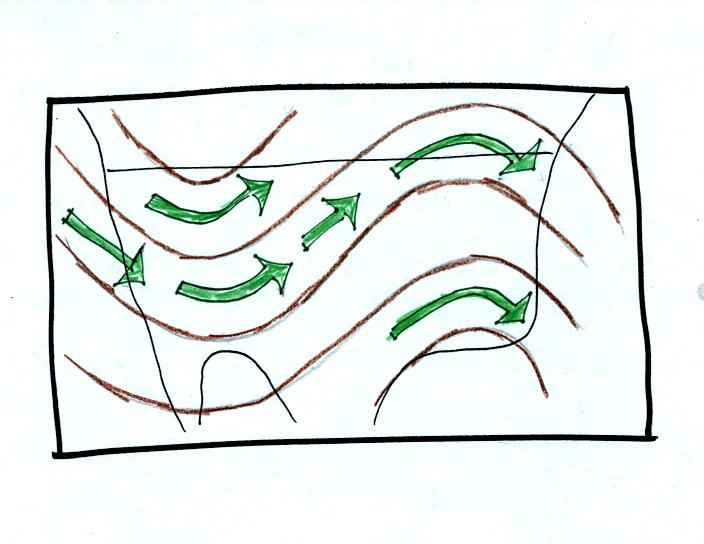
The
winds on upper level charts blow parallel to the contour lines.
On a
surface map the winds cross the isobars slightly, spiralling into
centers of
low pressure and outward away from centers of high pressure. The
upper
level winds generally blow from west to east.
Next looked at some of the interactions between features on surface and
upper
level charts
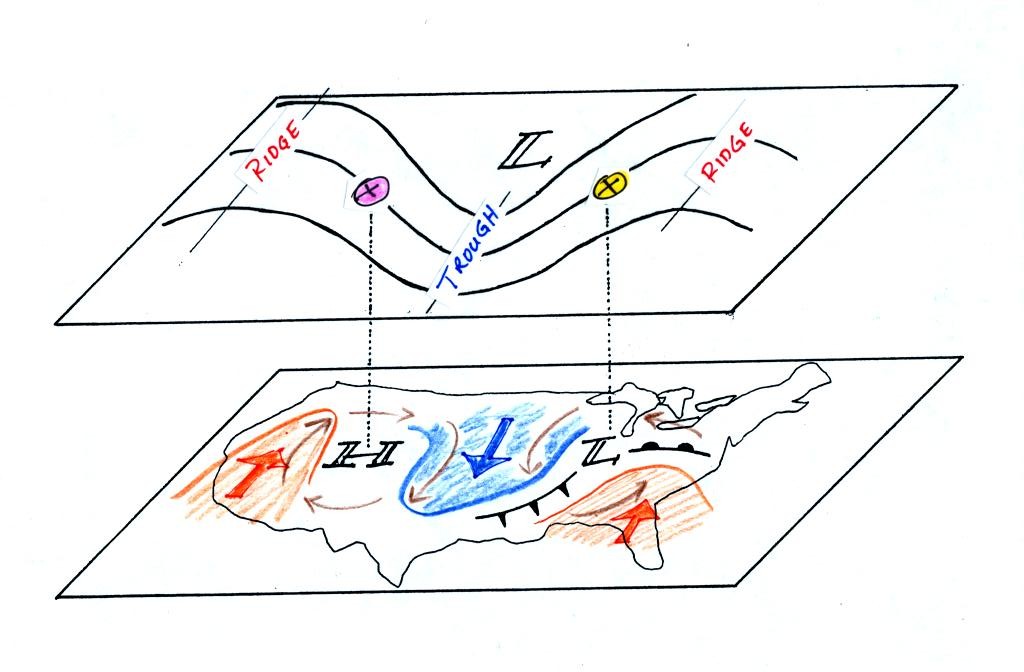
On
the surface map you see centers of HIGH and LOW pressure. The
surface low
pressure center, together with the cold and warm fronts, is a middle
latitude
storm.
Note how the counterclockwise winds spinning around the LOW move warm
air
northward (behind the warm front on the eastern side of the LOW) and
cold air
southward (behind the cold front on the western side of the LOW).
Clockwise winds spinning around the HIGH also move warm and cold
air. The
surface winds are shown with thin brown arrows on the surface map.
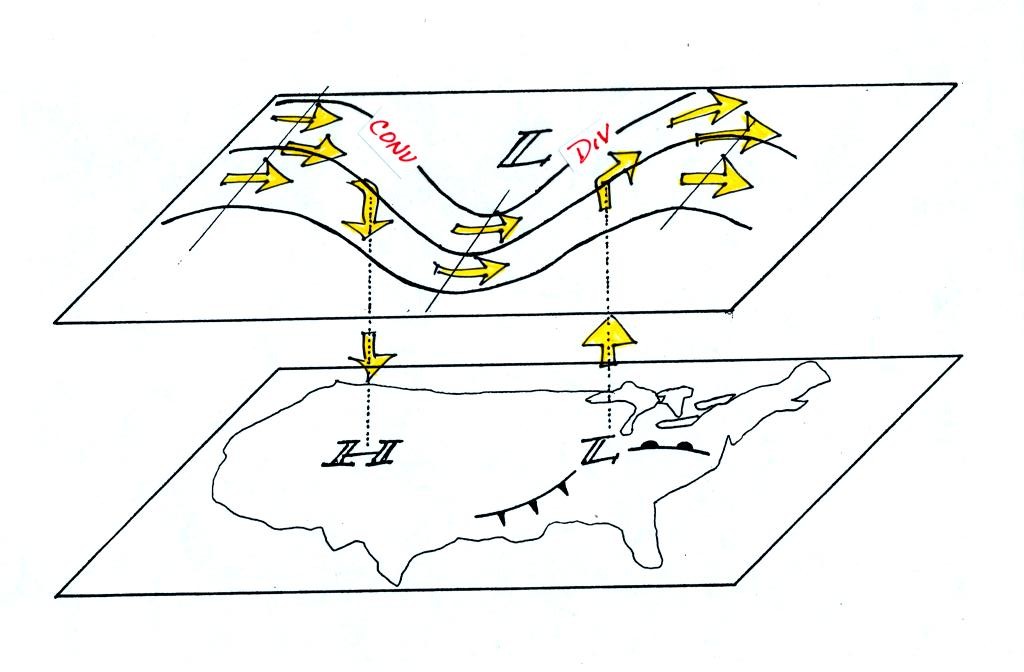
Note the ridge and trough features on the upper level chart. We
learned
that warm air is found below an upper level ridge. Now you can
begin to
see where this warm air comes from. Warm air is found west of the
HIGH
and to the east of the LOW. This is where the two ridges on
the
upper level chart are also found. You expect to find cold air
below an
upper level trough. This cold air is being moved into the middle
of the
US by the northerly winds that are found between the HIGH and the
LOW.
Note the yellow X marked on the upper level chart directly above the
surface
LOW. This is a good location for a surface LOW to form, develop,
and
strengthen (strengthening means the pressure in the surface low will
get even
lower than it is now). The reason for this is that the yellow X
is a
location where there is often upper level divergence. Similary
the pink X
is where you often find upper level convergence. This could cause
the
pressure in the center of the surface high pressure to get even higher.
We need to look in a little more detail at how upper level winds can
affect the
development or intensification of a surface storm. This next
section
might be a little confusing and you might need to read through it a
couple of
times.
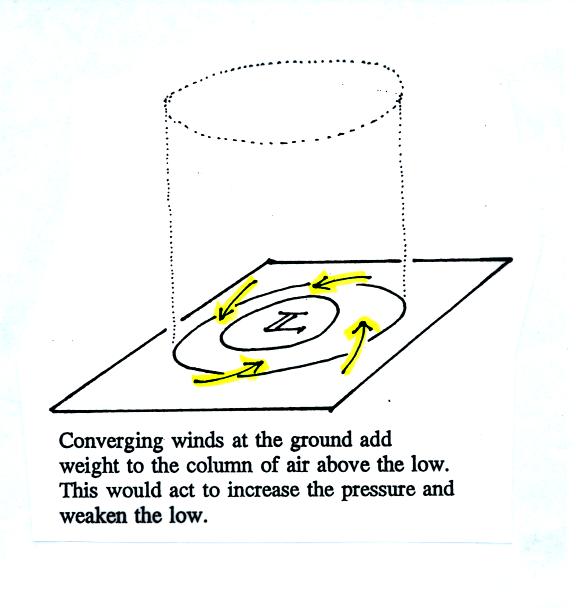
This
figure (see p. 42 in the photocopied Classnotes) shows a cylinder of
air
positioned above a surface low pressure center. The pressure at
the
bottom of the cylinder is determined by the weight of the air
overhead.
The surface winds are spinning counterclockwise and spiraling in toward
the center
of the surface low. These converging surface winds add air to the
cylinder. Adding air to the cylinder means the cylinder will
weigh more
and you would expect the surface pressure at the bottom of the cylinder
to
increase.
We'll just make up some numbers, this might make things clearer.
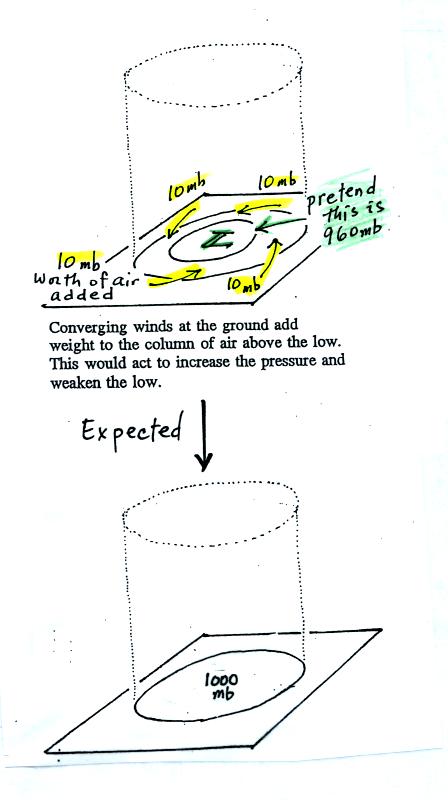
You'll
find this figure on p. 42a in the Class Notes. We will assume the
surface
low has 960 mb pressure. Imagine that each of the surface
wind
arrows brings in enough air to increase the pressure at the center of
the LOW
by 10 mb. You would expect the pressure at the center of the LOW
to
increase from 960 mb to 1000 mb.
This is just like a bank account. You have $960 in the bank and
you make
four $10 dollar deposits. You would expect your bank account
balance to
increase from $960 to $1000.
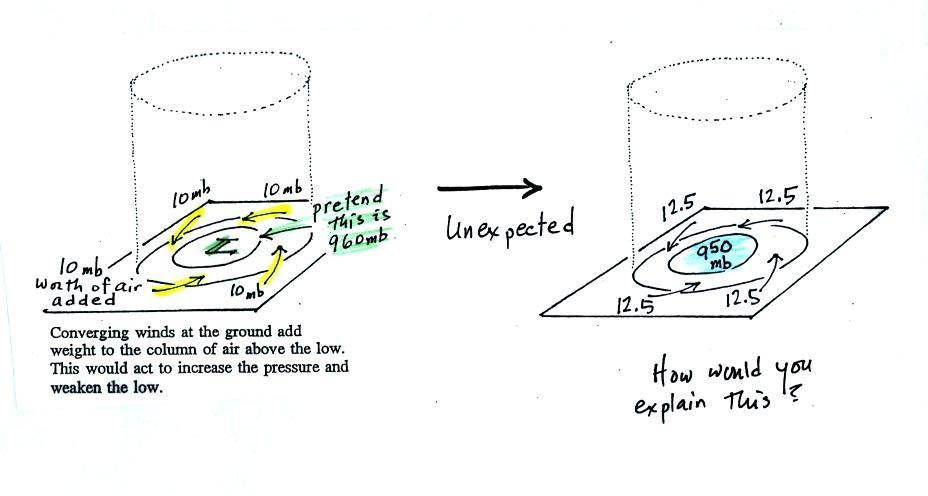
But what if the surface pressure decreased from 960 mb to 950 mb as
shown in
the following figure? Or in terms of the bank account, wouldn't
you be
surprised if, after making four $10 dollar deposits, the balance
dropped from
$960 to $950.
The
next figure shows us what could be happening (back to p. 42 in the
Class
Notes).

There
may be some upper level divergence (more arrows leaving the cylinder at
some
point above the ground than going in ). Upper level divergence
removes
air from the cylinder and would decrease the weight of the cylinder
(and that
would lower the surface pressure)
We need to determine which of the two (converging winds at the surface
or
divergence at upper levels) is dominant. That will determine what
happens
to the surface pressure.
Again some actual numbers might help (see p. 42b in the Class Notes)
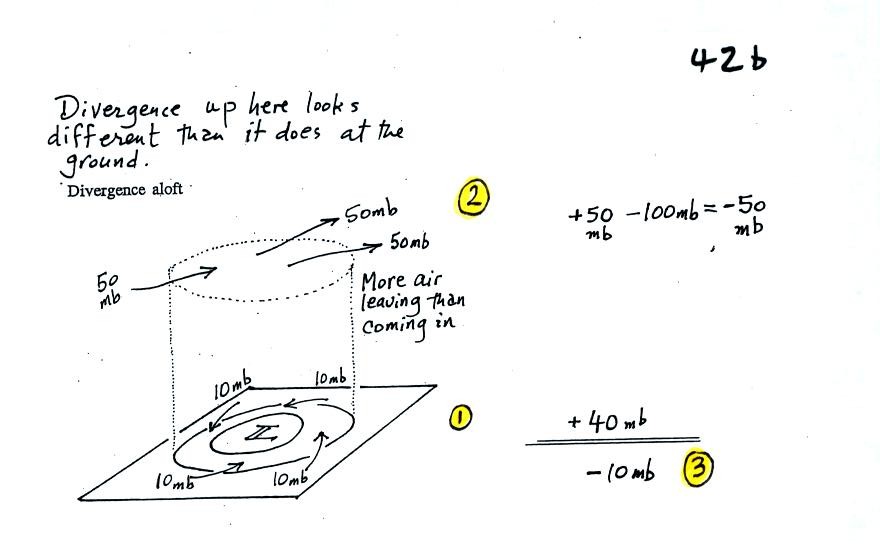
The
40 millibars worth of surface convergence is shown at Point 1. Up
at
Point 2 there are 50 mb of air entering the cylinder but 100 mb
leaving.
That is a net loss of 50 mb. At Point 3 we see the overall
result, a net
loss of 10 mb. The surface pressure should decrease from 960 mb
to 950
mb. That change is reflected in the next picture (found at the
bottom of
p. 42b in the Class Notes).
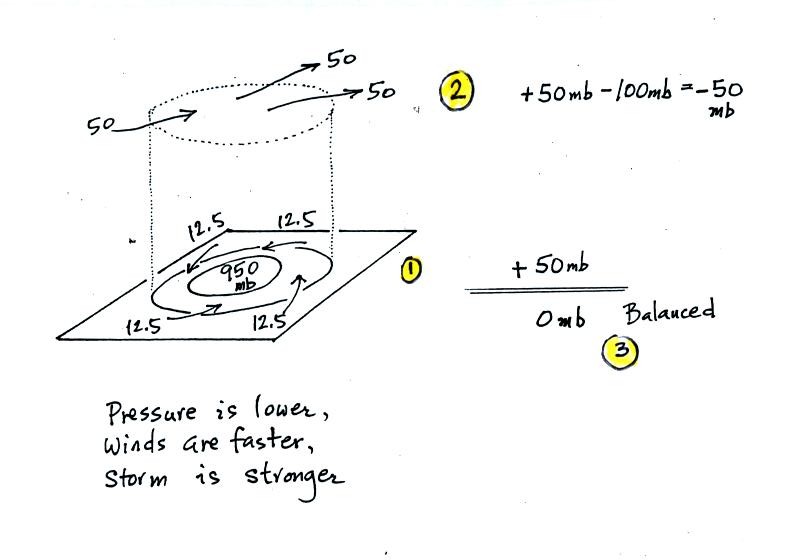
The
surface pressure is 950 mb. This means there is
more of a pressure difference between the low pressure in the center of
the
storm and the pressure surrounding the storm. The surface storm
has
intensified and the surface winds will blow faster and carry more air
into the
cylinder (the surface wind arrows each now carry 12.5 mb of air instead
of 10
mb). The converging surface winds add 50 mb of air to the
cylinder (Point
1), the upper level divergence removes 50 mb of air from the cylinder
(Point
2). Convergence and divergence are in balance (Point 3).
The storm
won't intensify any further.
Now
that you have some idea of what upper level divergence looks like (more
air
leaving than is going in) you are in a position to understand another
one of
the relationships between the surface and upper level winds.
One of the things we have learned about surface LOW pressure is that
the
converging surface winds create rising air motions. The figure
above
gives you an idea of what can happen to this rising air (it has to go
somewhere). Note the upper level divergence in the figure: two
arrows of
air coming into the point "DIV" and three arrows of air leaving (more
air going out than coming in is what makes this divergence). The
rising
air can, in effect, supply the extra arrow's worth of air.
Three arrows of air come into the point marked "CONV" on the upper
level chart and two leave (more air coming in than going out).
What
happens to the extra arrow? It sinks, it is the source of the
sinking air
found above surface high pressure.
In
the last few minutes of class we learned a little bit
about the Piccard family.
Auguste Piccard
(1884-1962) together with Paul Kipfer (see p. 32 in the
photocopied ClassNotes) was the lead member of a two-man team that made
the
first trip into the stratosphere in a balloon. They did that on
May 27,
1931. We watched a short segment from a PBS program called "The
Adventurers" that documented that trip.
Jacques Piccard
(Auguste's son) was part of a
two-man team that traveled to
the deepest point in the ocean (35,800 feet) in a bathyscaph. In
the next
week or so I will show you a short segment from an earlier test of the
bathyscaph where Auguste and Jacques descended to 10,000 feet.
Finally Bertrand
Piccard (Jacques son, Auguste's
grandson) was part of the two man team that first circled the globe
nonstop in
a balloon. That occurred fairly recently, March 20, 1999, I
believe. I also plan to show you some of that trip.