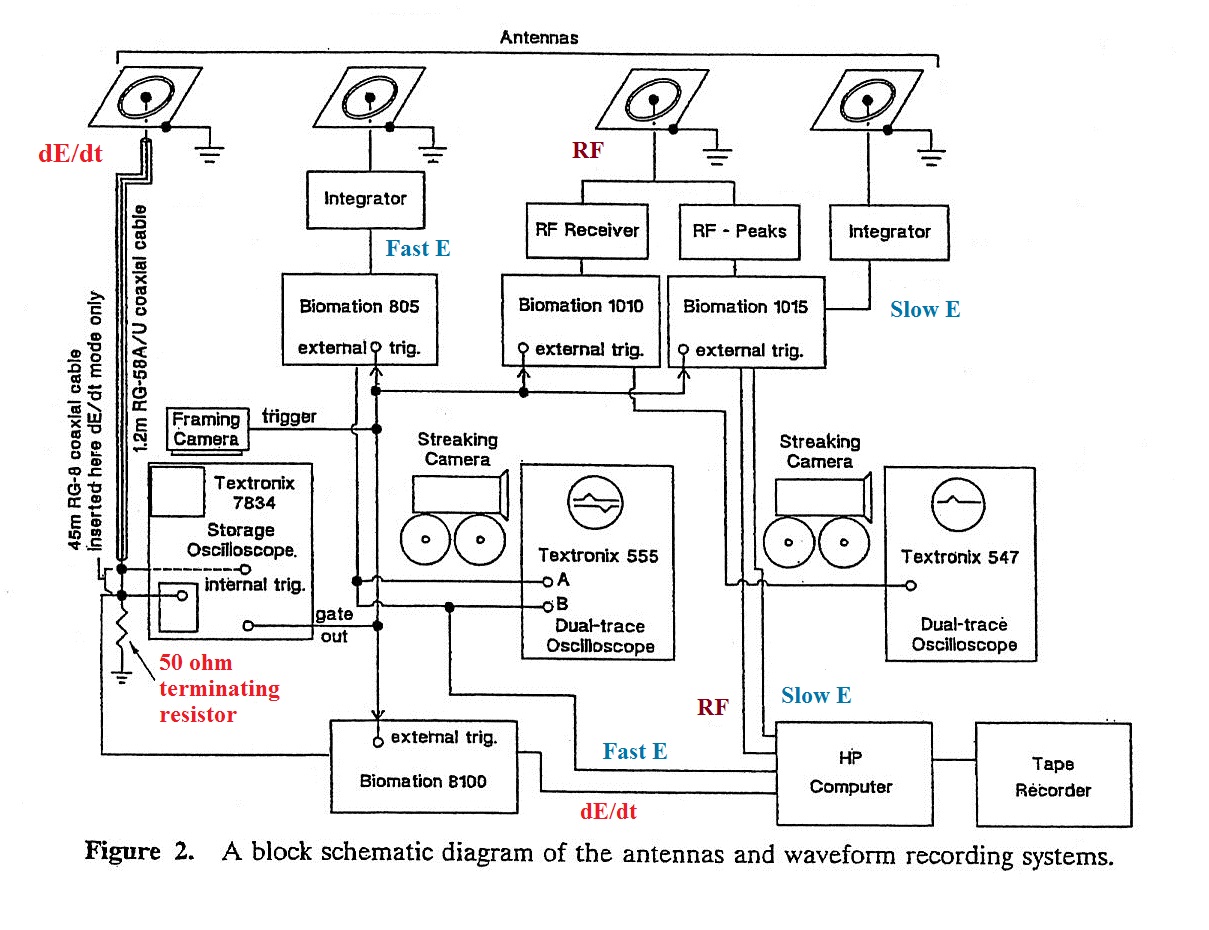
You should recognize the flat plate E field
antennas shown at the top of the figure. Separate
antennas were used for dE/dt, Fast E, a 5 MHz RF signal, and a
Slow E signal. The signal cables from the Fast E and
Slow E antennas were connected to integrators. We
discussed all of this earlier in the semester so that should
be familiar.
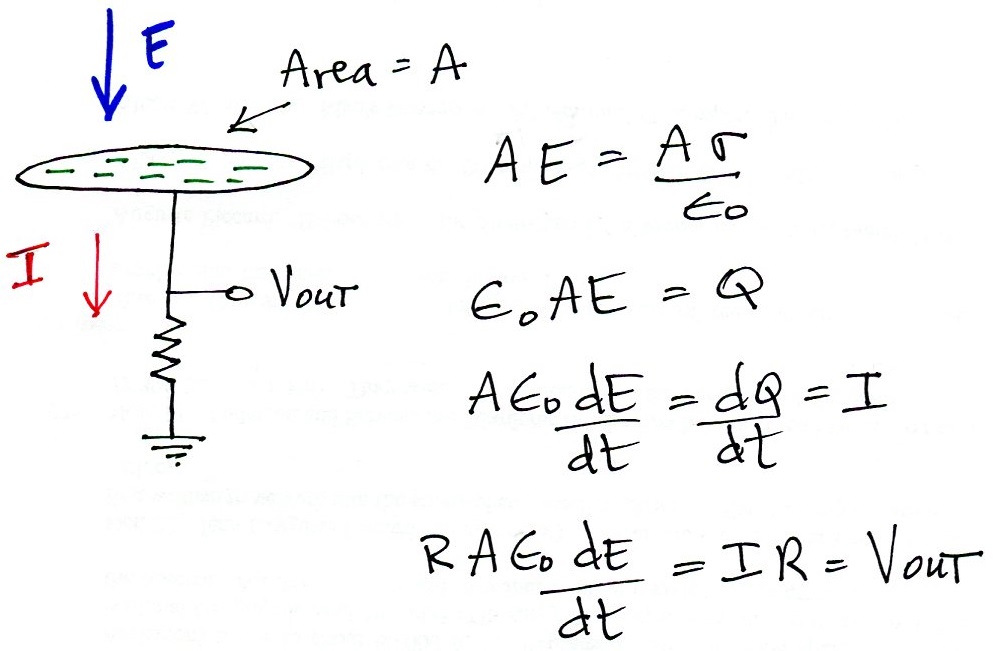
For dE/dt, the cable from the flat plate antenna (the left most antenna above) was not connected to an integrator. Rather it was connected to a 50 ohm resistor, the characteristic impedance of the coaxial cable. The voltage that appears across this resistor is proportional to dE/dt as shown below.
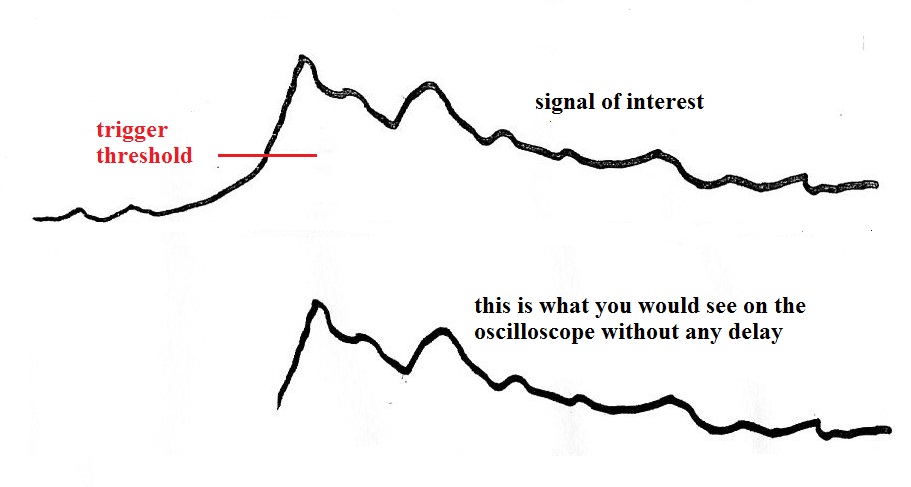
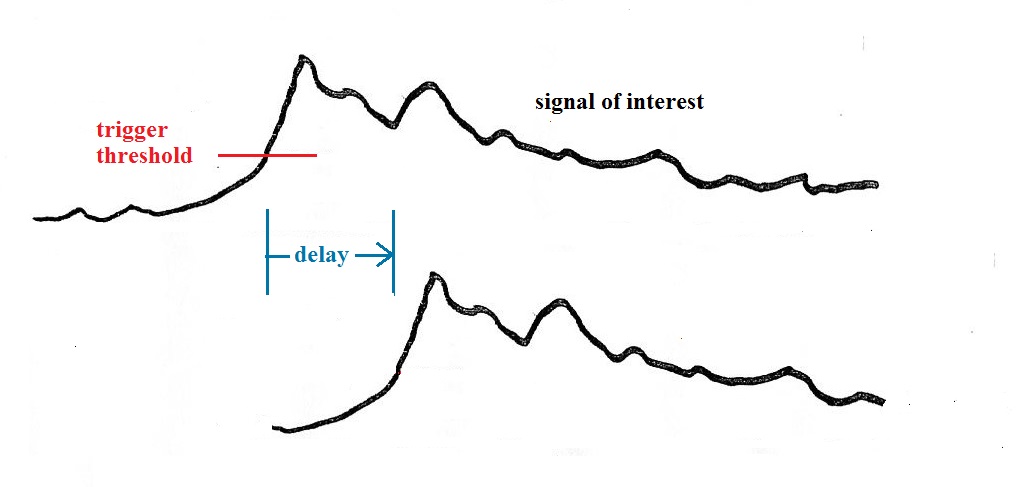
Note the dE/dt signal cable is here shown connected to the internal trigger of the storage oscilloscope (the 5 MHz RF signal was also used to trigger the storage oscilloscope). The dE/dt signal then ran through a 45 m length of coaxial cable before being connected to the input of the storage oscilloscope. The 45 m length of cable acted as a delay line (about 150 ns of delay). The hope was that with sufficient "pretrigger" signal you could establish an accurate zero. The figure below shows an oscilloscope display of a signal with and without delay.
The oscilloscope begins to sweep when the signal crosses the trigger threshold. Without delay you would only capture a portion of the rise to peak (left figure). With sufficient delay (right figure) you could capture the entire front edge of the signal.
Some examples of dE/dt signals recorded with a system like the one above are shown below at left. An E signal obtained by integrating the dE/dt waveforms is shown at right. LS and RS indicate leader step and return stroke signals respectively.
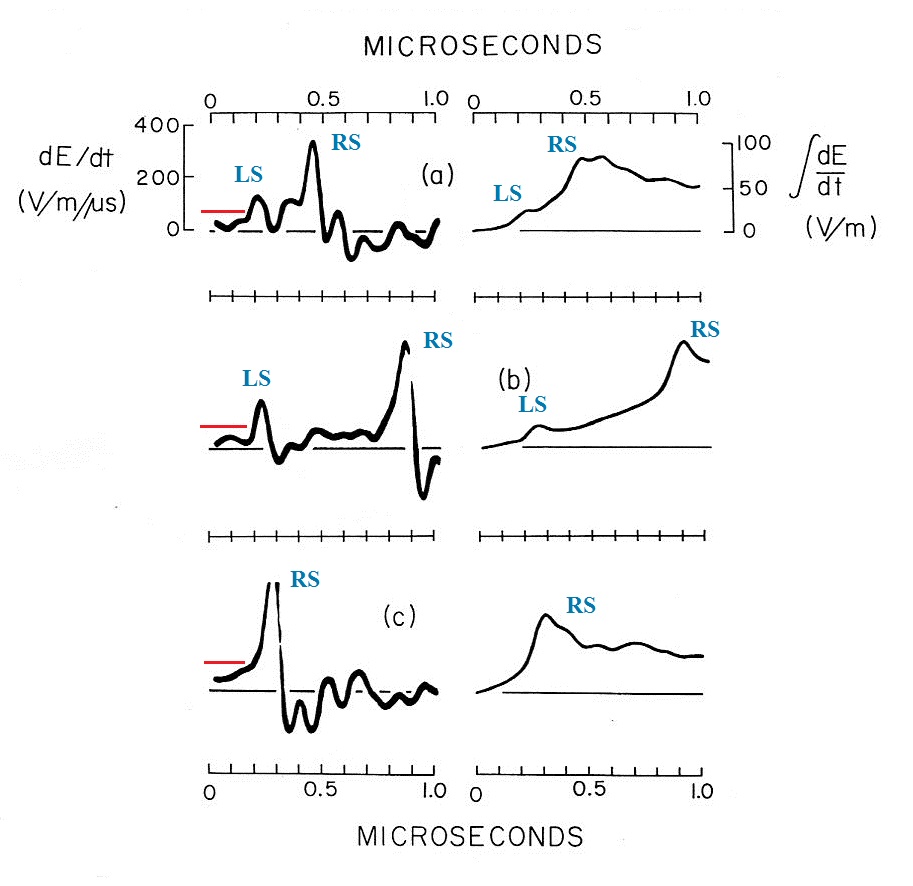
The dE/dt signals were recorded on a very fast time base. A storage oscilloscope was oscilloscope signal if a storage scope hadn't been used. The red line shown at the left of each of the dE/dt signals shows the approximate storage oscilloscope trigger level.
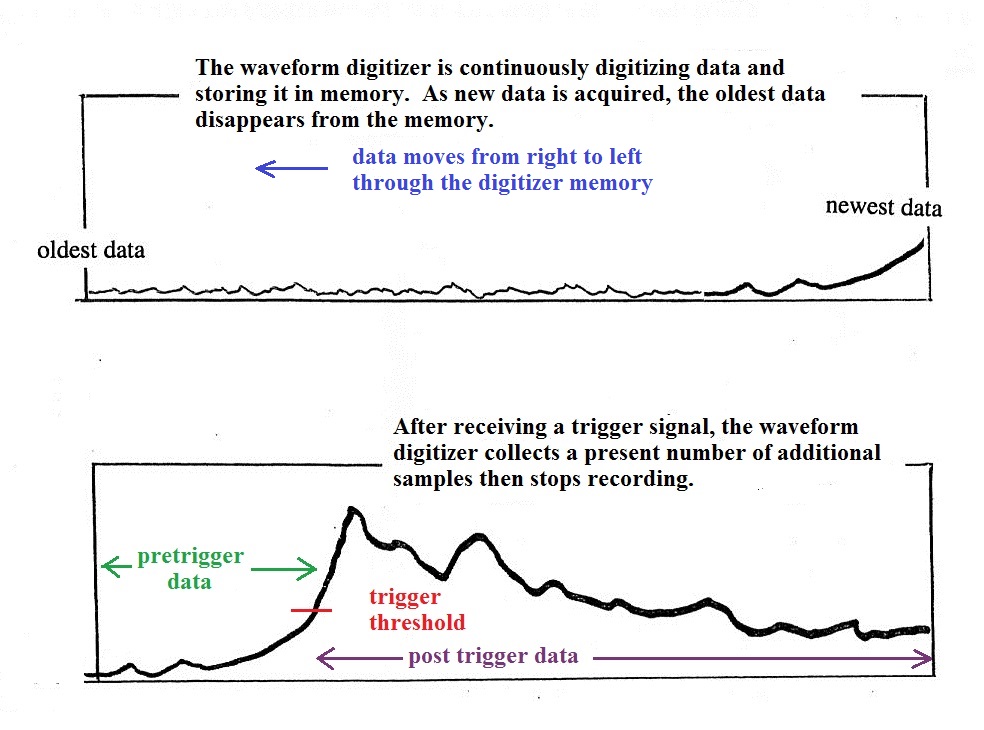
It is much easier to obtain pretrigger signal when using a
waveform digitizer. A waveform digitizer continuously
digitizes the incoming signal. It doesn't attempt to
store all of this data only the most recent samples. As
new data is acquired and added to the memory, the oldest data
is pushed out of the memory. Once a trigger signal is
received, the digitizer collects a preset number of additional
samples and then stops recording. The data in memory is
preserved until it can be read or displayed (both were done in
the system above).
As best I can remember the waveform digitizers above had the following characteristics
For dE/dt, the cable from the flat plate antenna (the left most antenna above) was not connected to an integrator. Rather it was connected to a 50 ohm resistor, the characteristic impedance of the coaxial cable. The voltage that appears across this resistor is proportional to dE/dt as shown below.
Note the dE/dt signal cable is here shown connected to the internal trigger of the storage oscilloscope (the 5 MHz RF signal was also used to trigger the storage oscilloscope). The dE/dt signal then ran through a 45 m length of coaxial cable before being connected to the input of the storage oscilloscope. The 45 m length of cable acted as a delay line (about 150 ns of delay). The hope was that with sufficient "pretrigger" signal you could establish an accurate zero. The figure below shows an oscilloscope display of a signal with and without delay.
 |
 |
The oscilloscope begins to sweep when the signal crosses the trigger threshold. Without delay you would only capture a portion of the rise to peak (left figure). With sufficient delay (right figure) you could capture the entire front edge of the signal.
Some examples of dE/dt signals recorded with a system like the one above are shown below at left. An E signal obtained by integrating the dE/dt waveforms is shown at right. LS and RS indicate leader step and return stroke signals respectively.
The dE/dt signals were recorded on a very fast time base. A storage oscilloscope was oscilloscope signal if a storage scope hadn't been used. The red line shown at the left of each of the dE/dt signals shows the approximate storage oscilloscope trigger level.
As best I can remember the waveform digitizers above had the following characteristics
| Model number |
resolution |
maximum sampling rate |
memory size |
| Biomation 805 |
8 bits |
5 MHz (0.2 μs/sample) |
2048 |
| Biomation 1010 |
10 bits |
10 MHz (0.2 μs/sample) | ? |
| Biomation 8100 |
8 bits |
100 MHz (10 ns/sample) |
? |
| Biomation 1015 |
? |
100 kHz (10 μs/sample) | ? |