Tuesday Feb. 21, 2017
The picture below is from the supplementary
lecture on cold cloud/ thunderstorm cloud structure.
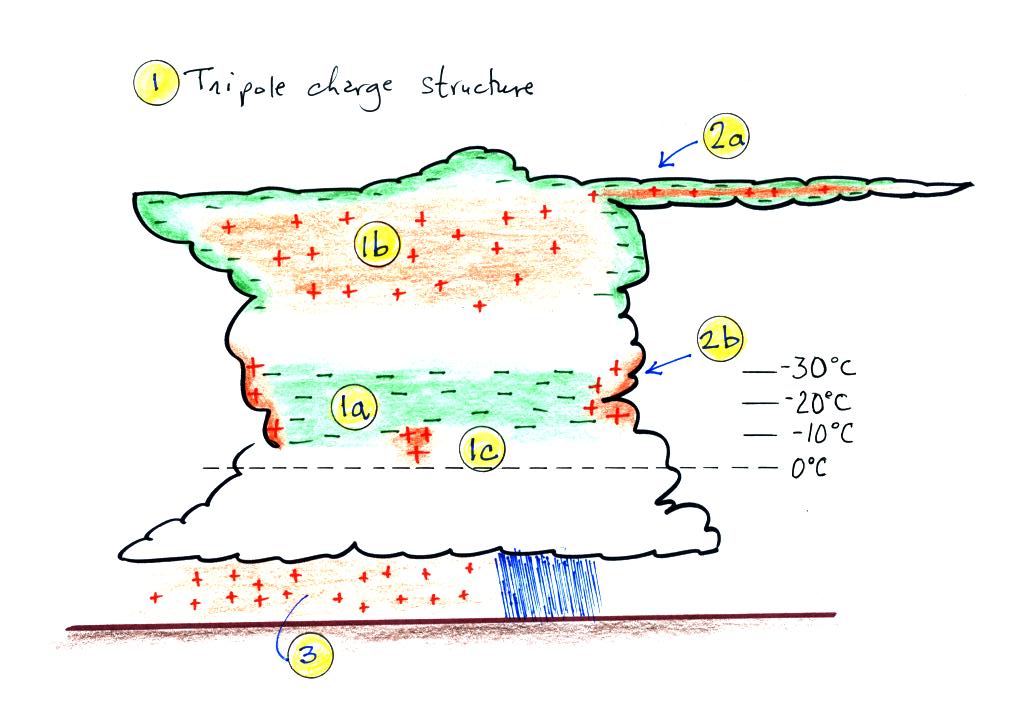
The tripolar charge structure is what a viable electrification
process needs to explain.
The main charge centers are first an upper
positive charge center at 1(b) and more of a layer of negative
charge at (1a) that seems always to be found at temperatures
between -10o and -30o
C. There are also often a few small positive charge
centers 1(c) found below the large layer of negative charge
Screening layers are found at the top and sides of the cloud
(2a and 2b in the figure). These form because of the abrupt
drop in conductivity as you move from outside the cloud into the
cloud and aren't part of the electrification process.
The figure below presents some of the evidence supporting the
idea that the negative charge is found between -10o and
-30o C in
thunderstorm clouds.

The figure shows the locations
of negative charge neutralized during cloud-to-ground and
intracloud discharges in clouds in Florida, New Mexico, and
Japan. We'll look at how this is done later in the
week. In each case the negative charge is found in the
same temperature range despite differences in cloud heights,
cloud base altitudes, and cloud thicknesses. (source:
Krehbiel, Paul R., "The Electrical Structure of
Thunderstorms," Ch. 8 in The Earth's Electrical Environment,
National Academy Press, Washington, 1986)
And just so you don't think you now have everything
figured out, here is a figure that demonstrates that the
distribution of charge in some thunderstorms can be much more
complex than the simple tripolar model discussed above. The
figure shows charge in the convective part of a mesoscale
convective system (source: Stolzenburg,
M.,
W.D.
Rust,
and
T.C.
Marshall,
"Electrical
Structure
in Thunderstorm Convective Regions 3. Synthesis," J. Geophys.
Res., 103, 14097-14108, 1998).
Convective process
We'll start with the convective process of cloud
electrification.
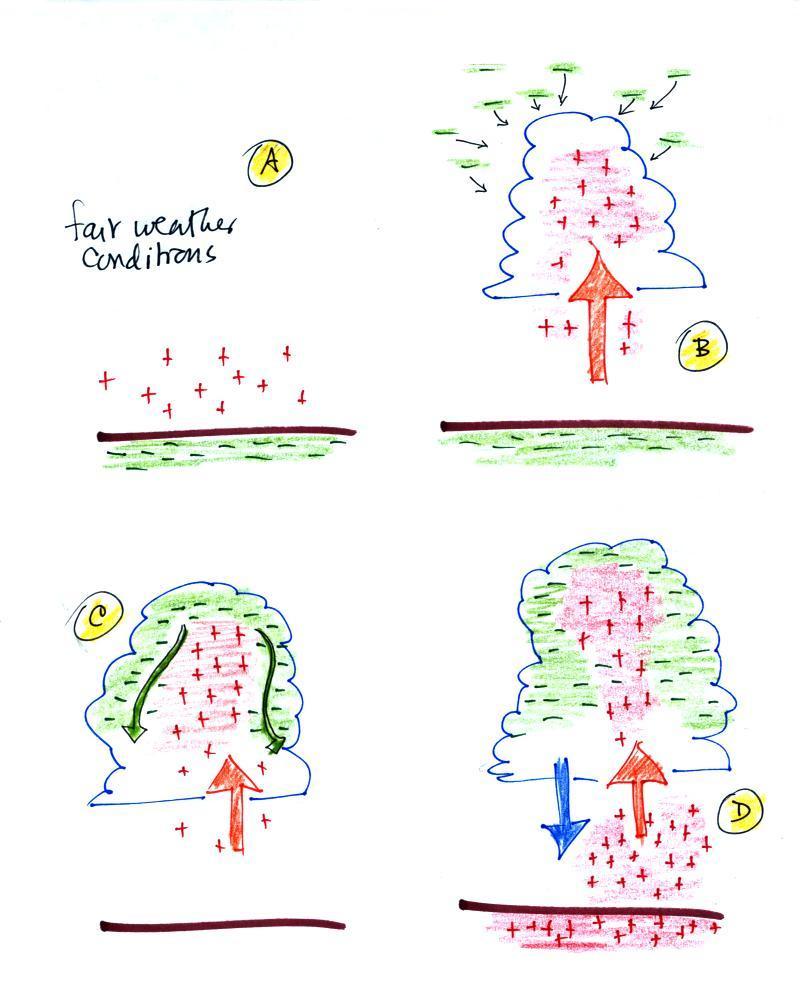
The convective theory starts
with the positive charge found in the air above the ground
during fair weather (Fig. A). In Fig. B an updraft and a
cloud have started to form and positive charge is swept upward
into the cloud where the charge attaches to cloud
particles. Negative charge carriers in the surrounding
air are drawn to the positive charge in the top of the cloud
and form a screening layer. Cloud edge motions shown in
Fig. C then begin to carry this negative charge down and into
the middle center of the cloud to form the main negative
charge center. The electric field at the ground
intensifies because of the close proximity of negative charge
in the cloud. Objects on the ground go into corona
discharge and "spray" positive charge into the air (Fig.
D). This is one way of accelerating the charging
process.
While cloud motions can clearly have an effect on the
distribution of charge inside a thunderstorm, the convective
theory is generally not considered to be a viable mechanism
for the initial electrification of thunderstorms. It is
hard to understand how cloud motions would always form the
main layer of negative charge in the -10o
and -30o C region
of the cloud, for example.
Inductive processes
In the inductive process an existing (initially fair
weather) field induces charges in precipitation particles (in
the same way charges were induced on a conducting sphere in a
uniform field).
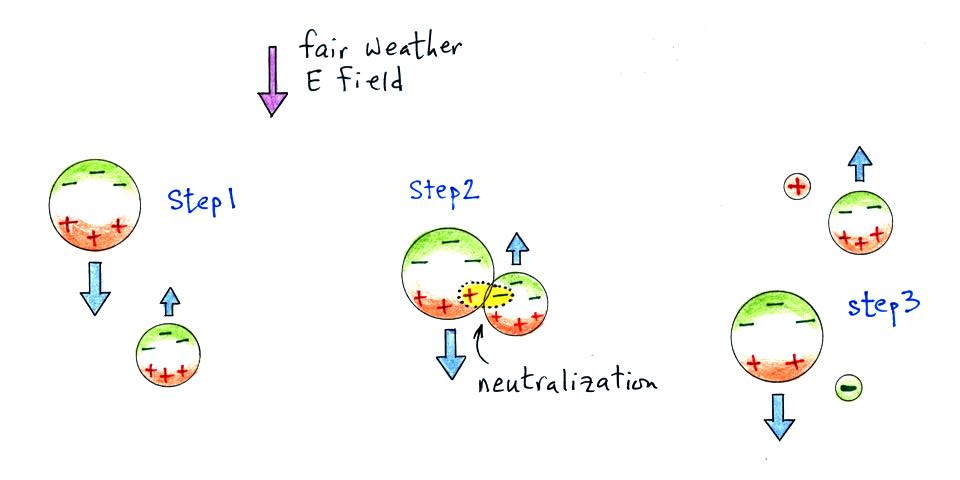
The downward pointing fair weather E field induces equal
amounts of negative and positive charge on the tops and
bottoms of different sized precipitation particles.
Because the particles are moving in different directions
or at different speeds, they collide. During the
collision some of the charge on each particle is
neutralized. Each particle is left with net charge
following the collision. Positive charge moves
upward, negative charge downward.
The direction of charge motions is consistent with the
direction and strengthening of in-cloud electric fields.
The field at the ground under a thunderstorm points
upward, the opposite of the fair weather field. The
direction of the in cloud field is the same as the fair
weather field. Thus the directions of charge
movement in the inductive process is consistent with
thunderstorm charge distribution.
There are a variety of types of particles that can
collide.
water
- water
|
ice
- ice
|
water
- ice
|
ice
- riming ice
|
When two water droplets collide, they will often stick
together. If they make just a glancing collision,
there won't be any charge neutralization because there
isn't any charge induced at the particle's equators.
Thus a collision between two water droplets would not seem
like it could separate significant amounts of charge.
Ice particle - ice particle collisions don't neutralize much
charge because the particles don't remain in contact for very long
and the lower electrical conductivity of ice means charge doesn't
flow as readily as it does through water.
Water - ice particle and ice - riming particle collisions might
work, but the general feeling still is that the inductive process
is not able to start with a fair weather E field and turn it into
a thunderstorm strength field.
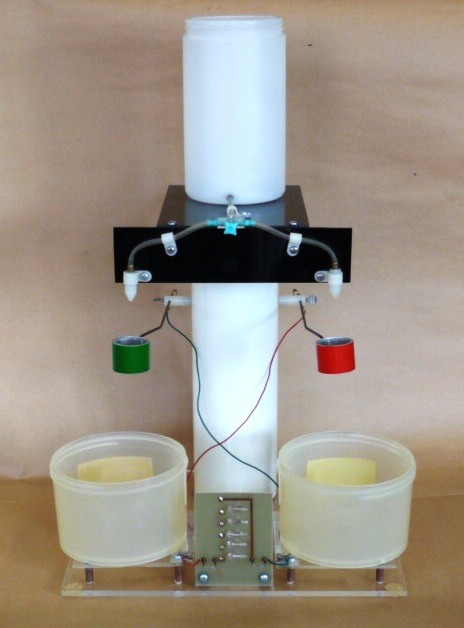
Before we leave the inductive process behind a quick
demonstration of an apparatus that depends on induction (and
positive feedback) to produce a surprising amount of charge from
tap water. The apparatus is a Kelvin
Water Dropper or Kelvin Electrostatic Generator. A
picture of the apparatus used in class is shown below at left
Water from a reservoir (at the top of the photo) travels down
two sections of tubing and out of two plastic nozzles positioned
near the middle of the photo. The falling streams of water
fall through two metal rings (colored red and green) and into two
plastic cups at the bottom of the picture. The cup on the
left is electrically connected to the ring at right (the red
ring), the cup on the right is connected to the left (green)
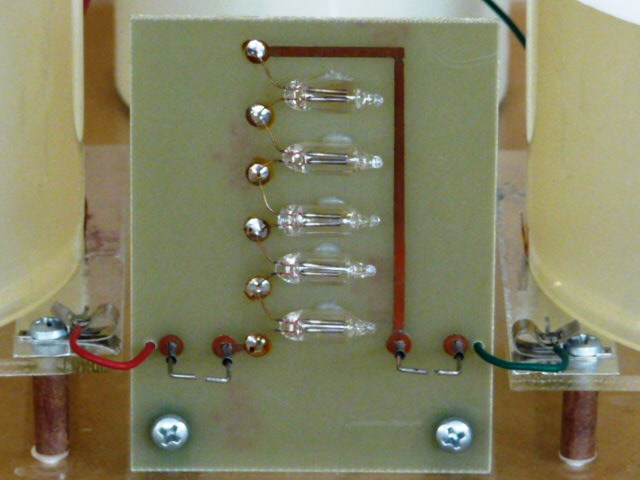
ring. The two cups are also electrically connected to 5 neon
lamps wired together in series. The right photo above is a
close up of the neon lamps.
The operation (as I understand it) is explained below.

There are a lot of videos on YouTube. This first video
(from Reinhard Schumacher at Carnegie Mellon University) shows an
apparatus that produces a visible spark and also contains a
sensitive electroscope. Here's a second video
(from Thomas Kim) that produces a visible and audible spark (note
how the sound of the dripping water also stops a second or two
before the spark).
Non-inductive process
The non-inductive process, also called the Reynolds, Brook,
Gourley process is generally thought to be the most viable
explanation for the rapid initial electrification of
thunderstorms. It doesn't require a existing field.
The process is shown in general terms below. We will look at
some of the details later.
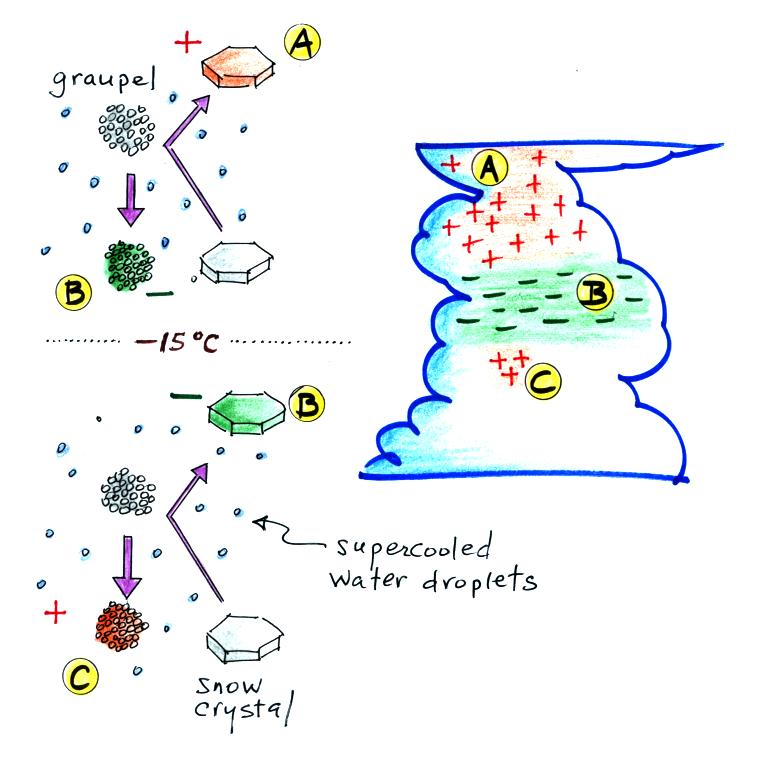
Basically graupel collides with a snow crystal, in the
presence of supercooled water droplets, and then depending on
the environmental temperature, the graupel ends up with
negative or positive charge and the ice crystal ends up with
the opposite polarity. At temperatures colder than about
-15 C the snow crystal ends up with positive charge and the
graupel is negative. The different sizes and fall
velocities of the two types of particles means they will tend
to separate after the collision. The negatively charged
graupel tends to accumulate in the middle of the cloud and the
snow crystal is carried up to higher parts of the cloud.
At temperatures warmer than about -15 C the polarities
reverse. We will see that this charge reversal
temperature can vary depending on the cloud liquid water
content. The letters A, B, and C show how this process
can account for the three main charge centers in a
thunderstorm (A & C are the upper and lower positive
charge centers, respectively; B is the main negative charge
center)
The following figure shows the experimental apparatus used
to make the initial measurements of charging. [source: S.E.
Reynolds, M. Brook, and Mary Foulks Gourley, "Thunderstorm
Charge Separation", J. Meteorology, 14, 426-436, 1957)
Two metal balls at the ends of arms mounted on a rotating
shaft simulate graupel particles in a cloud (pt. 1).
These balls become electrically charged. The movement of
charge can be monitored using a sensitive electrometer.
The electrical path from the balls to the electrometer has
been highlighted in yellow. A little bit wider view of
the apparatus is shown below.
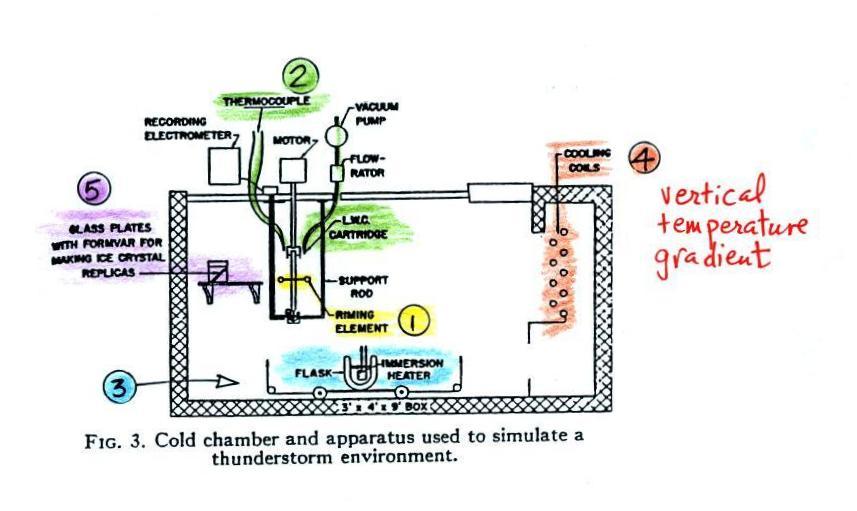
Temperature and liquid water content (LWC) are measured near
the spinning arms (pt. 2). Liquid water content is
really just a measure of the concentration of supercooled
water droplets.
Warm water at pt. 3 is the source of water vapor.
Cooling coils (pt. 4) cool the air inside the chamber.
Cold air will sink and probably establish a vertical
temperature gradient. The spinning metal ball could be
raised or lower to change the temperature of the surrounding
air. Replicas of ice crystals that form can be collected
at pt. 5 for later examination.
This would not be an easy experiment to conduct. It
would be difficult to create, measure, and monitor the cloud
environment in the chamber and the charging that does occur is
probably very weak and careful shielding is probably needed.
The following information was copied from the www.SnowCrystals.com
website. As I mentioned in a previous class this is an
information packed website and you should definitely have a
look at it if only to view the photomicrographs of snow
crystals. The information below is no longer
available. It briefly discusses the quasi-liquid layer
that is found at the boundary between ice and air.
The quasi liquid layer and/or perhaps just a layer of water
on the surface of ice particles seems to play an important
role in charging in the non inductive process.
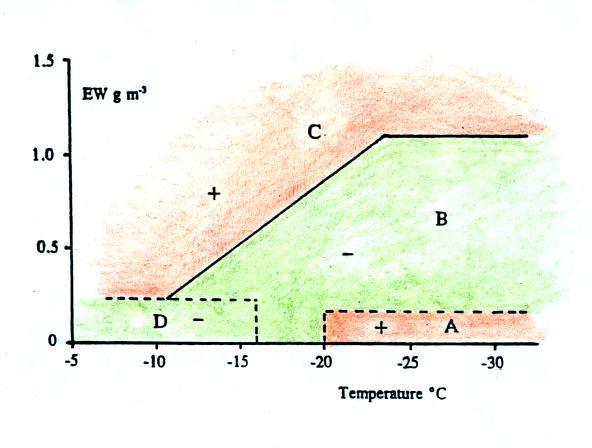
The + and - polarities in
the figure refer to the charge on the metal target that
simulates a graupel particle in these laboratory
experiments. The charge depends on the
environmental temperature and on the cloud liquid water
content as shown in the figure above. EW on
the vertical axis is effective liquid water content and is the
product of liquid water content and collision efficiency (what
fraction of the supercooled water droplets colliding with the
target stick and eventually freeze to the target).
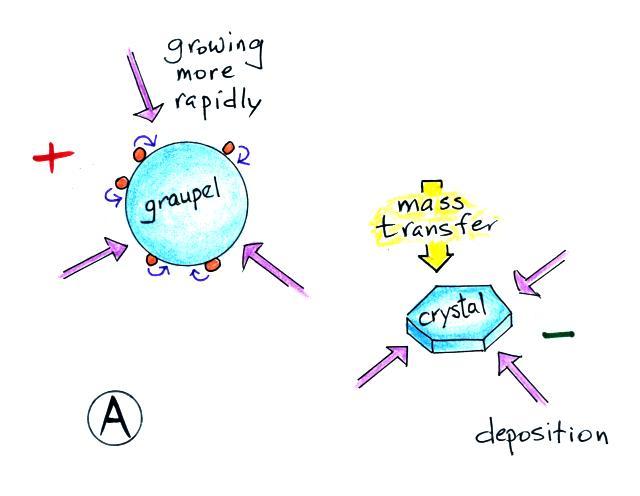
Here is my interpretation of what happens in regions A and
B. The temperature is low in both
cases. The difference is the liquid water content, the
concentration of supercooled water droplets.
Region A
Supercooled droplets
are colliding with and sticking to the graupel particle at a
relatively low rate. That is because of the low
effective liquid water content. The droplets warm as
they release latent heat and try to freeze. The droplets
warm but there isn't enough latent heat energy release to warm
the graupel particle itself. So both the graupel and the
ice crystal are cold and the rates of deposition of water
vapor to the graupel and the ice crystal are about equal (deposition
is the water vapor to ice phase change). The
graupel gets some additional deposition from the warm water
droplets on its surface (the thin purple arrows from the
droplets to the graupel particle in the figure). As a
result the graupel is growing more quickly and has the thicker
quasi liquid layer. Mass transfer during a collision
with an ice crystal is to the ice crystal. The ice
crystal ends up with negative charge, the graupel particle
with positive charge.
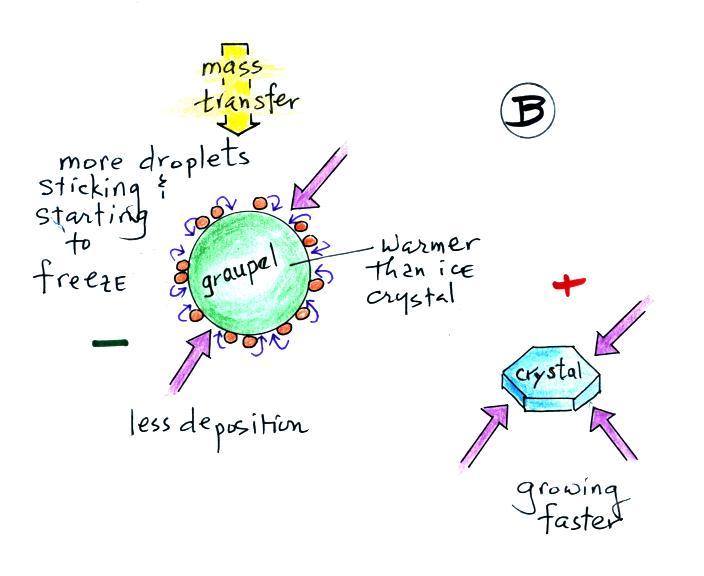
Region B
The effective liquid water content is higher and there are
more supercooled water droplets colliding with and sticking to
the graupel particle. Now as they release latent heat
and try to freeze they are able to warm the graupel
particle. The net rate of deposition from the
surroundings to the graupel particle is reduced (2 arrows are
shown in B versus 3 arrows in A). Even with the
deposition from the droplets on the surface of the graupel
particle, the ice crystal grows more quickly and has the
thicker quasi liquid layer. Mass transfer during a
collision goes to the graupel particle and the graupel
particle ends up with negative charge.
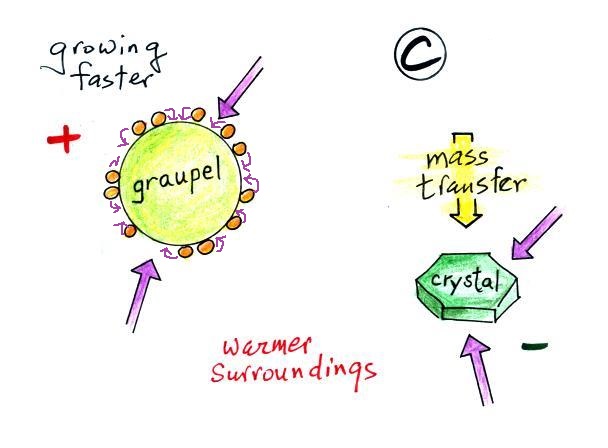
Both the ice crystal and the graupel particle are in warmer
surroundings and the net rate of deposition to each is
reduced. The graupel is warmer than it was in Region
B. Now however the deposition from the accreted water
droplets is increased because it takes them longer to
freeze. The graupel particle grows faster and has the
thicker quasi liquid layer. Mass transfer is to the ice
crystal again and it ends up with negative charge.
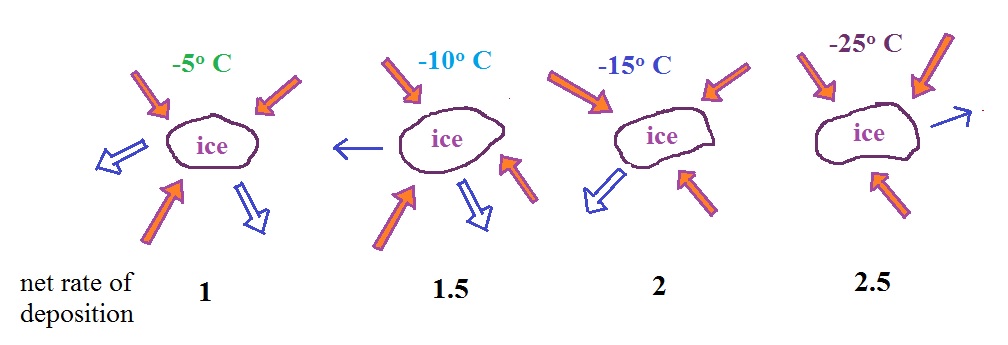
Here's a little clarification about net rate of
deposition added after class. Four particles of ice are
drawn below. The temperature of the surroundings is
different in each case. The rate of deposition (water
vapor turning directly to ice) is largely dependent on the
amount of water vapor in the air surrounding the air
crystals. We'll assume that's the same. Thus I've
drawn in 3 arrows worth of deposition in each case.
Most thunderstorms have the dipolar (or tripolar) charge
distribution as shown below at left. The majority of
cloud to ground (CG) discharges from these types of storms
carry negative charge to ground. Just a few percent of
the CG discharges are positively charged (we'll see though
that these positive CG discharges sometimes have very large
peak currents).
A much larger percentage (50% or more) of positive CG
discharges have been observed coming from some Central Plains
storms in recent field experiments. This would suggest
the clouds might have had an inverted charge distribution like
that shown below at right. And one might wonder whether
a different cloud electrification mechanism is at work
(different from the Reynolds, Brook, Gourley process).
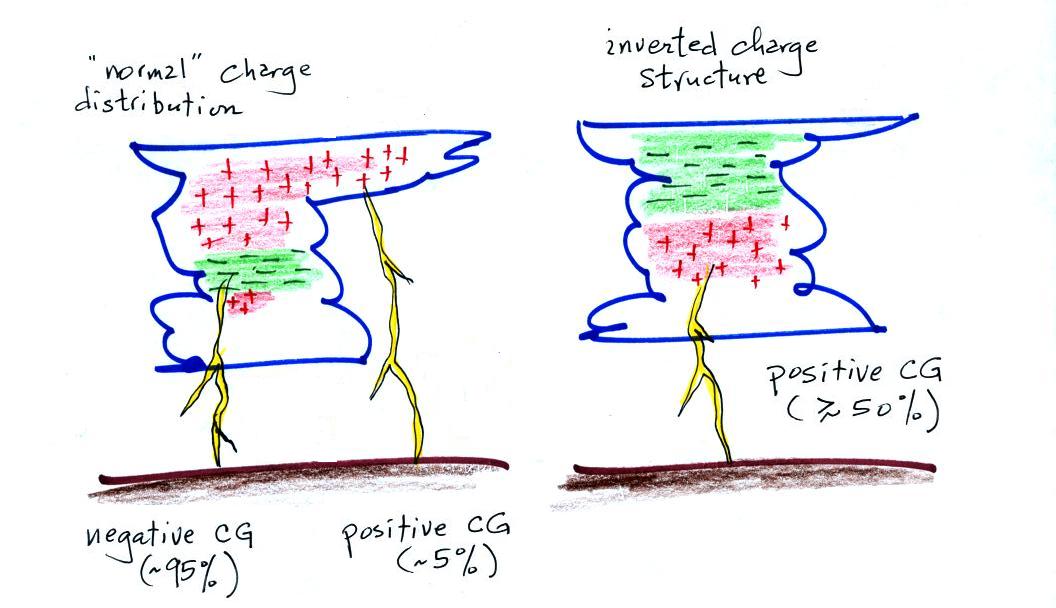
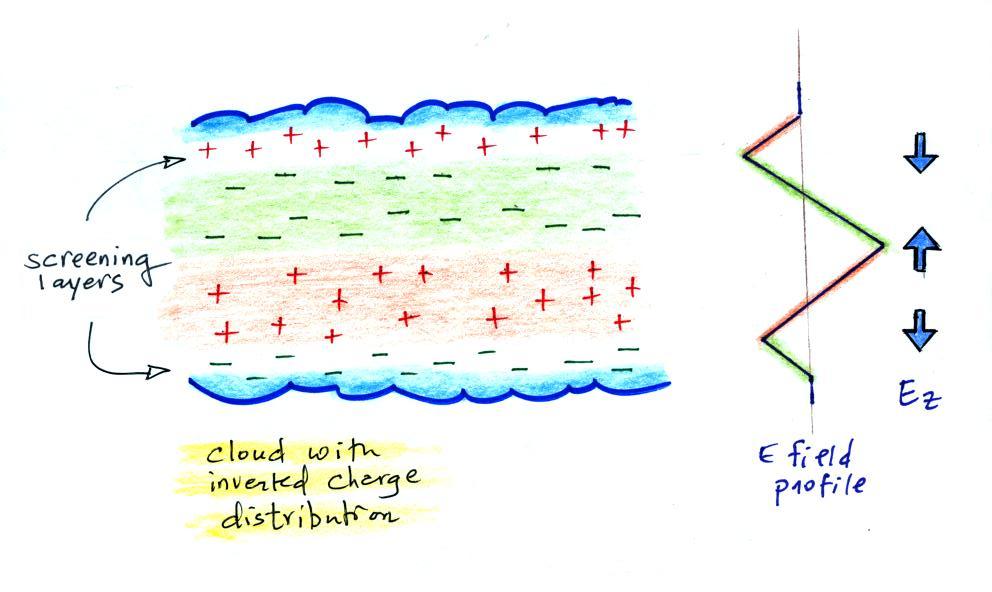
As you move upward from the bottom toward the top of the cloud
you encounter a positively charged screening layer, the main
negative and positive charge centers, and a positive screening
layer at the top of the cloud.
Just the opposite situation was observed in the inverted
polarity clouds. At first glance these clouds would seem
to invalidate the Reynolds, Brook, Gourley process we have
been studying or at least suggest there might be another
process that sometimes is at work.
Follow up studies, however, seem to indicate that the
non-inductive electrification mechanism is capable of
explaining clouds with inverted charge distributions.
This is explained on the figure below
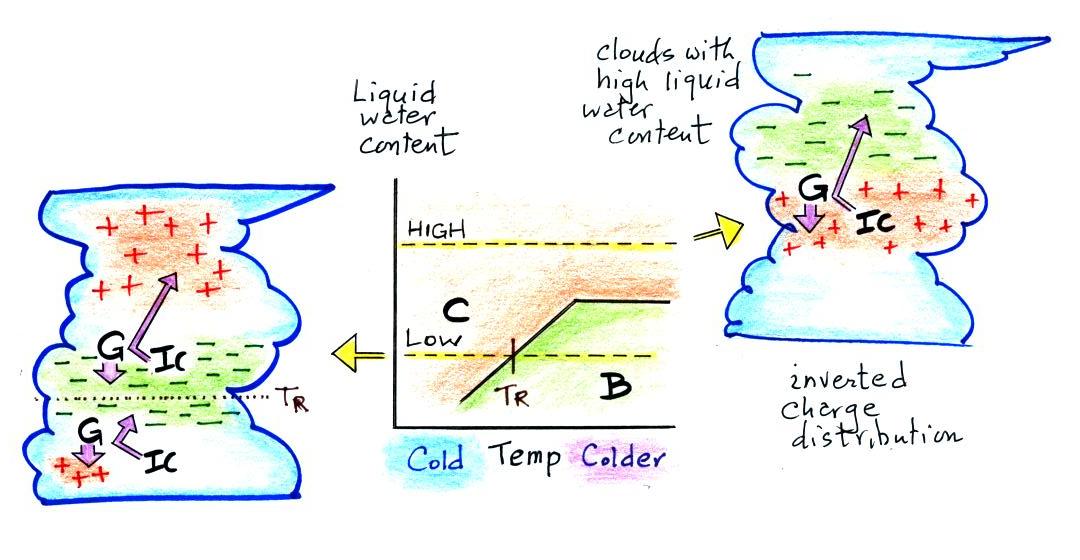
In the center of the figure is the graph that we examined in
some detail earlier in this lecture. It shows the
polarity of charge acquired by a graupel particle colliding
with ice crystals in a laboratory simulation of a cloud
environment containing supercooled water droplets. The
liquid water content on the vertical axis is a measure of the
supercooled droplet concentration.
Liquid water content in a typical cloud would be found near
the level of the lower dotted line on the graph. The
tripolar cloud charge distribution in a typical cloud is shown
at left. High in the cloud where the temperature is
cold, the graupel particle acquires negative charge and the
ice crystals positive charge (region B on the graph).
The ice crystals are carried upward and form the main positive
charge center. The heavier graupel particle descends to
form the main negative charge center. Somewhat lower in
the cloud where temperatures are warmer than TR (the reversal
temperature) but still below freezing the polarity of the
charging changes (region C on the graph). The graupel
ends up with positive charge and the ice crystals with
negative charge. The positively charged graupel form the
lower positive charge centers.
It seems that the unusual Central Plains storms have very high
liquid water contents. If we look at the level of the
upper dotted line on the charging graph in the center of the
figure we see that the graupel particle always ends up with
positive charge in this high LWC environment. There is
no charge reversal temperature. The Reynolds, Brook,
Gourley mechanism can account for clouds with inverted charge
distributions. That would seem to be further validation
of this process (and of the laboratory results from UMIST).
References:
W.D.
Rust and D.R. MacGorman, "Possibly inverted-polarity
electrical structures in thunderstorms during STEPS,"
Geophys. Res. Lett., 29, 1571, 10.1029/2001GLO14303, 2002
W.D.
Rust, D.R. MacGorman, E.C. Bruning, S.A. Weiss, P.R.
Krehbiel, R.J. Thomas, W. Rison, T. Hamlin, J. Harlin,
"Inverted-polarity electrical structure in thunderstorms in
the Severe Thunderstorm Electrification and Precipitation
Study (STEPS), Atmos. Res., 76, 247-271, 2005
T.J.
Lang, and 17 additional authors, "The Severe Thunderstorm
Electrification and Precipitation Study," Bull. Am.
Meteorol. Soc., 2004.