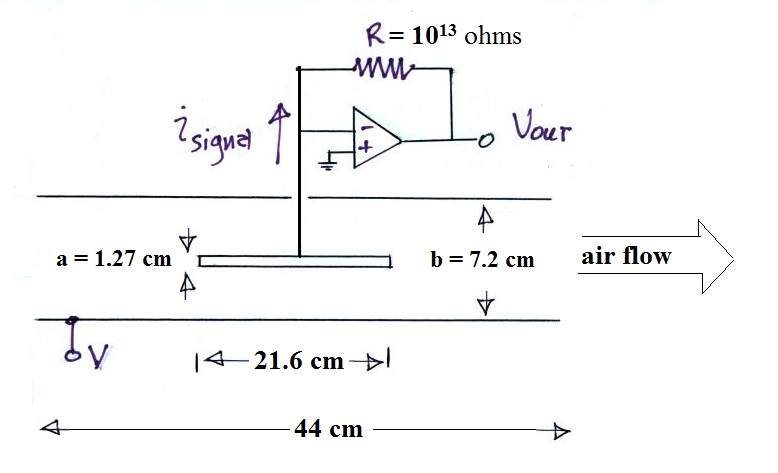
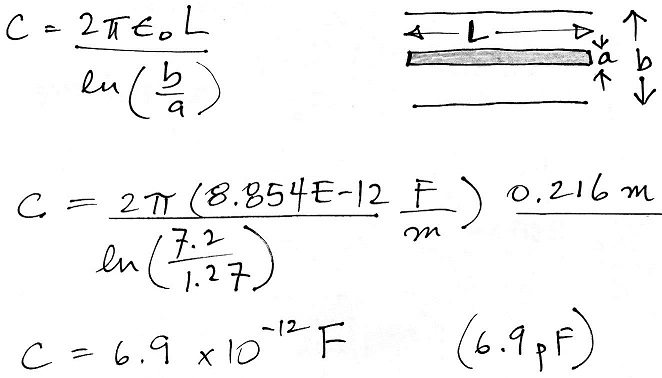
Here's a schematic of the instrument with
some actual dimensions added. We'll need
those later to estimate the capacitance.
The next two tables contain the data that was collected. The first table has measurements made with the outer cylinder connected to 0 v, +5 v, +10 v and +15 volts (this is referred to as the bias voltage in the table). In this case positively charged small ions would drift in toward the center electrode and would be collected. This would produce a signal current as shown in the figure and should result in a negative polarity output voltage (because the current is connected to the inverting input of the operational amplifier). Two sets of measurements were collected. The first set, in green, are on the left side of the table. The second set is on the right. I also tried some higher bias voltages, but the output signal wouldn't settle down to a constant value.
The offset voltage was first subtracted from the measured Vout voltage. Then signal current was determined by dividing the (Vout-Voffset) value by the 1013 ohm resistance in the amplifier feedback loop.
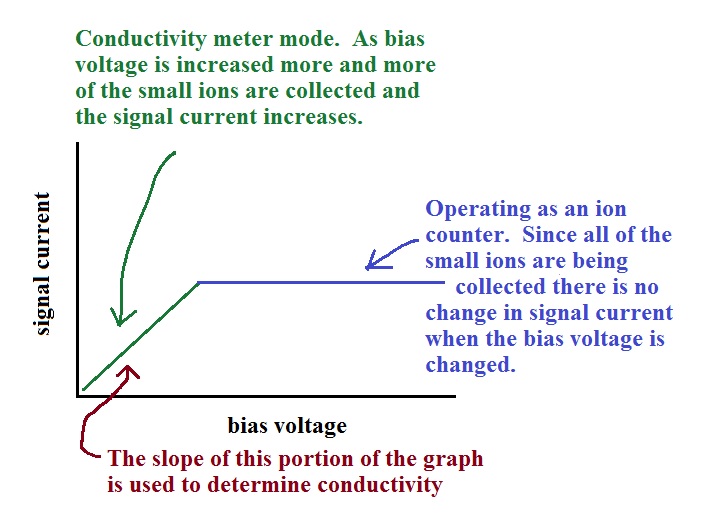
The fact that we see different signal currents for different bias voltage indicates that the instrument is operating as a conductivity meter.
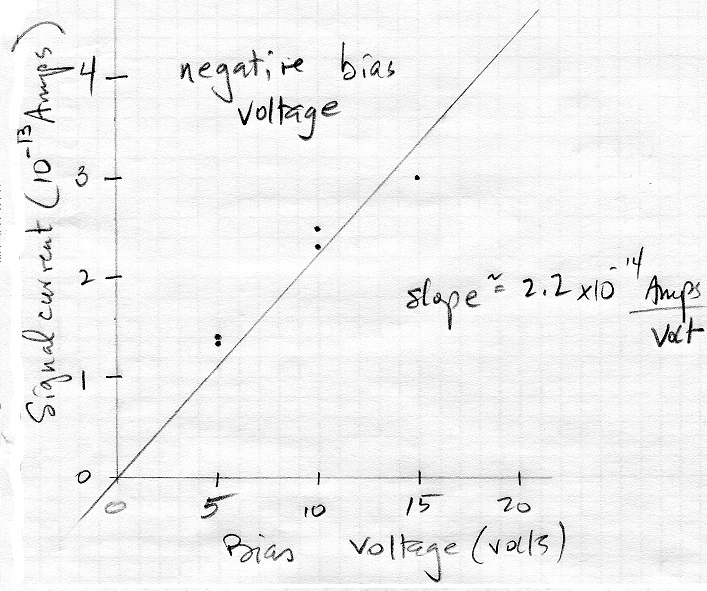
The second table contains data collected when the bias voltage was negative.
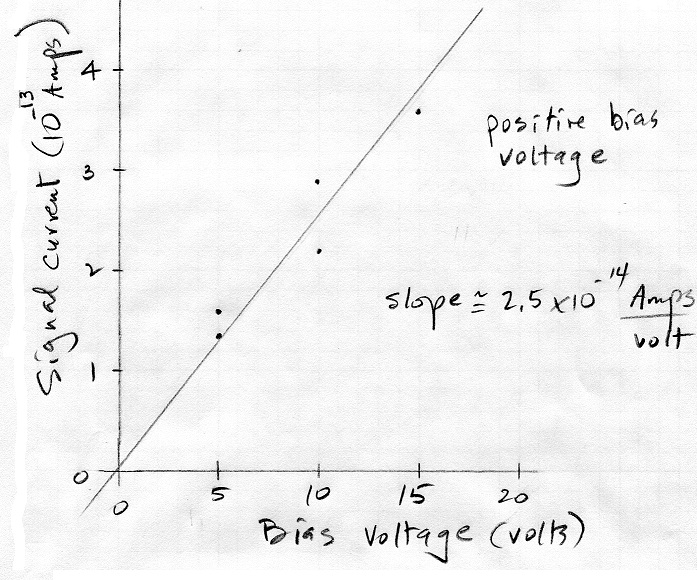
The measured values of signal current are plotted versus bias voltage in the two graphs below.
The slope is nearly the same in both cases.
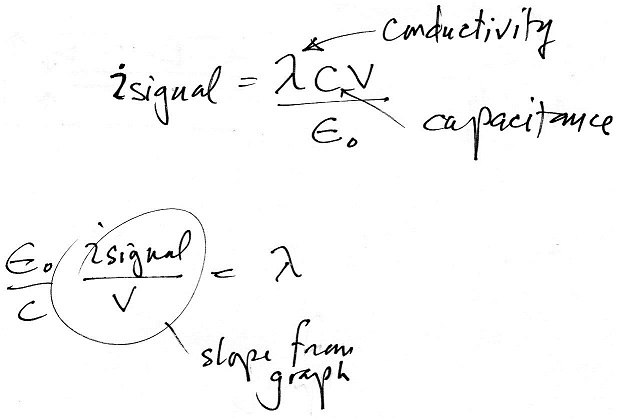
Next we'll recall the expression relating conductivity, λ , and the measured signal current and bias voltage.
The next two tables contain the data that was collected. The first table has measurements made with the outer cylinder connected to 0 v, +5 v, +10 v and +15 volts (this is referred to as the bias voltage in the table). In this case positively charged small ions would drift in toward the center electrode and would be collected. This would produce a signal current as shown in the figure and should result in a negative polarity output voltage (because the current is connected to the inverting input of the operational amplifier). Two sets of measurements were collected. The first set, in green, are on the left side of the table. The second set is on the right. I also tried some higher bias voltages, but the output signal wouldn't settle down to a constant value.
Table I Positive bias voltage
| Bias voltage (volts) |
Vout (volts) |
Vout - Voffset (volts) |
signal current |
Vout (volts) |
Vout - offset (volts) |
signal current |
| 0 |
+0.6 v (this is the
offset voltage) |
+0.8 (this is the offset voltage) |
||||
| +5 |
-1.0 |
-1.6 |
1.6 x 10⁻¹³ amps | -0.55 |
-1.35 |
1.35 x 10⁻¹³ amps |
| +10 |
-1.6 |
-2.2 |
2.2 |
-2.1 |
-2.9 |
2.9 |
| +15 |
-3.0 |
-3.6 |
3.6 |
|||
The offset voltage was first subtracted from the measured Vout voltage. Then signal current was determined by dividing the (Vout-Voffset) value by the 1013 ohm resistance in the amplifier feedback loop.
The fact that we see different signal currents for different bias voltage indicates that the instrument is operating as a conductivity meter.
The second table contains data collected when the bias voltage was negative.
Table II Negative bias voltage
| Bias voltage (volts) |
Vout (volts) |
Vout - Voffset (volts) |
signal current |
Vout (volts) |
Vout - offset (volts) |
signal current |
| 0 |
+1.0 v (this is the
offset voltage) |
+0.6 (this is the offset voltage) |
||||
| -5 |
+2.35 |
+1.35 |
1.35 x 10⁻¹³ amps | +2.0 |
+1.4 |
1.4 x 10⁻¹³ amps |
| -10 |
+3.3 |
+2.3 |
2.3 |
+3.3 |
+2.5 |
2.9 |
| -15 |
+4.0 |
+3.0 |
3.0 |
|||
The measured values of signal current are plotted versus bias voltage in the two graphs below.
 |
 |
The slope is nearly the same in both cases.
Next we'll recall the expression relating conductivity, λ , and the measured signal current and bias voltage.
We need to calculate the
capacitance. The details are shown below.
We now have all the information we
need to determine the conductivity. And remember
we're only determining λ+
or λ-
depending on the polarity of the bias voltage (only
the positively or negatively charged small ions are
collected by the inner sensor electrode at one time).
Here are the details of the calculation:
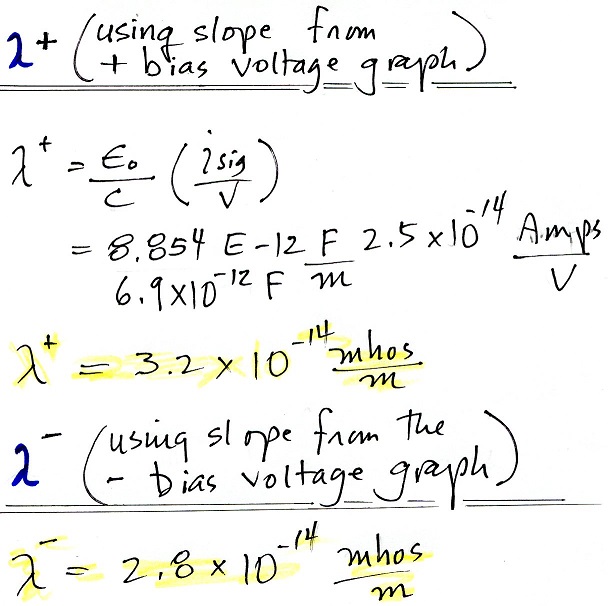
We end up with values of about 3 x 10-14 mhos/m, very reasonable values (I was honestly somewhat surprised that everything turned out so well).
We end up with values of about 3 x 10-14 mhos/m, very reasonable values (I was honestly somewhat surprised that everything turned out so well).