Sprites, blue jets, and elves
The preferred term for these types of events is Transient Luminous Event (TLE).
In a 1924 paper, C.T.R. Wilson (of cloud chamber fame and co-winner of the 1927 Noble Prize in Physics) suggested that "The electric field of the [thunderstorm] cloud may cause ionization at great heights..." "At a height of 60 km, the density of the air is about 1.6 x 10⁻⁴ of that near the ground, while the composition of the air is not very different, so that the critical value of the field may be taken as about 30,000 x 1.6 x 10-4 = 4.8 volts per centimetre."
Despite many reports of optical phenomena high above thunderstorms (often from pilots flying at night), credit for the first photographic evidence of these kinds of phenomena is given to John Winckler, a researcher at the University of Minnesota. On the night of July 6, 1989 he was testing a low light level video camera and later found two images of sprites on the video he had recorded (ref).
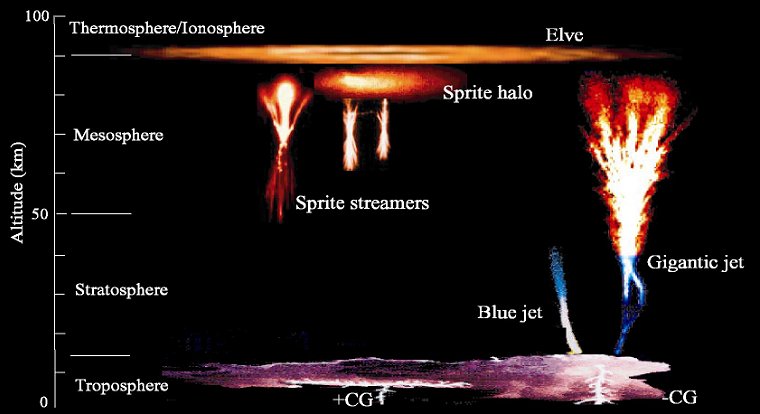
Here's a pretty good figure summarizing the various types of luminous event (source of the figure: https://sciences-techniques.cnes.fr/fr/web/CNES-fr/9124-gp-le-satellite-taranis-va-etudier-la-foudre.php. CNES is the French Centre National d'Etudes Spatiales; they are planning to launch a satellite in 2018 to observe high-altitude lightning and TLEs from earth orbit.
Sprites
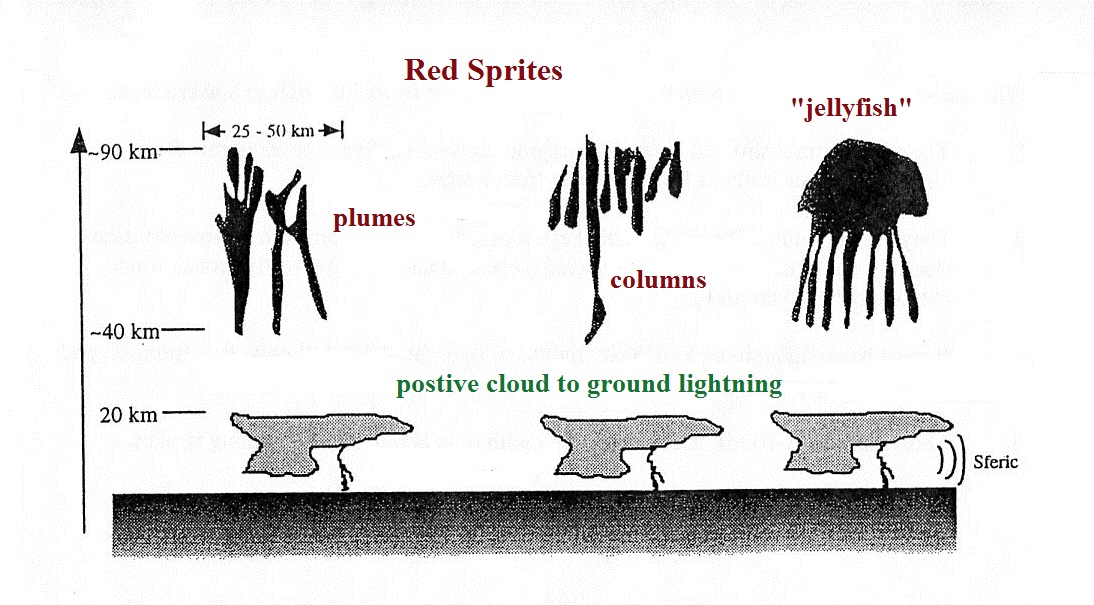
The following figure is adapted from a review article by Rodger (1999) and shows some of the forms sprites may take:
Sprites are dim and hard to see with the naked eye. Here are some suggestions that will improve your chances of observing one (adapted from http://elf.gi.alaska.edu/#intro; this site at the Geophysical Institute at the University of Alaska Fairbanks may not be available):
Sprite videos:
sprite movie (Univ. AK, Geophys. Inst.)
sprite in slow motion (H.H.C. Stenbaek-Nielsen, U. Alaska Fairbanks, DARPA, NSF)
sprite movie high speed video (NM Tech)
sprite movie high speed video (NM Tech)
here are some spectacular pictures and videos (not sure how to cite this page)
PBS Nova program "At the Edge of Space" (52:39)
Some of my favorite pictures are still images (especially ones that include the foreground and surroundings)
Mike Hollingshead (Astronomy Picture of the Day)
Sprite with Aurora (Walter Lyons and an Astronomy Picture of the Day)
A hard to spot sprite viewed from the International Space Station (ISS Expedition 31 crew, NASA)
sprite (National Geographic) (click here if the link is slow to respond)
sprite (Geospace Physics Laboratory, Florida Inst. of Tech.)
sprite (WDRB.com)
sprite (Weatherscapes)
The following link was sent to me by Mike Leuthold last Friday:
https://www.instagram.com/p/BPXXv6TjCYk/?utm_content=buffer70320&utm_medium=social&utm_source=twitter.com&utm_campaign=buffer
Blue jets
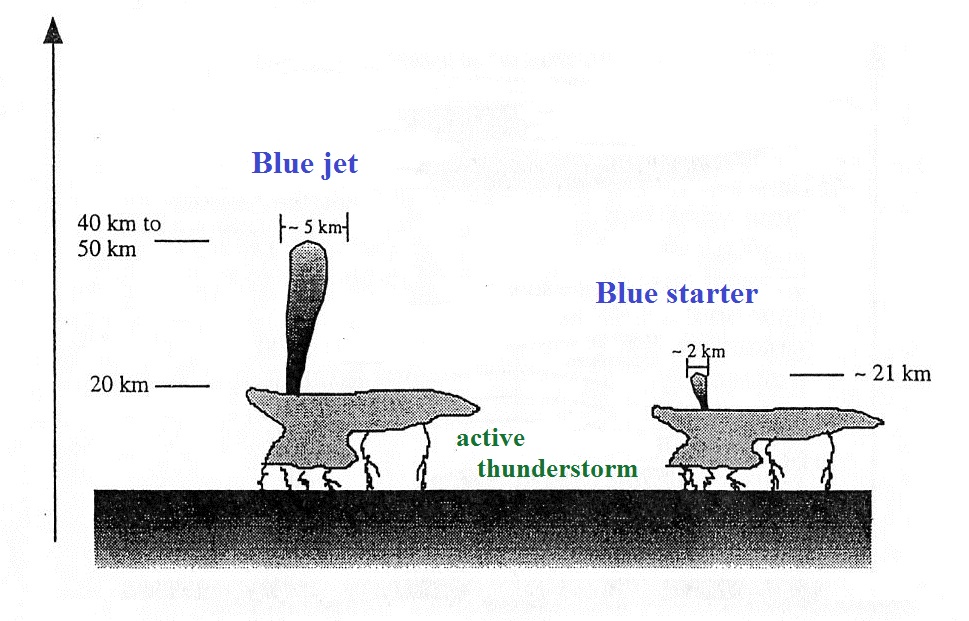
These begin and extend upward from the tops of thunderstorms. Characteristics of blue jets and blue starters are shown below (from Rodger 1999).
It is still not clear what produces blue jets, they do not
necessarily follow directly after a lightning discharge.
The propagate upward at about 1 x 10⁵ m/s.
The deep blue color, which is more readily scattered by air,
makes them difficult to see and photograph. Some
characteristics of blue jets are shown below (from Rodger,
(1999)).
blue jet videos
blue jet movie (Univ. AK, Geophys. Inst.)
still photographs
blue jet (PBS Nova)
Stanford University photograph (this might be an example of a giant blue jet)
blue jet photographed above a thunderstorm in the Northern Territory, Australia (Thijs Bors published in The Telegraph)
blue jet on St. Barth (credit: Elka Liot, Muskapix Gregory Moulard. "St. Barth" refers to Saint Barthelemy a French Overseas Collectivite Territoriale in the Carribean. Together with Saint Martin, Guadeloupe, and Martinique it is part of the French West Indies)
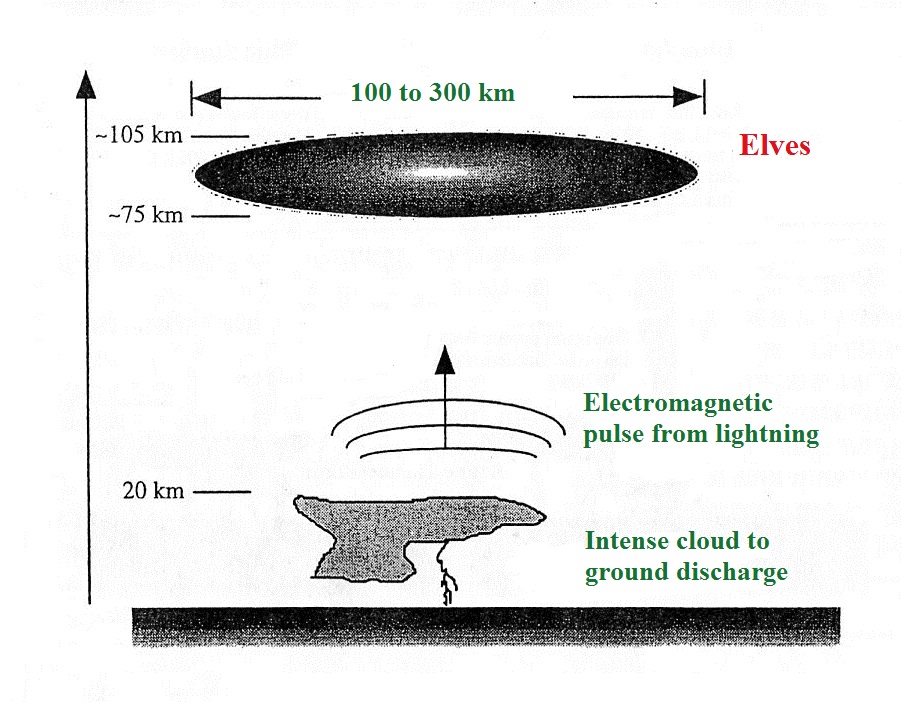
Elves
The name is an acronym for Emission of Light and Very Low Frequency Perturbations Due to Electromagnetic Pulse Sources.
Videos of Elves
Blue jets, Sprites, and Elves (New Scientist video)
Thunder
Early in a return stroke, pressure in the channel is several times (maybe a few 10s of times) atmospheric pressure. The lightning channel expands rapidly outward initially as a shock wave. Much of the energy in a lightning stroke is dissipated during the formation and outward growth of the shock wave. The shock wave expands outward a few meters in 10s of microseconds and quickly decays into the sound wave that we eventually hear as thunder.
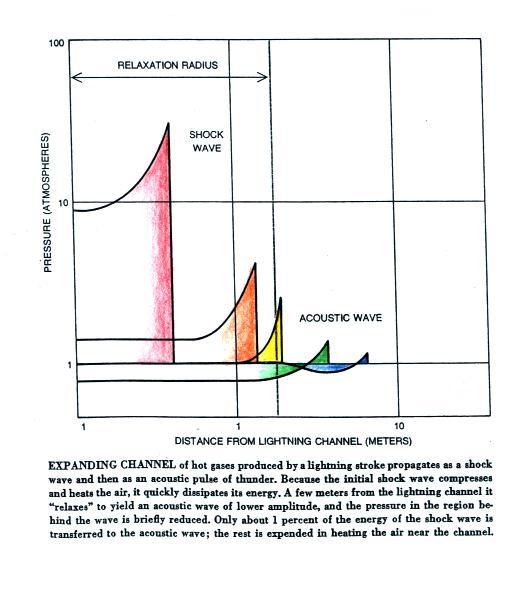
This figure (this and the next two figures are from an
article on Thunder by A.A. Few that appeared in "The Physics
of Everyday Phenomena", Readings from Scientific American,
W.H. Freeman & Co, San Francisco, 1979) shows the
transition from shock wave to sound wave. The size of
the channel when this occurs (a few meters) is referred to as
the relaxation radius. Channel tortuosity features that
are smaller than the relaxation radius are swallowed up by the
shock wave and don't really affect properties of the thunder
such as frequency.
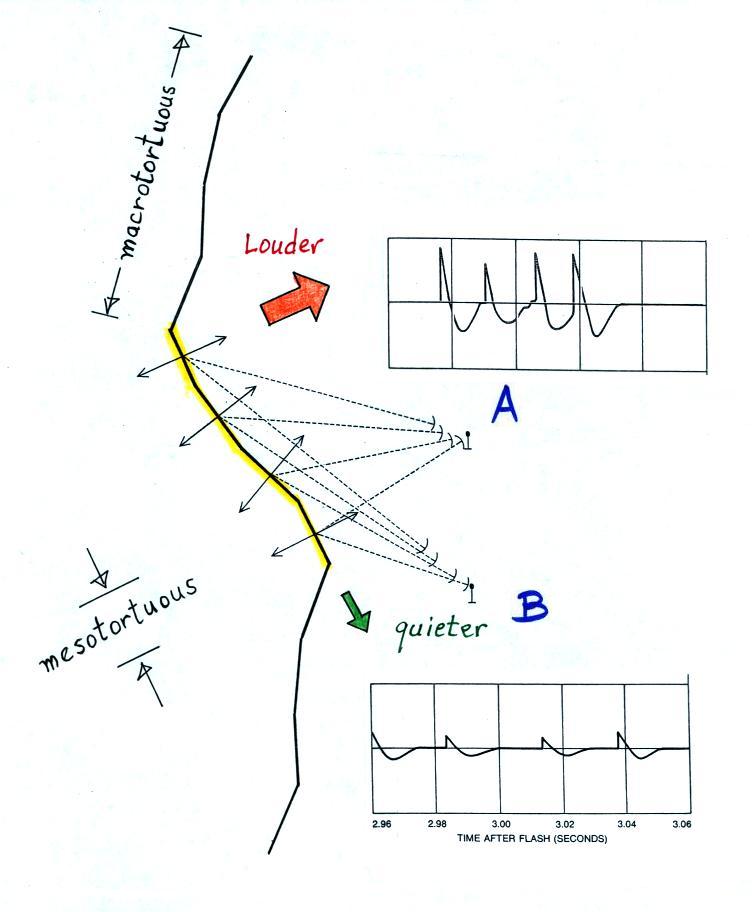
Lightning channels consist first of mesotortuous segments that are 5 to a few 10s of meters long. Several of these positioned end-to-end and oriented in about the same direction form a macrotortuous segment which is a 100 or a few 100s of meters long. The variation of sounds that are heard during thunder are determined primarily by your orientation relative to the mesotortuous elements. Sounds emitted in a direction that perpendicular to the channel are louder than sounds emitted more nearly parallel to the channel.
Microphone A is located more nearly perpendicularly to the 4 mesotortuous segments highlighted in the figure. Four relatively loud sound pulses arrive in quick succession at microphone A and form a clap of thunder. Microphone B is positioned more nearly end. Weaker impulses arrive at the second microphone over a longer period of time and produce more of a rumble.
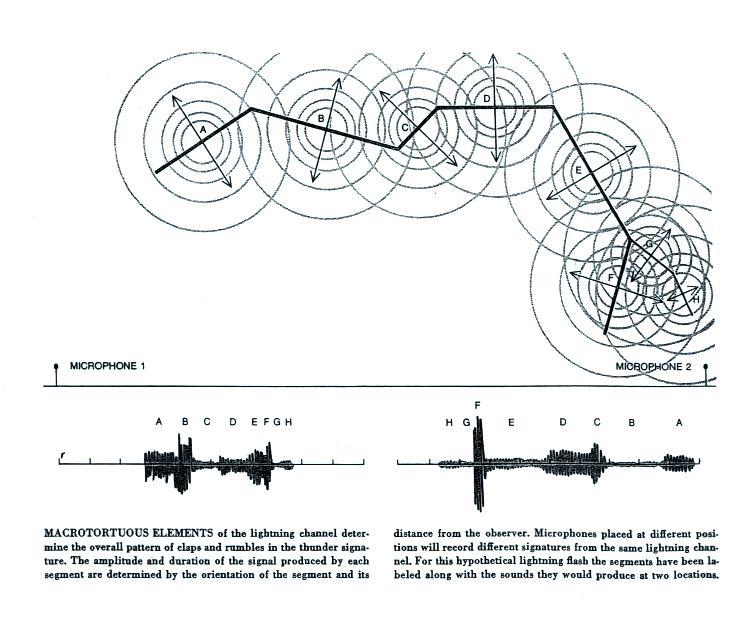
Another, more realistic, illustration of how the pattern of sounds in thunder and the duration of the thunder depend on your location and the geometry of the lightning channel.
It is generally not possible to separate the sounds of the separate return strokes in a thunder record (either by ear or on thunder recordings). A sound that resembles "tearing cloth" has often been reported a split second before the loud clap of thunder from a close lightning strike. When I mention this in the lecture version of this class, most students agree that they have heard something like this. The cause of that sound is not known.
At the start of today's notes I mentioned that thunder is one of the loudest sounds in nature. Because the intensity of sound can vary and is audible over a very wide range it is common to express the intensity of sound in decibel (dB) units.
Pref in the equation above is 2 x 10⁻¹⁰ bar (normal atmospheric pressure is approximately 1 bar).
The chart below (compiled from a variety of sources) lists the intensities of some common sounds.
Here's an interesting article "The Loudest Sound in the World Would Kill you on the Spot." The article mentions that the sound of the explosion of Krakatoa in August 1883 traveled around the globe multiple times. The article also extends the table above to just over 200 dB (standing next to the Saturn V rocket that carried the Apollo vehicle into orbit).
Thunder duration is examined is a bit more detail in the next figure (from: M.A. Uman, The Lightning Discharge, Ch. 15, Academic Press, Orlando, 1987).
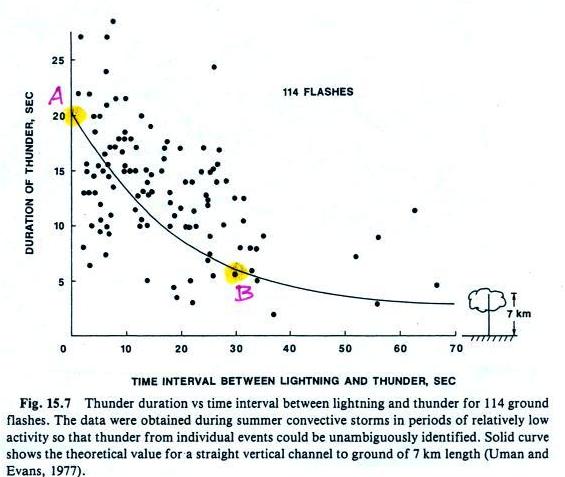
The points on the graph shows actual measurements of thunder duration from discharges at different distances from the observer. The solid line is a calculation of thunder duration from a vertical lightning channel 7 km tall. Points A and B highlighted above refer to the calculations below.
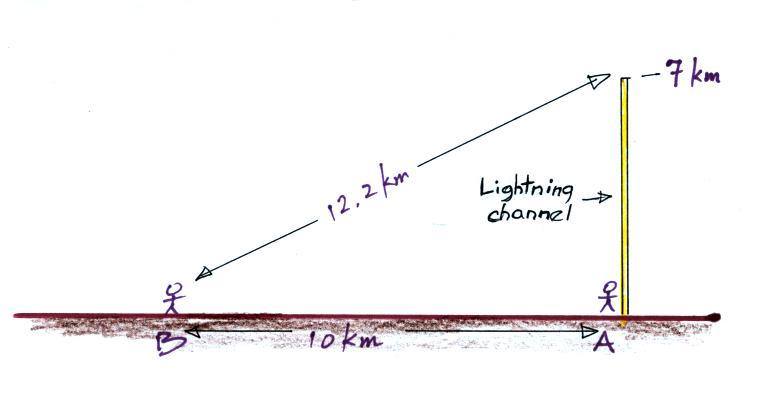
Person A in the figure above will hear the thunder coming
from the bottom of the channel instantaneously. Sound
travels about 340 m/sec in 20 C air (1 km in 3 seconds, 1 mile
in approximately 5 seconds), so the sound from the top of the
channel will arrive about 21 seconds later. That's a
duration of 21 seconds.
The observer at Point B will hear the thunder from the bottom of the channel 30 seconds after the lightning strike. The bottom of the channel is 10 km away from the observer. The top of the channel is 12.2 km away, so thunder coming from the top of the channel will arrive about 6.6 seconds later than the sound coming from the bottom of the channel (3 seconds/km x 2.2 km). The thunder only lasts for about 6.5 seconds at Point B.
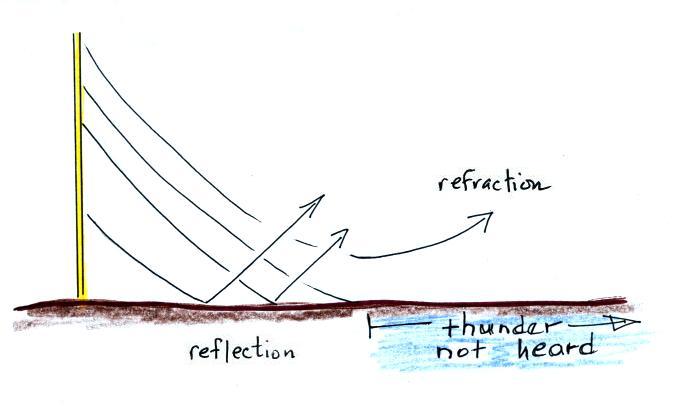
Wind can affect the sound of thunder and refraction can mean there is a distance beyond which thunder is not heard
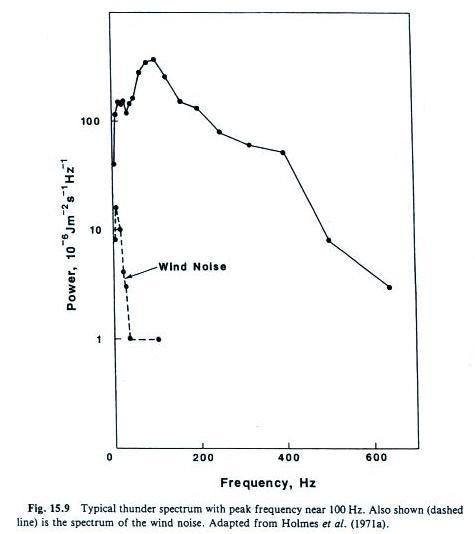
This first plot is actually a distribution of peak values in sound spectra. Interestingly a portion of the distribution is below 20 Hz and is inaudible; this is infrasound.
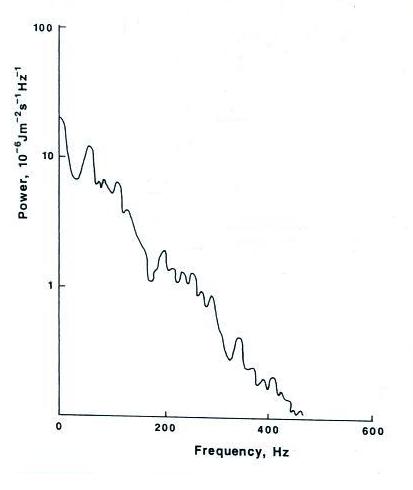
This is the spectrum from a single discharge. The peak in the spectrum is near 100 Hz.
An example of a sound spectrum (lower right corner) that actually peaks in the infrasound.
Up to this point we have explained thunder as being due to the explosive expansion of a hot lightning channel. This may not be the cause of all of the emissions at infrasonic frequencies. Some researchers have suggested that a sudden change in the cloud electrostatic field caused by a lightning discharge might be the cause of the very low frequency infrasonic emissions.
References
C.J. Rodger, "Red Sprites, Upward Lightning, and VLF Perturbations," Reviews of Geophysics, 37, 317-336, 1999
M.A. Dayeh, N.D. Evans, S.A. Fuselier, J. Trevino, J. Ramaekers, J.R. Dwyer, R. Lucia, H.K. Rassoul, D.A. Kotovsky, D.M. Jordan, and M.A. Uman, "First images of thunder: Acoustic imaging of triggered lightning," Geophys. Res. Lett., 42, 6051-6057, 2015.
The preferred term for these types of events is Transient Luminous Event (TLE).
In a 1924 paper, C.T.R. Wilson (of cloud chamber fame and co-winner of the 1927 Noble Prize in Physics) suggested that "The electric field of the [thunderstorm] cloud may cause ionization at great heights..." "At a height of 60 km, the density of the air is about 1.6 x 10⁻⁴ of that near the ground, while the composition of the air is not very different, so that the critical value of the field may be taken as about 30,000 x 1.6 x 10-4 = 4.8 volts per centimetre."
Despite many reports of optical phenomena high above thunderstorms (often from pilots flying at night), credit for the first photographic evidence of these kinds of phenomena is given to John Winckler, a researcher at the University of Minnesota. On the night of July 6, 1989 he was testing a low light level video camera and later found two images of sprites on the video he had recorded (ref).
Here's a pretty good figure summarizing the various types of luminous event (source of the figure: https://sciences-techniques.cnes.fr/fr/web/CNES-fr/9124-gp-le-satellite-taranis-va-etudier-la-foudre.php. CNES is the French Centre National d'Etudes Spatiales; they are planning to launch a satellite in 2018 to observe high-altitude lightning and TLEs from earth orbit.
Sprites
The following figure is adapted from a review article by Rodger (1999) and shows some of the forms sprites may take:
And some general characteristics of red
sprites (from the Rodger (1999) paper).
Sprites seem to follow positive cloud to ground
discharges.
| Color |
red |
| Minimum altitude |
50 km (tendrils < 40 km) |
| Maximum altitude |
90 km |
| Width (km) |
25 - 50 km (columns >2 km) |
| Duration |
5 - 300 ms |
| Association with lightning |
positive cloud-to-ground (ELF slow
tail) |
| Occurrence rate |
1 in 40 to 1 in 2.3 |
Sprites are dim and hard to see with the naked eye. Here are some suggestions that will improve your chances of observing one (adapted from http://elf.gi.alaska.edu/#intro; this site at the Geophysical Institute at the University of Alaska Fairbanks may not be available):
| To see a sprite you need an
unobstructed view of the region above an active
thunderstorm. The best viewing distance is about
100 - 200 miles from a storm. The dark adapted eye most readily sees sprites in parfoveal vision (looking out the corner of your eye (rods) rather than looking directly at the sprite (cones which respond better to colors)). It must be very dark, no city light, no twilight. Cloud illumination from lightning activity may be too bright or may be distracting. Sprites are very brief (3-10 ms usually). They are produced by only about 1% of lightning strokes. |
Sprite videos:
sprite movie (Univ. AK, Geophys. Inst.)
sprite in slow motion (H.H.C. Stenbaek-Nielsen, U. Alaska Fairbanks, DARPA, NSF)
sprite movie high speed video (NM Tech)
sprite movie high speed video (NM Tech)
here are some spectacular pictures and videos (not sure how to cite this page)
PBS Nova program "At the Edge of Space" (52:39)
Some of my favorite pictures are still images (especially ones that include the foreground and surroundings)
Mike Hollingshead (Astronomy Picture of the Day)
Sprite with Aurora (Walter Lyons and an Astronomy Picture of the Day)
A hard to spot sprite viewed from the International Space Station (ISS Expedition 31 crew, NASA)
sprite (National Geographic) (click here if the link is slow to respond)
sprite (Geospace Physics Laboratory, Florida Inst. of Tech.)
sprite (WDRB.com)
sprite (Weatherscapes)
The following link was sent to me by Mike Leuthold last Friday:
https://www.instagram.com/p/BPXXv6TjCYk/?utm_content=buffer70320&utm_medium=social&utm_source=twitter.com&utm_campaign=buffer
Blue jets
These begin and extend upward from the tops of thunderstorms. Characteristics of blue jets and blue starters are shown below (from Rodger 1999).
| Color |
deep blue |
| Minimum altitude |
about 20 km |
| Maximum altitude |
40 to 50 km |
| Width (km) |
about 3 km (cone about 15 degrees) |
| Duration |
about 250 ms |
| Occurrence rate |
2.8 per minute (in 22 min.) |
blue jet videos
blue jet movie (Univ. AK, Geophys. Inst.)
still photographs
blue jet (PBS Nova)
Stanford University photograph (this might be an example of a giant blue jet)
blue jet photographed above a thunderstorm in the Northern Territory, Australia (Thijs Bors published in The Telegraph)
blue jet on St. Barth (credit: Elka Liot, Muskapix Gregory Moulard. "St. Barth" refers to Saint Barthelemy a French Overseas Collectivite Territoriale in the Carribean. Together with Saint Martin, Guadeloupe, and Martinique it is part of the French West Indies)
Elves
The name is an acronym for Emission of Light and Very Low Frequency Perturbations Due to Electromagnetic Pulse Sources.
| Color |
. . . |
| Minimum altitude |
75 km |
| Maximum altitude |
105 km |
| Width (km) |
100 - 300 km |
| Duration |
< 1 ms |
| Association with lightning |
intense positive cloud-to-ground (average 148 kA) |
| Occurrence rate |
. . . |
Videos of Elves
Blue jets, Sprites, and Elves (New Scientist video)
Thunder
Early in a return stroke, pressure in the channel is several times (maybe a few 10s of times) atmospheric pressure. The lightning channel expands rapidly outward initially as a shock wave. Much of the energy in a lightning stroke is dissipated during the formation and outward growth of the shock wave. The shock wave expands outward a few meters in 10s of microseconds and quickly decays into the sound wave that we eventually hear as thunder.
Lightning channels consist first of mesotortuous segments that are 5 to a few 10s of meters long. Several of these positioned end-to-end and oriented in about the same direction form a macrotortuous segment which is a 100 or a few 100s of meters long. The variation of sounds that are heard during thunder are determined primarily by your orientation relative to the mesotortuous elements. Sounds emitted in a direction that perpendicular to the channel are louder than sounds emitted more nearly parallel to the channel.
Microphone A is located more nearly perpendicularly to the 4 mesotortuous segments highlighted in the figure. Four relatively loud sound pulses arrive in quick succession at microphone A and form a clap of thunder. Microphone B is positioned more nearly end. Weaker impulses arrive at the second microphone over a longer period of time and produce more of a rumble.
Another, more realistic, illustration of how the pattern of sounds in thunder and the duration of the thunder depend on your location and the geometry of the lightning channel.
It is generally not possible to separate the sounds of the separate return strokes in a thunder record (either by ear or on thunder recordings). A sound that resembles "tearing cloth" has often been reported a split second before the loud clap of thunder from a close lightning strike. When I mention this in the lecture version of this class, most students agree that they have heard something like this. The cause of that sound is not known.
At the start of today's notes I mentioned that thunder is one of the loudest sounds in nature. Because the intensity of sound can vary and is audible over a very wide range it is common to express the intensity of sound in decibel (dB) units.
Intensity = 20 log10 (P/Pref)
Pref in the equation above is 2 x 10⁻¹⁰ bar (normal atmospheric pressure is approximately 1 bar).
The chart below (compiled from a variety of sources) lists the intensities of some common sounds.
| Intensity |
comments |
exposure time limit |
| 140 |
deck of an aircraft
carrier |
|
| 130 |
jet plane at 100 feet sound intensity above this level can cause immediate ear damage |
|
| 120 |
thunder, chain saw |
|
| 110 |
car horn at 1 meter |
1 min |
| 100 |
lawn mower, jack
hammer |
15 min |
| 95 |
1 hour |
|
| 90 |
sounds above this
level regularly cause hearing damage |
2 hours |
| 80 |
garbage disposal,
dishwasher, electric shaver, alarm clock |
|
| 70 |
radio or TV audio |
|
| 60 |
normal conversation |
|
| 0 dB |
threshold of hearing |
Here's an interesting article "The Loudest Sound in the World Would Kill you on the Spot." The article mentions that the sound of the explosion of Krakatoa in August 1883 traveled around the globe multiple times. The article also extends the table above to just over 200 dB (standing next to the Saturn V rocket that carried the Apollo vehicle into orbit).
Thunder duration is examined is a bit more detail in the next figure (from: M.A. Uman, The Lightning Discharge, Ch. 15, Academic Press, Orlando, 1987).
The points on the graph shows actual measurements of thunder duration from discharges at different distances from the observer. The solid line is a calculation of thunder duration from a vertical lightning channel 7 km tall. Points A and B highlighted above refer to the calculations below.
The observer at Point B will hear the thunder from the bottom of the channel 30 seconds after the lightning strike. The bottom of the channel is 10 km away from the observer. The top of the channel is 12.2 km away, so thunder coming from the top of the channel will arrive about 6.6 seconds later than the sound coming from the bottom of the channel (3 seconds/km x 2.2 km). The thunder only lasts for about 6.5 seconds at Point B.
Wind can affect the sound of thunder and refraction can mean there is a distance beyond which thunder is not heard
 |
 |
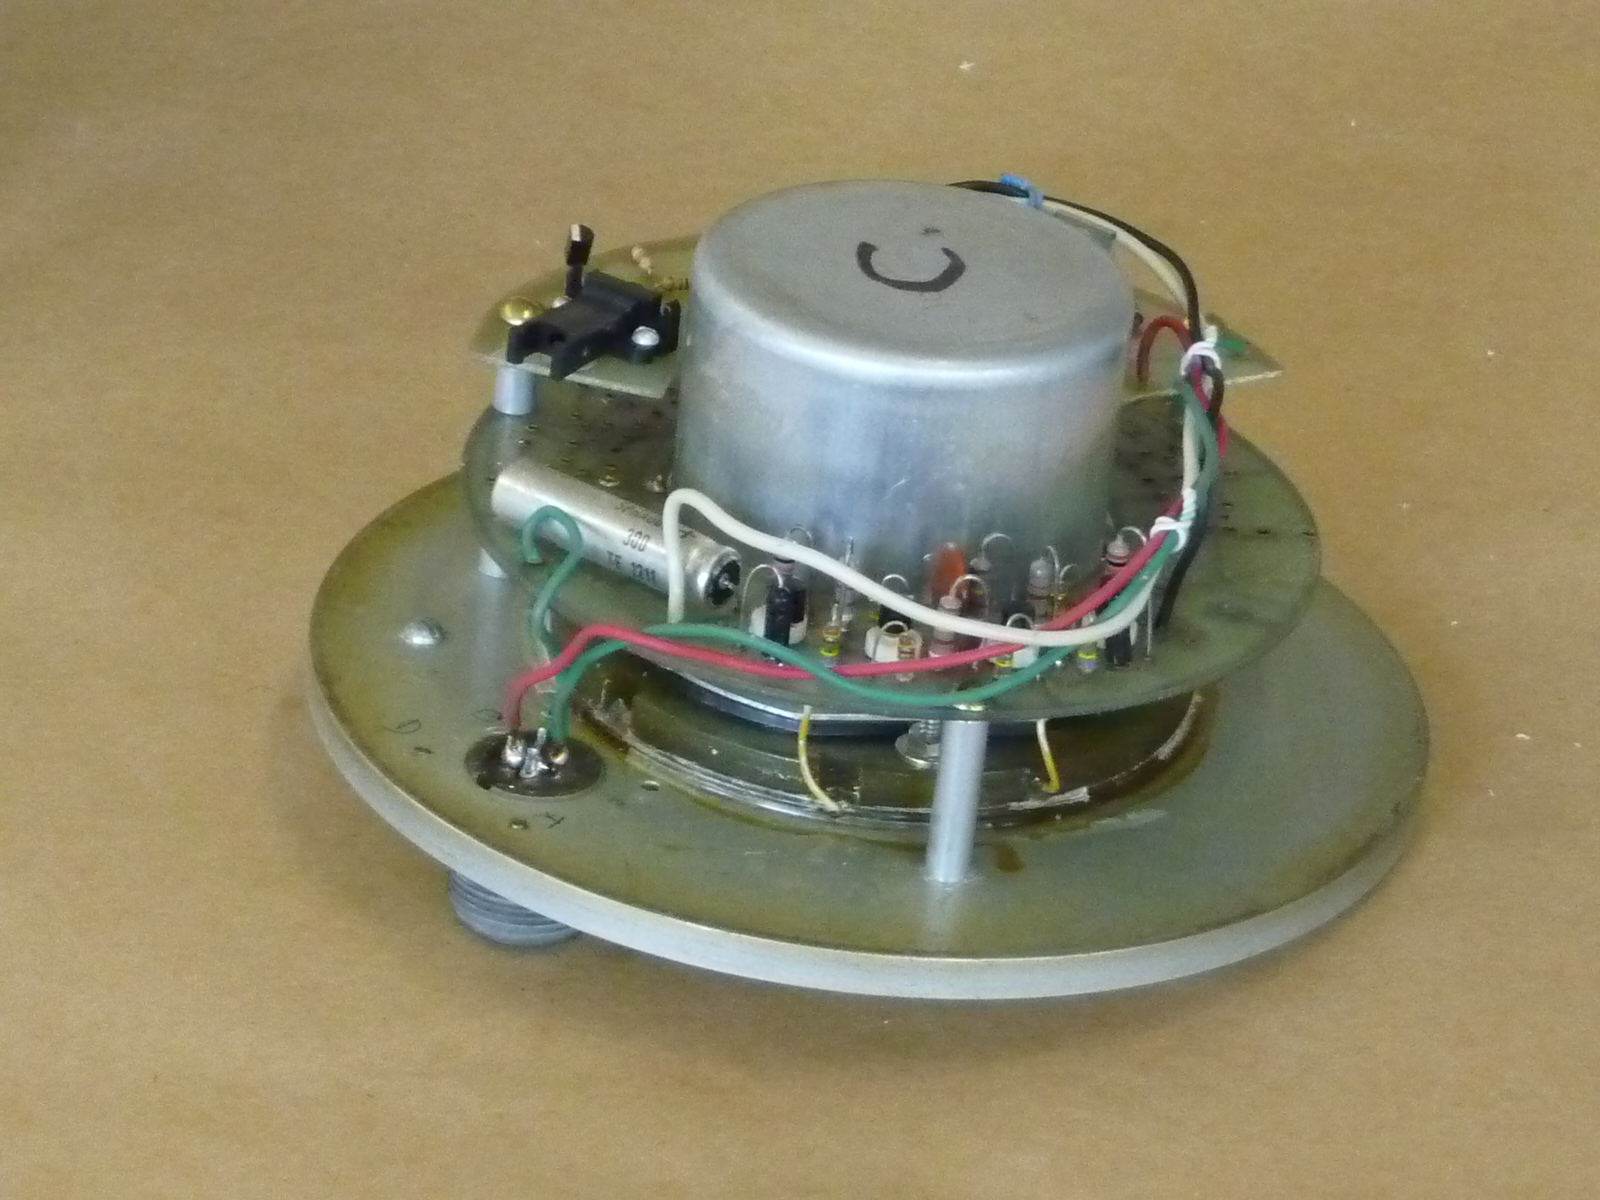 |
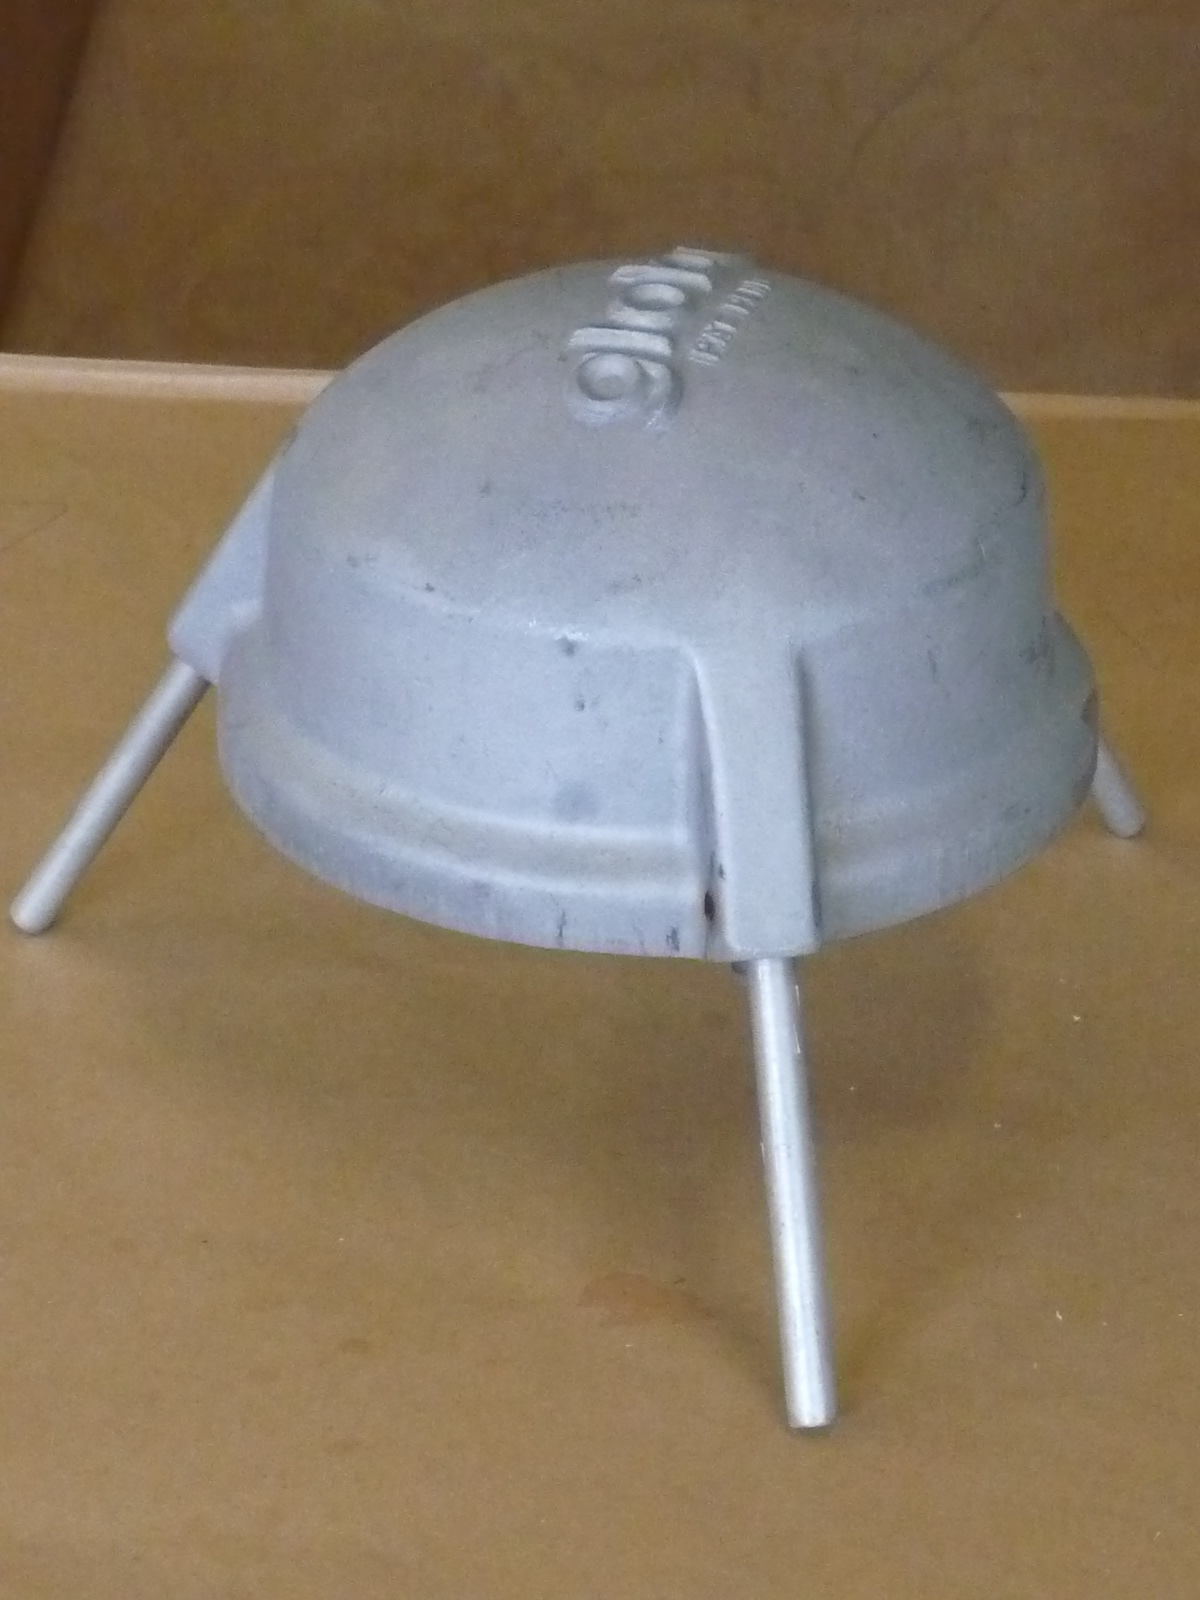
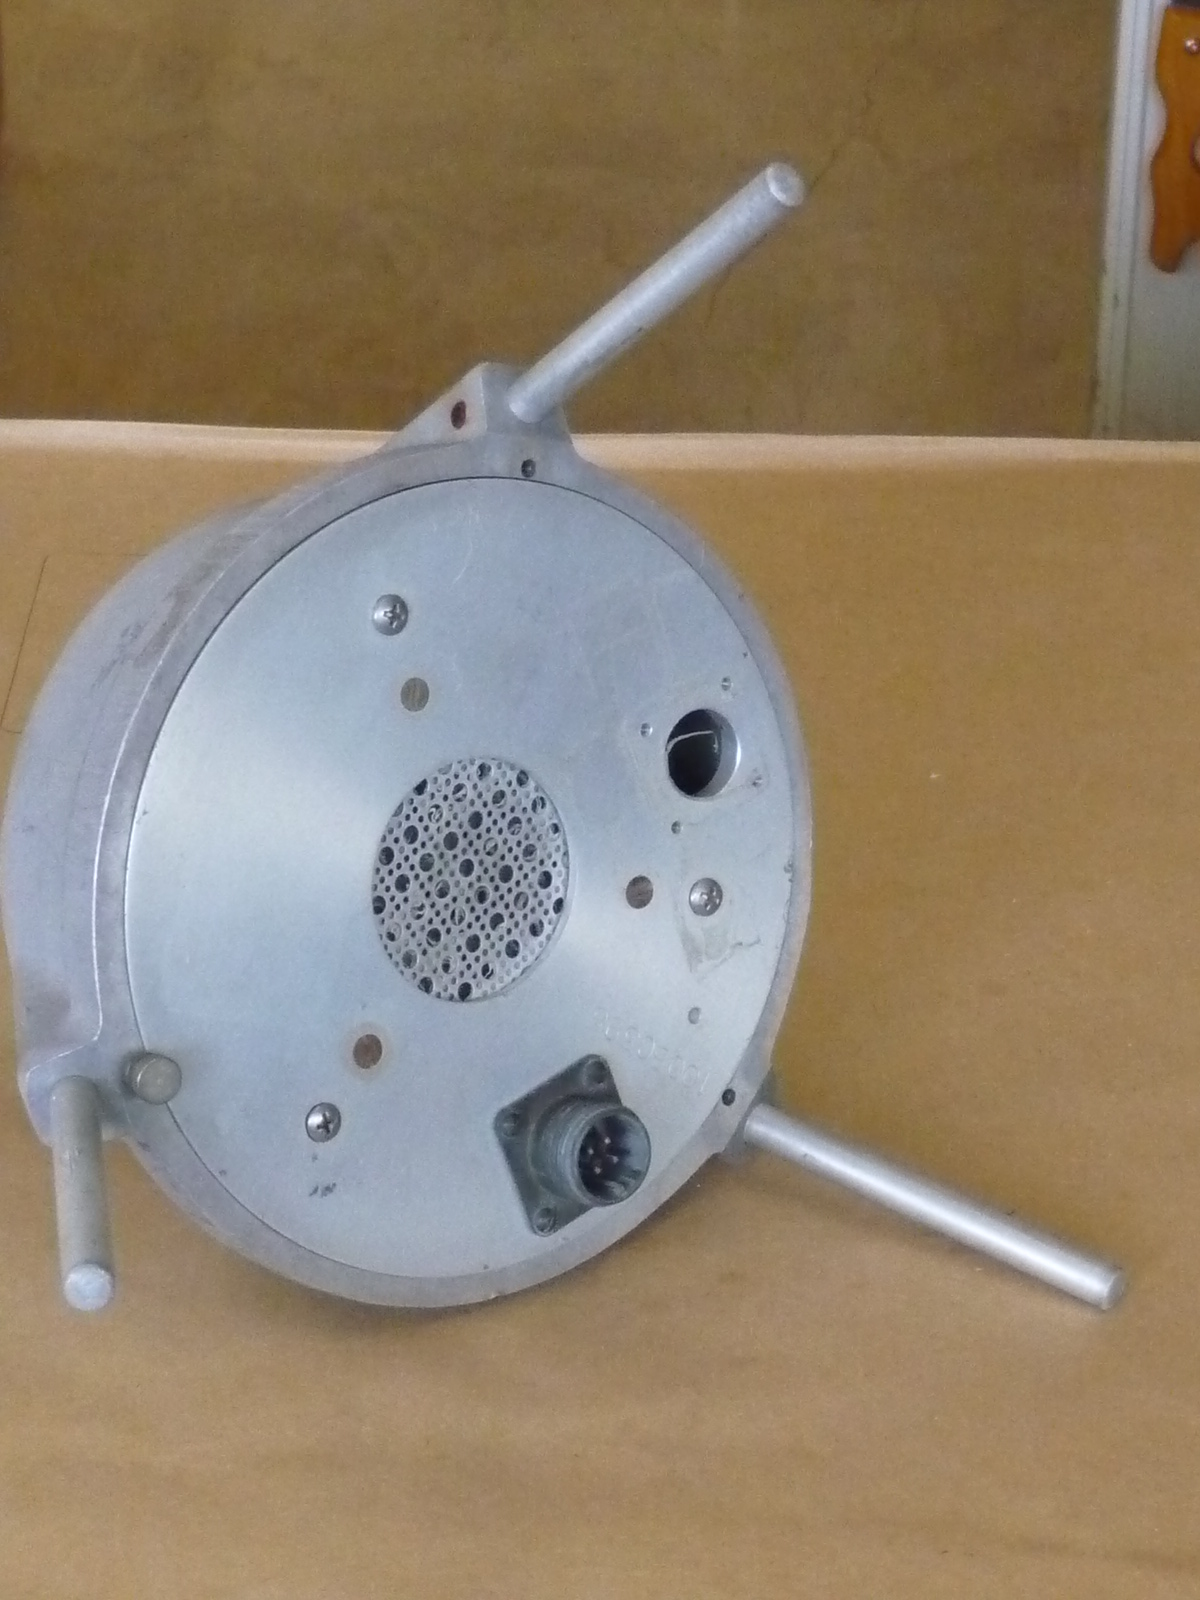
These are pictures of a
microphone that has been used to make thunder measurements
in the infrasonic to low audio frequency range (a Globe
Model 100-B Capacitor Microphone). The microphone
consists of a flexible diaphragm and a metal back plate
which act as plates of a capacitor. The microphone is
normally set up right as shown in the left most figure (the
metal housing is sometimes covered with a "rubberized hair"
wind screen (similar to the "rat's hair" used as a packing
material). The microphone has been turned on its side,
in the center picture, to shown the opening that exposes the
microphone to the pressure changes caused by thunder.
The right most picture shows the microphone electronics.
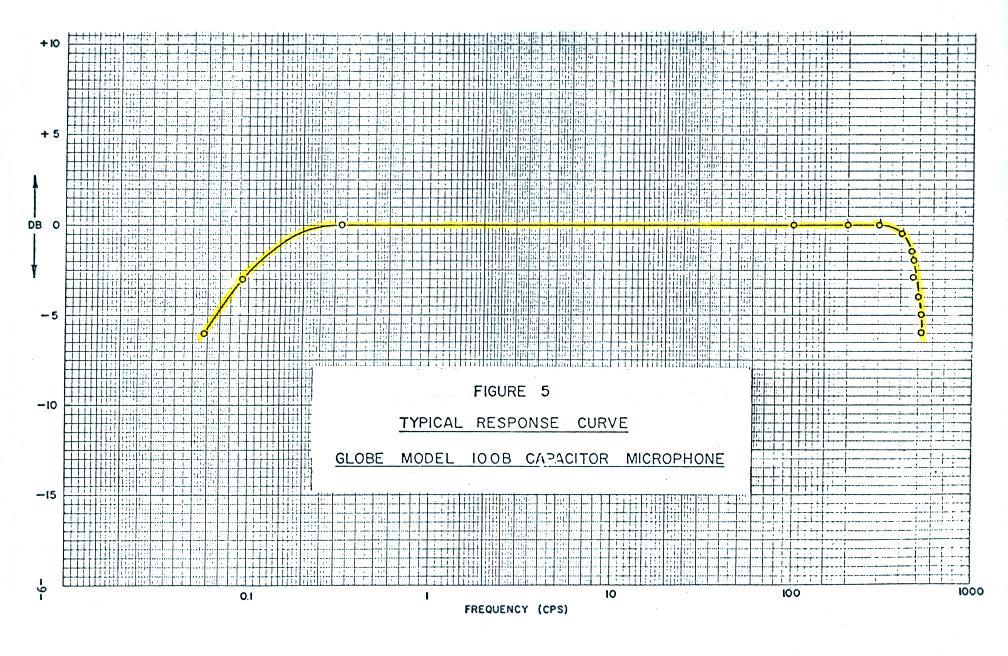
Calibrated response of the Globe capacitor microphone. The microphone response is flat from about 0.5 Hz to about 300 Hz.
Calibrated response of the Globe capacitor microphone. The microphone response is flat from about 0.5 Hz to about 300 Hz.
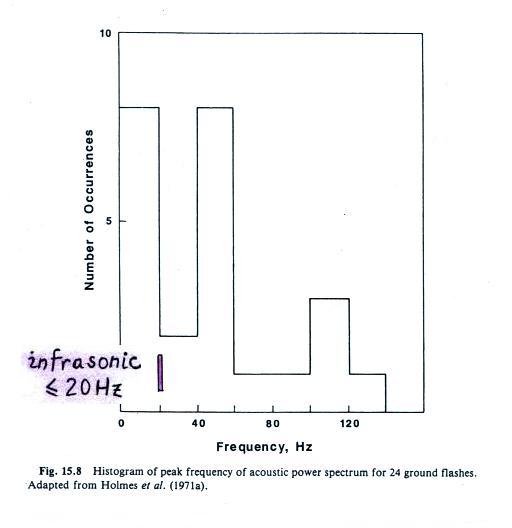
Here are three plots of
the measured thunder frequency spectra
This first plot is actually a distribution of peak values in sound spectra. Interestingly a portion of the distribution is below 20 Hz and is inaudible; this is infrasound.
This is the spectrum from a single discharge. The peak in the spectrum is near 100 Hz.
An example of a sound spectrum (lower right corner) that actually peaks in the infrasound.
Up to this point we have explained thunder as being due to the explosive expansion of a hot lightning channel. This may not be the cause of all of the emissions at infrasonic frequencies. Some researchers have suggested that a sudden change in the cloud electrostatic field caused by a lightning discharge might be the cause of the very low frequency infrasonic emissions.
References
C.J. Rodger, "Red Sprites, Upward Lightning, and VLF Perturbations," Reviews of Geophysics, 37, 317-336, 1999
M.A. Dayeh, N.D. Evans, S.A. Fuselier, J. Trevino, J. Ramaekers, J.R. Dwyer, R. Lucia, H.K. Rassoul, D.A. Kotovsky, D.M. Jordan, and M.A. Uman, "First images of thunder: Acoustic imaging of triggered lightning," Geophys. Res. Lett., 42, 6051-6057, 2015.