Friday Jan. 16, 2015
There was a small amount of material from Wednesday's discussion
of the global electric circuit that we needed to finish.
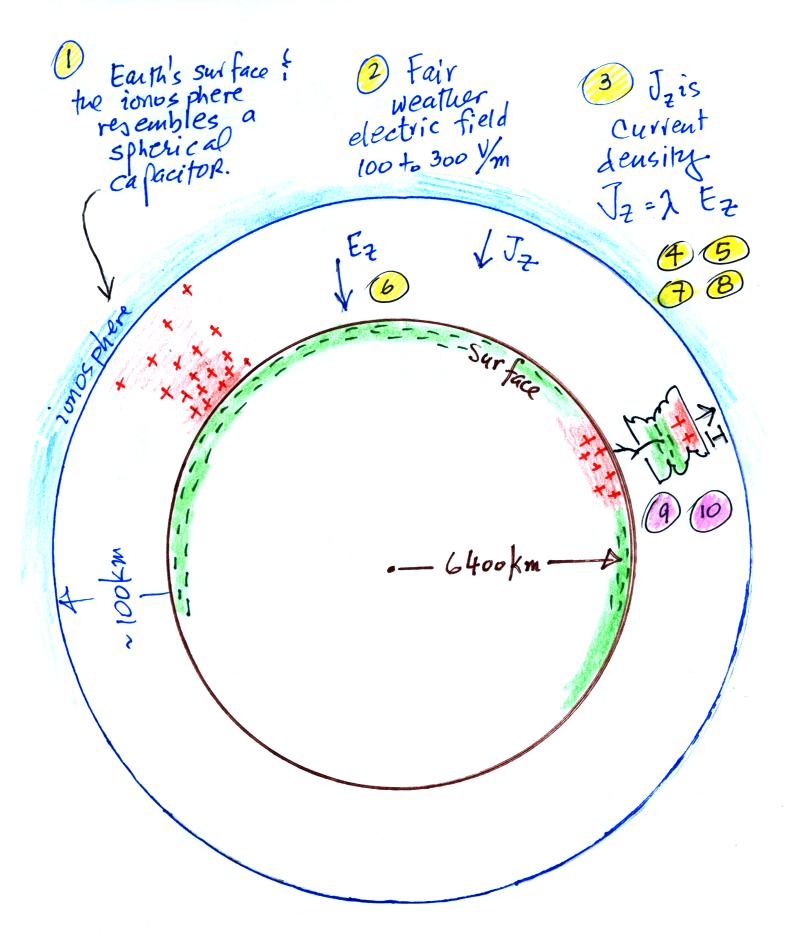
Global electric circuit continued
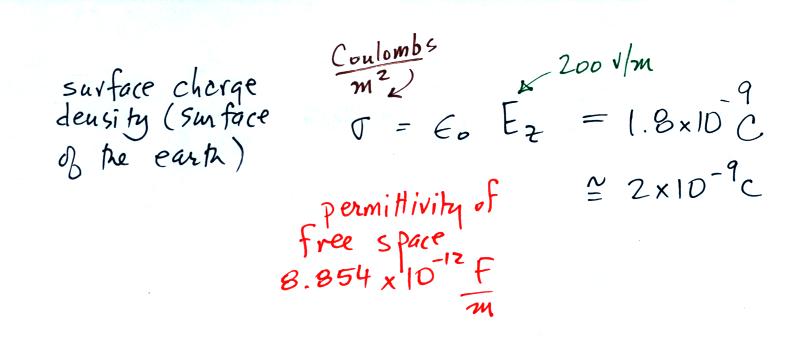
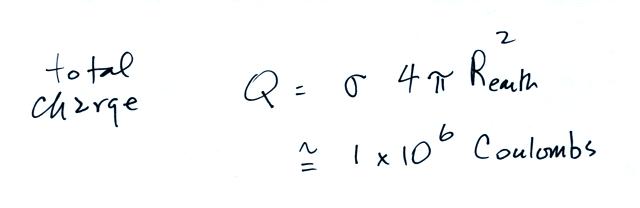
Point 8 There is a simple relation
between the surface charge density, σ (Coulombs per unit
area), and electric field, Ez, at the surface of the earth,
which we assume to be a conductor (we'll derive this expression
soon in this class, it's a simple application of Gauss'
Law). F below stands for Farads, units of capacitance.
We'll multiply by the area of the surface of the earth to
determine the total charge on the earth's surface
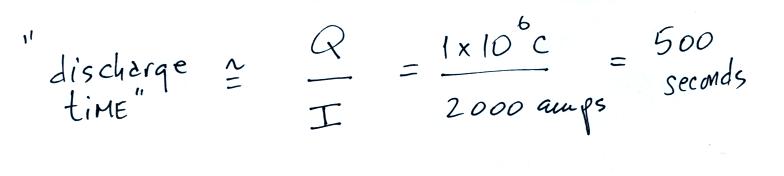
The earth's surface is charged, but a weak current flows through
the atmosphere to the earth trying to neutralize the charge on
the earth. The following calculation shows that it wouldn't take
very long for the current flowing between the ionosphere and the
ground, I, to neutralize the charge on the earth's surface, Q.
It would only take about 10 minutes to discharge the earth's
surface. This doesn't happen however. The obvious
question is what maintains the surface-ionosphere potential
difference? Note we actually
divided the 2 x 10⁻⁹ C/m2 surface charge density by the 4 x 10-12
A/m2 estimate of
current density in class today. We ended up with the
same 500 second discharge time.
What keeps the earth-ionosphere spherical capacitor
charged up?
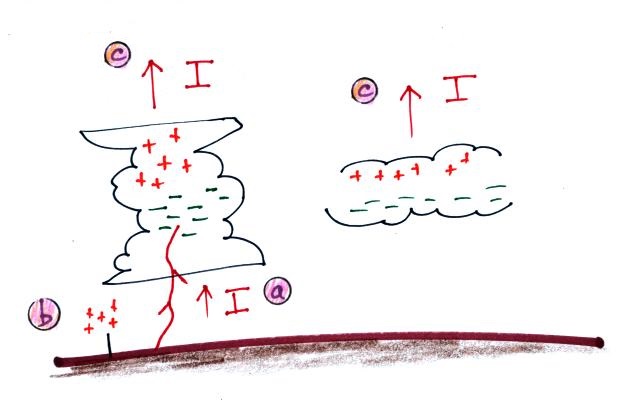
Point 9 The original
answer was thunderstorms. Most cloud-to-ground lightning
carries negative charge to the ground which is an upward pointing
current. Corona discharge from objects on the ground (point
b) also "sprays" positive charge into the air. Current also
flows upward from the positively charged top of the thunderstorm
(point c above and the so called "Wilson current").
If there are about 2000 thunderstorms active at any time around
the globe and each storm sends about 1 A of current upward toward
the ionosphere we can account for the 2000 A downward discharging
current that we estimated in Wednesday's class.
At some point it became clear that thunderstorms alone weren't
enough. The thinking then became that electrified shower
clouds (ESCs) are needed together with thunderstorms to produce
sufficient charging current. ESCs are electrified clouds
that aren't producing lightning (but they do still contribute to
the charging current).
Summary - Fair and stormy weather atmospheric electricity
Points 1-8 in the
figure at the beginning of Wednesday's class (reproduced below)
constitute what might be called "fair weather atmospheric
electricity." We'll spend maybe the first third of
the class working in this area.
Point 10 Most of the
remainder of the class will be devoted to stormy weather
electricity, i.e. thunderstorms, lightning, and related
topics.
We'll look at how thunderstorms become electrified (doesn't it
seem surprising that electrical charge is created and separated in
the cold wet windy interiors of thunderstorms?).
We'll spend quite a bit of time looking at the sequence of
events that make up negative cloud-to-ground lightning.
We'll also look at other types of lightning (intracloud lightning,
positive cloud-to-ground lightning, upward and triggered
lightning).
We'll look at how lightning current characteristics can be
measured either directly or using remote measurements of
electromagnetic fields. This is important because some
knowledge of lightning currents characteristics is needed to to
design effective lightning protection equipment.
Lightning causes a lot of damage to electrical transmission and
distribution systems and kills just under 100 people per year in
the United States. So we'll examine some of the methods of
protecting structures and electrical systems from lightning and
how to protect yourself from lightning.
We'll also look at new ground- and satellite-based sensors
being used to detect lightning as it occurs around the globe.
Finally there is usually time enough at the end of the semester
to cover a variety of miscellaneous topics such as: volcanic
lightning and lightning on other planets, high altitude luminous
phenomena associated with lightning (sprites, blue jets, and
elves), and the production of x-ray and gamma ray radiation by
lightning.
The Carnegie Curve and the global
electric circuit charging current
Blakeslee et al. (2014) ave recently published results from 15
years of satellite observations of lightning and also electrical
measurements made above thunderstorms using high-altitude
aircraft. They address this question of maintaining the
earth-ionosphere potential difference and it is worth taking a
short detour to look at some of the results of that work (thanks
to Dr. Cummins for letting me know about this recent work)
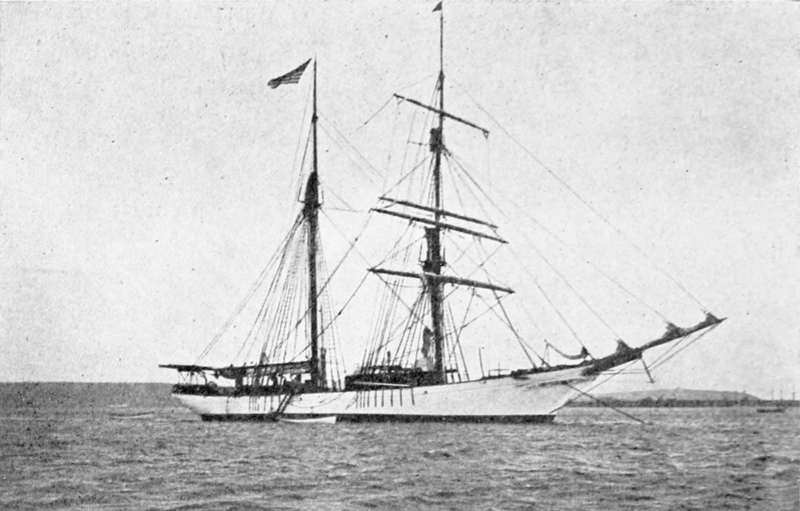
We should however first step back and look at some measurements
made in the early 20th century. The Carnegie, shown below at
right, was a research vessel operated by the Carnegie Institution
of Washington. The Carnegie made a wide variety
of electrical and magnetic measurements during seven voyages
covering over 300,000 miles between 1909 and 1929 (an
explosion in November 1929 killed the captain, a crew
member, and burned the ship which was non magnetic and largely
built of wood). The surface electric field was one of many
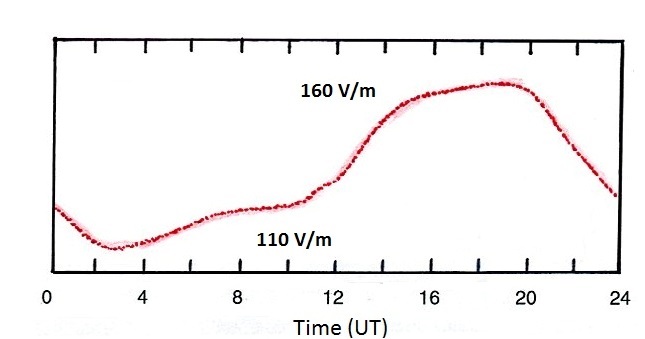
measurements carried out. When the surface electric field is
measured out over the ocean, where the air is clean, daily
variations like sketched below is observed.
|
|
A relatively realistic
representation of the Carnegie curve adapted from several
different sources.
|
The research vessel Carnegie
(image source)
|
This is known as the "Carnegie curve." The electric field
peaks at around 19:00 GMT (7 pm in London, 12 noon in Tucson) and
reaches a minimum at around 04:00 GMT. It doesn't matter
whether the measurements are made in the Atlantic, the Pacific or
any other ocean. The same daily electric field variations
are observed simultaneously world wide. This is because the
high conductivity of the two boundaries in the earth-atmosphere
spherical capacitor quick spread a local change in voltage
difference around the globe.
Air conductivity over the ocean shouldn't very much during the day
so a plot of the daily variation of the air earth current density
Jz should have essentially the same
shape as the electric field plotted above ( recall the Jz
= λ Ez relationship in Wednesday's class).
The Carnegie curve has been described as the "electrical heartbeat
of the planet" (I believe that quote comes from R.G. Harrison
(2013)).
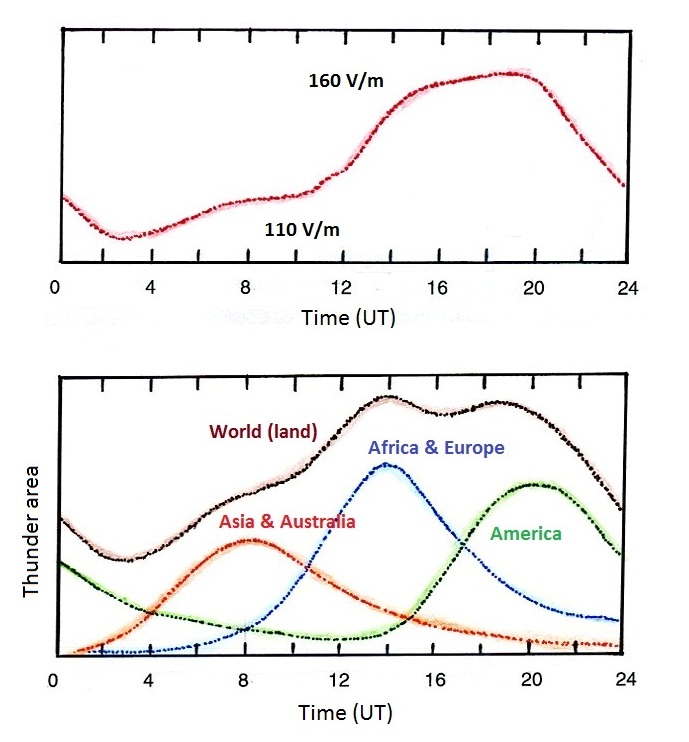
Very early on these variations in electric field were attributed
to worldwide thunderstorm activity. An early comparison is
shown below.
|
The maximum and minimum values
of the world (land) thunder area are about 110 and 40 x 104
km2 . (adapted from a figure
published by F.J.W. Whipple and F.J. Scrase in 1936)
|
The estimates of thunderstorm activity at the bottom of the figure
are based first on the average time of occurrence of thunderstorms
at a single location in England. The same diurnal variation
as a function of local time was assumed to apply throughout the
world. Thunderstorm day statistics were also applied to
account for different thunderstorm frequencies around the
world. Thunderstorm activity over the ocean was not
included. I should note that I was not able to locate the
original reference and am not really sure what the "thunder area"
units on the vertical axis represent.
The overall shapes of the Carnegie curve and the plot of worldwide
thunderstorm activity are roughly similar. But
the amplitude variations of the thunderstorm activity are
generally larger than the E field variations in the Carnegie
curve. The electric field drops to about 70% of its peak
value (110/160), the world (land) thunder area drops to about 35%
of its peak value (40/110). Thunderstorms over land certainly play
an important part in keeping the global electric circuit charged
up but they are not the whole story.
This is where the recent data in Blakeslee et al. (2014) come
in. They present data from 15 years of observations from two
satellite sensors in low earth orbit. Five years of
data (1995-2000) come from the Optical Transient Detector (OTD)
sensor launched in April 1995. The OTD detected and located
lightning between 75o N and 75o S
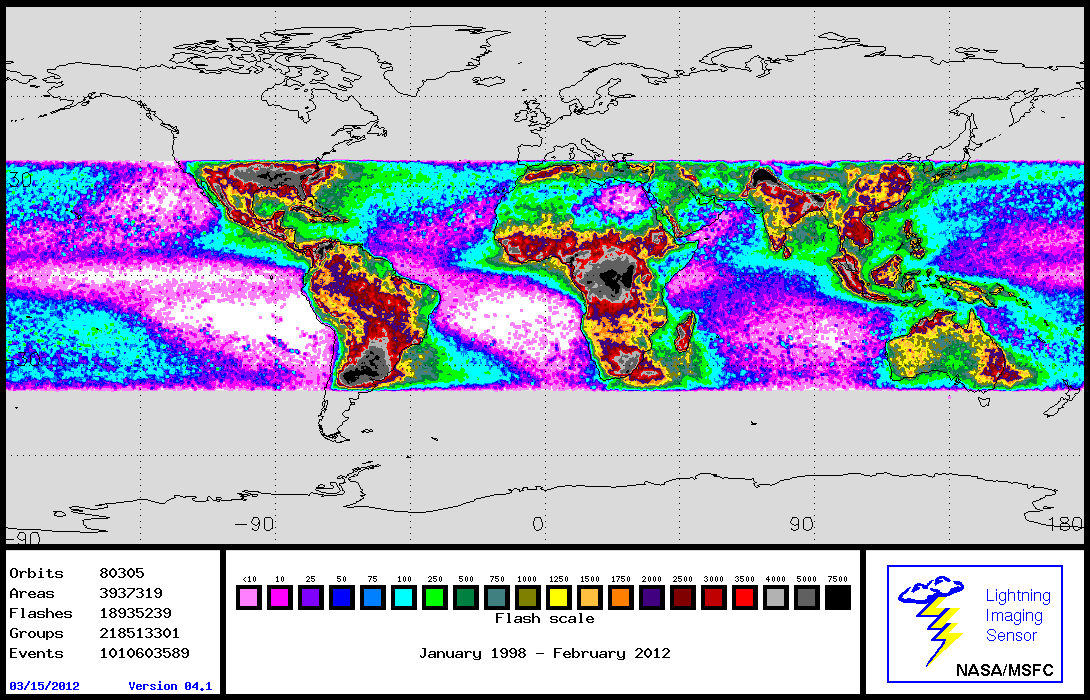
latitude. Ten years of data are from the Lightning Imaging
Sensor (LIS) launched in November 1997. The LIS is only able
to view lightning at latitudes less than 38o.
Lightning is detected during the day and at night (albeit with
different detection efficiencies). Examples of data from
both satellites are shown below (source
of the images)
|
|
One year's worth of lightning
data collected with the OTD
|
Lightning detected by the LIS
from the start of its mission through February 2012
|
We'll look at the OTD and LIS sensors as well as the Geostationary
Lightning Mapper (GLM) instrument planned for the GOES-R
satellite later in the course.
The figure below (a portion of Fig. 3 in the Blakeslee et al.
paper) shows the average diurnal variation in lightning flash rate
from the OTD/LIS data set.
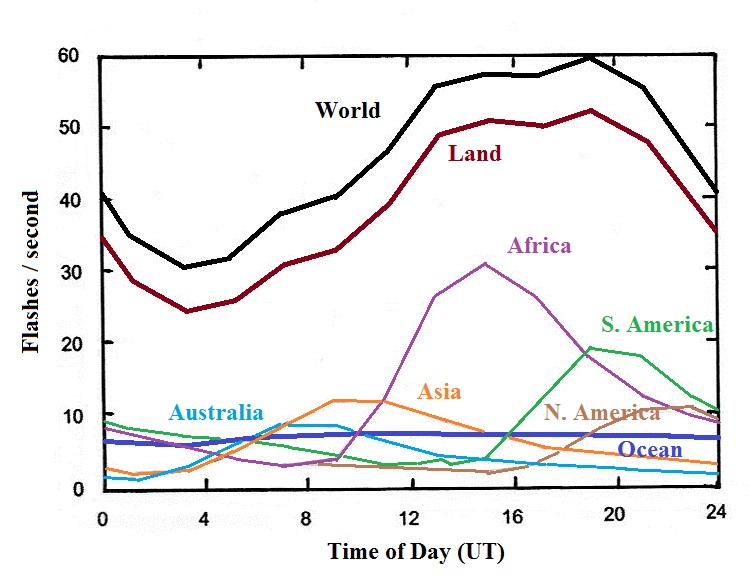
Note that activity over the ocean is included in this
figure. Ocean lightning flash rate remains fairly constant
throughout the day. When plotted against local time, the
curves at the bottom of the figure above all line. Activity
over land generally peaks between 15:00 and 17:00 Local Time, the
minimum occurs between 09:00 and 11:00 LT). Whipple and
Scrase's assumption that the diurnal activity measured in England
will apply around the world was sound.
One of the interesting results that came from these satellite
observations of lightning is that the average lightning flashing
rate, long thought to be about 100 flashes/second, is actually
about half that, 45.7 flashes/second.
Average annual and seasonal flashing rates are shown in the table
below (the peak seasonal rate is highlighted for each region in red)
Annual and
Seasonal Lightning Flash Rates (flashes/second)
|
Region
|
Annual
|
(Dec., Jan., Feb)
|
(Mar., Apr. May)
|
(Jun., Jul., Aug.)
|
(Sep., Oct., Nov.)
|
World
|
45.7
|
35.9
|
44.1
|
55.7
|
47.2
|
Land
|
40.3
|
31.2
|
37.7
|
49.9
|
42.2
|
Africa
|
13.7
|
12.9
|
13.9
|
13.0
|
15.0
|
South America
|
8.8
|
10.1
|
6.3
|
5.6
|
13.1
|
Asia
|
6.5
|
0.8
|
8.4
|
12.4
|
4.2
|
Ocean
|
5.4
|
4.7
|
6.3
|
5.8
|
4.8
|
North America
|
5.4
|
0.6
|
4.1
|
12.9
|
3.9
|
Australia
|
4.4
|
6.5
|
3.8
|
2.2
|
5.1
|
Europe
|
1.6
|
0.2
|
1.2
|
3.9
|
1.1
|
Over land the peak flashing rate occurs during the
summer, though when examined on a region by region basis,
there is not always the case. Peak flashing rate over
South America, for example, occurs during the southern
hemisphere spring. That is probably because convective
activity often precedes the beginning of the summer rainy
season in the tropics. Summer flash rates in the
northern hemisphere are greater than in the southern
hemisphere (more land in the northern hemisphere).
Averaged over the globe, flash rates over the oceans remain
relatively constant throughout the year.
Blakeslee et al. (2014) also report on 1063 overflights of
electrified clouds (thunderstorms and ESCs) collected between
1993 and 2010. Three different aircraft were used (2 of
which were remotely piloted - drones, I guess). Two of
the three aircraft made simultaneous measurements of electric
fields and conductivity (which then allows estimates of
current to be made). Measurements were made at a
surprising number of locations around the world.
The figure below summarizes the measurements of current above
thunderstorms and ESCs over land and the ocean.
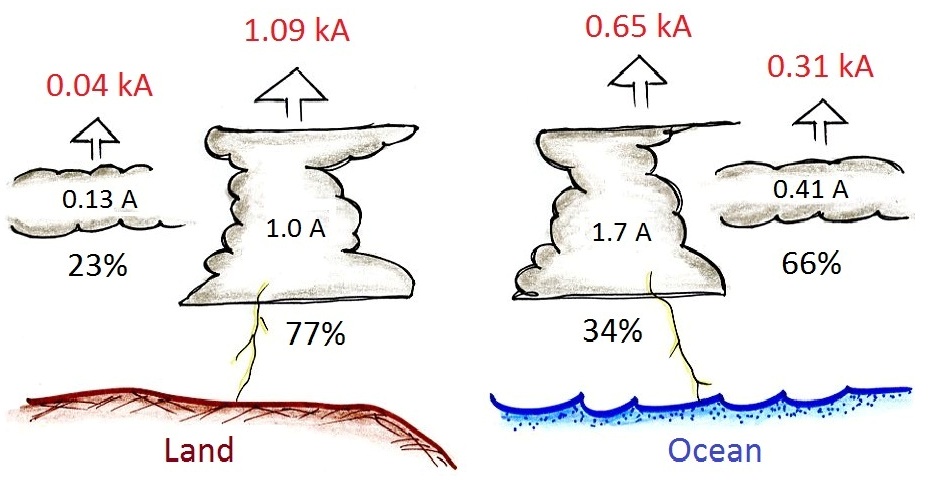
Over land 77% of the clouds in the study were
thunderstorms. The remaining 23% were ESCs.
There are more electrified clouds over the ocean that are not
producing lightning (66%) than there are that are producing
lightning (34%). Over land the average upward current
per thunderstorm was 1.0 A (0.13 A for ESCs). The
average current per thunderstorm over the ocean was 1.7 A
(0.41 A for ESCs). The uppermost current values (in
kiloamperes) show the average annual current from electrified
clouds over the land and ocean. The overall total
average is 2.09 kA (essentially identical to the 2000 A
air-earth discharge current estimated in Wednesday's class)
Thunderstorms over land account for about 52% of the total
annual average global circuit charging current (1.09 kA out of
2.09 kA). Ocean thunderstorms supply 31% of the
total. Electrified clouds over the ocean make a smaller,
about 15%, but important contribution. ESCs over land
account for only 2% of the charging current.
We can combine average flash rate determination from satellite
observations and measurements of the average flash rate per
storm made with the high-altitude aircraft overflights to
determine the number of storms active at a particular time of
day [(flashes/second) / (flashes/sec per storm) = no. of
storms). An example is shown in the figure below.
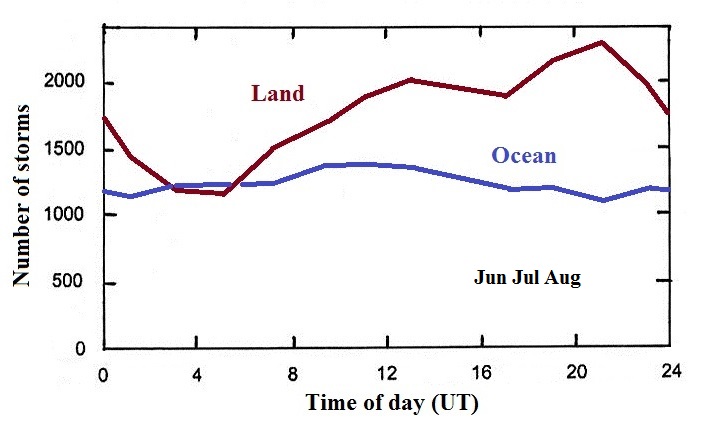
This is for just the three months of June, July,
and August (an annual average was not included in Blakeslee et
al.). The number of oceanic storms always hovers around 1000
in all the seasons. The number of storms over land is more
variable but is usually 1000 or somewhat above. Thus there
are always around 2000 storms active at any time around the globe
(sometimes more than that).
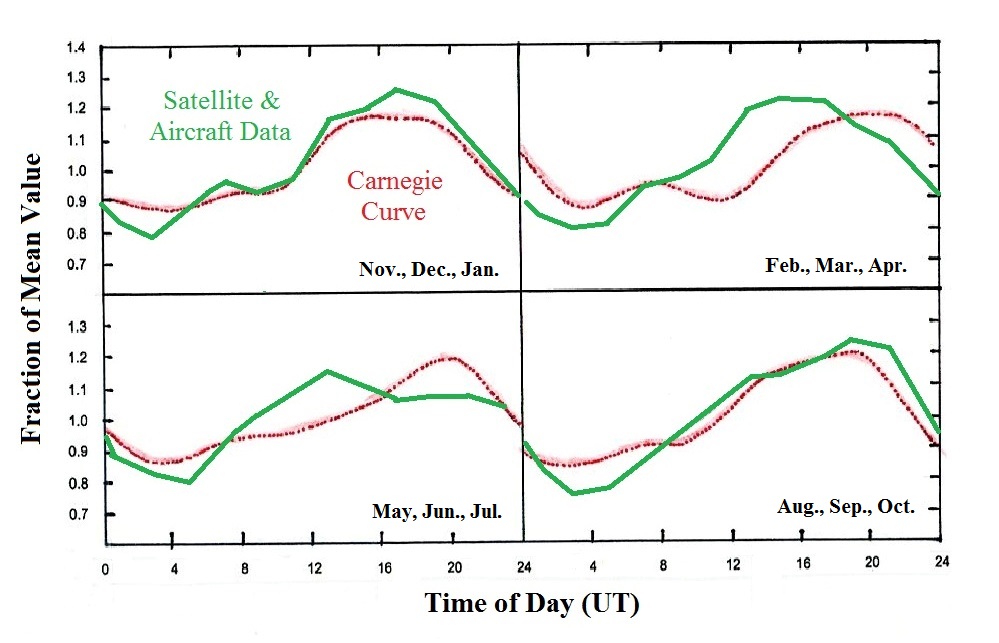
Finally, and this was the reason for this lengthy detour, we can
combine the data on the number of storms active at a particular
time with the average values for currents flowing from individual
storms to come up with an estimate of the total global electric
circuit charging current. This estimate is then compared to
the Carnegie Curve in the next figure.
The agreement in the Nov., Dec., Jan. and the Aug., Sep., Oct.
groups is quite remarkable. There are some slight phase
differences in the other two groups but the overall amplitude
variations are very similar.
Next week we look at some of the important historical
developments in Atmospheric Electricity and will probably spend a
full class on the significant early contributions that came
from Benjamin Franklin.
Here's a small amount of light reading to serve as a transition
from one subject area to another.
Lightning in recorded history
Throughout much of recorded history, lightning was feared and
often seen as a form of punishment (though also sometimes
associated with fertility - eg. birth of twins).
The quotations below come from Prinz (1977).
“symbols based on the concept of fire
are among the oldest pictorial representations of lightning.”
“In many ethnological representations
from prehistoric times lightning is depicted …. as a stone falling
from heaven or a stone axe hurled from the skies.”
Stones falling from
the skies seems to be a very widespread association.
"French peasants carry a “pierre
de tonnerre” (thunder stone) in their pockets to ward off
lightning during thunderstorms”.
Having lived and worked in France for a short time I was
curious about this custom (and ready to buy a thunder stone on
eBay or during my next trip to France).
When I taught this course in Spring 2011 I wasn't able to find
much additional information. 2013 was was different.
Wiktionnaire (the French version of Wiktionary) defines pierre
de tonnerre as: "Boule de Marcassite" (ball of marcasite) and
"Hache polie" (polished axe) and gives a couple of synonyms:
"boule de tonnerre" and "pierre de foudre" (lightning
stone). Wiktionnaire goes on to explain
that a thunder stone is "supposee naitre de la foudre frappant le
sol" (thought to be created by lightning striking the soil).
The balls of marcasite are frequently found in the chalky soils
of the Champagne region.
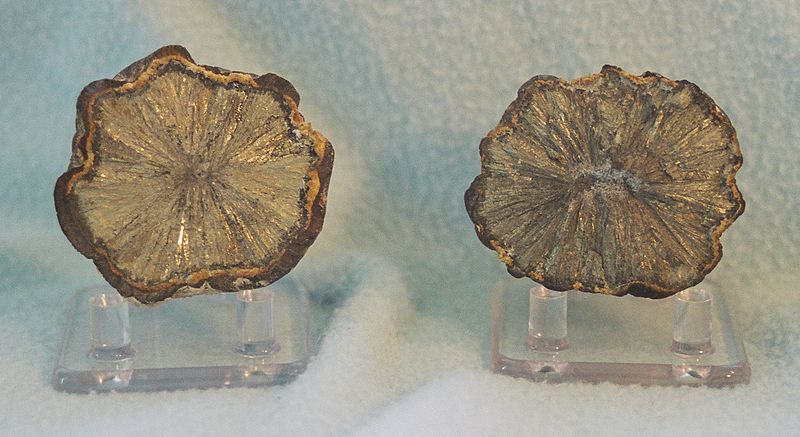
Marcasite is a mineral and is
sometimes called white iron pyrite. Here are a
couple of pictures.
Boule de tonnerre (source)
|
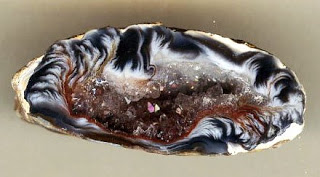
A marcasite geode cut
in half and polished (source) |
A ball of marcasite has an unusual appearance and
must be heavy because iron pyrite is dense (about 4.9 g/cm3).
At this point I was beginning to wonder how could a ball of
iron pyrite be produced by lightning striking chalky
soil?
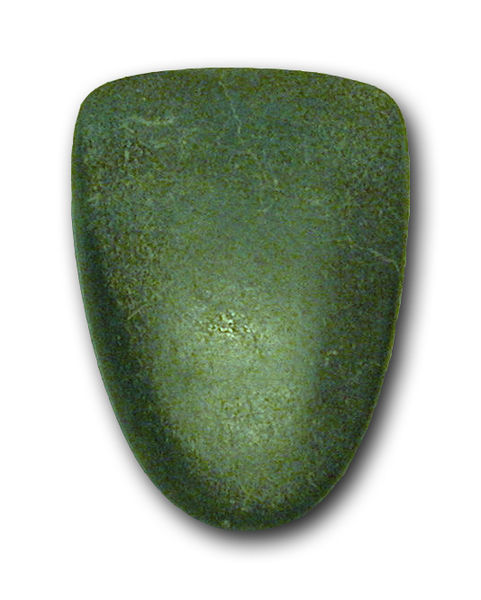
Here's an image of a
polished neolithic axe (source)
Clearly this wasn't produced by lightning. But
an object like this would qualify as a "pierre de tonnerre" and
was thought to offer protection from lightning.
Some additional research led to a site that mentioned an
"oeuf
de tonnerre" (if you click on the link you'll find the
picture below and many more beautiful examples like it, oeuf
by the way is the French word for egg). These "thunder
eggs" are produced in cooling lava as best I can tell.
The site explains the origin
of the term thunderegg:
Selon la légende Amérindienne,
lorsque les esprits de la tempête qui vivaient sur les
sommets enneigés du Wy'east (mont Hood) et le Mont
Jefferson dans l'orégon, se mettaient en colère
les uns contres les autres, ils se lançaient des boulets
de rochers, les dieux trouvaient ces armes dans les nids des oiseaux tonnerre
(thunderbirds) d'ou la dénomination Thundereggs.
A rough translation: According
to American Indian legend, when the storm spirits that lived
on the snow covered summits of Wy'east (Mt. Hood) and Mt.
Jefferson (in Oregon) would throw balls of rock at each
other when they became angry. The gods founds these
weapons in the nests of thunderbirds hence the term
thunderegg.
A
final site explains that a pierre de tonnerre is often
just a fragment of a meteorite.
So after a somewhat time consuming, but interesting
(for me anyways), detour I concluded that none of these
objects was actually produced by lightning. Rather, at
one time, because of their unusual appearance and weight were
thought to be produced by lightning or, in the case of a
meteorite, observed to fall from the sky. They were
something of value because the belief was that
lightning would never strike the same location twice and thus
either carrying one of these stones or putting it on the
threshold of a home would protect the bearer or the structure
from lightning.
Fulgurites
There is a mineral (Lechatelierite?) produced when
lightning strikes sandy soil containing quartz. They're
called fulgurites. The heat produced by the high currents in
a lightning strike fuses the sand or soil and leaves behind a
replica of the lightning channel.
Fulgurites found in Algeria (source)
There are many more photographs online,
often from dealers in minerals, meteorites, and fossils (example
1, example
2). I recently bought some inexpensive (and very
small) fulgurites and will pass them around in class next
week.
R.J.
Blakeslee, D.M. Mach, M.G. Bateman, J.C. Bailey, "Seasonal
variations in the lightning diurnal cycle and implications for
the global electric circuit," Atmos. Res., 135-136, 228-243,
2014.
R.
Giles Harrison, "The Carnegie Curve", Surv. Geophys., 34,
209-232, 2013.
H. Prinz, Lightning in History, Ch. 1 in Lightning Vol. 1, ed.
by R.H. Golde, Academic Press, London, 1977 (the 2 volumes are
available in the Atmos. Sci. Dept. library)
V.A. Rakov,
"Lightning Makes Glass," 29th Annual Conference of the Glass Art
Society, Tampa, Florida, 1999.

