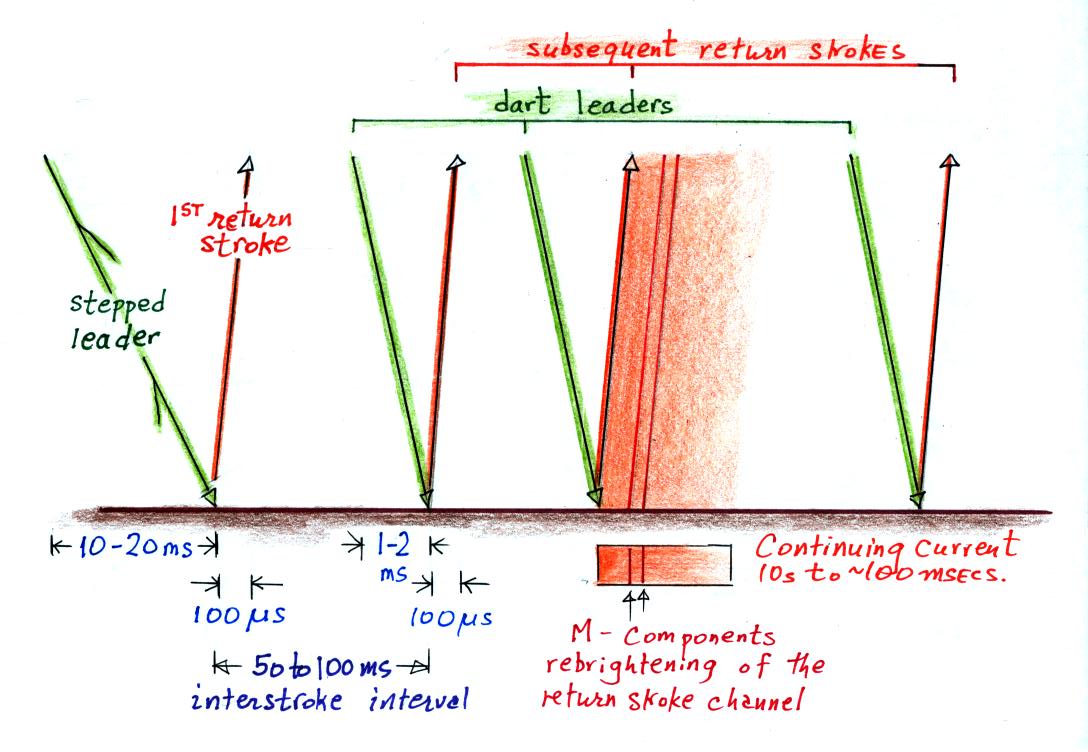
The discharge begins at left in the figure with a branched stepped leader that is followed by a 1st return stroke. The stepped leader takes a few 10s of milliseconds to travel from the main negative charge center in the cloud to the ground. The ensuing 1st return stroke travels back up the channel to the cloud is about 100 microseconds.
Then, with a few slight differences, the process repeats itself. Additional discharges occur typically at intervals of 50 to 100 ms and are usually preceded by a dart leader that travels, without stepping or branching, down the existing main channel. A short upward connecting discharge is initiated when the dart leader gets close to the ground and then a subsequent return stroke travels back up the channel to the cloud. We'll look at the dart leader and subsequent return stroke processes in a little more detail shortly.
The 3rd return stroke in the illustration above is following by a continuing current. This is a low amplitude (100s of Amperes) current that continues to flow for 10s of milliseconds or more typically, which keeps the return stroke channel luminous. Short re-brightening of the channel sometimes occur during the continuing current, these are called M-components.
Next some more information about dart leaders and subsequent return strokes.
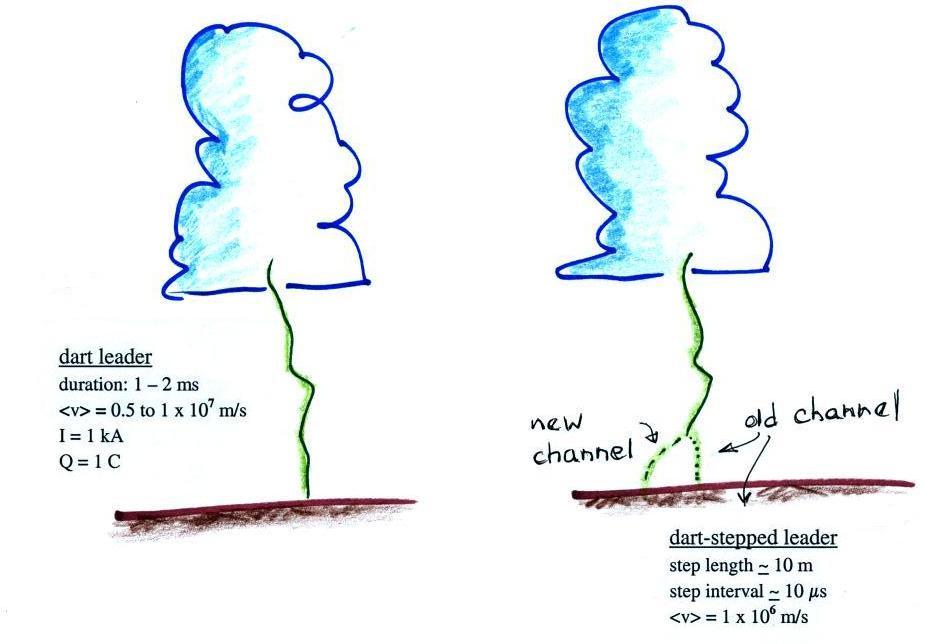
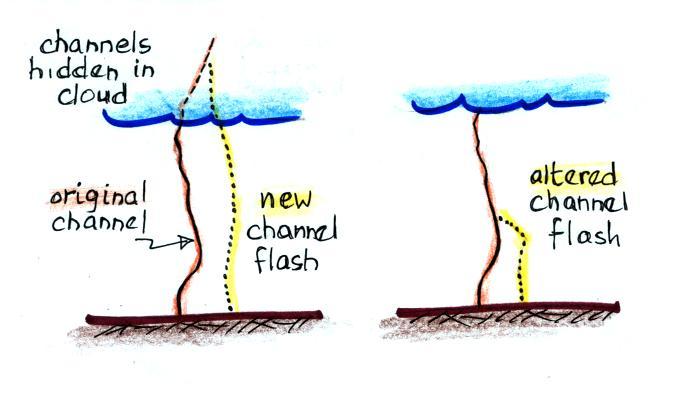
Sometimes the dart leader will depart from the existing channel and form a new channel to ground. Because it is traveling through air that hasn't been ionized, the lower portion of the dart leader would turn into a stepped leader.
Occasionally there is sufficient time between strokes that the existing channel can begin to cool and become less conductive. Under these conditions the dart leader becomes a dart-stepped leader. The steps of a dart-stepped leader are shorter and occur more frequently than a stepped leader.
Subsequent return stroke characteristics are summarized in the table below
| peak current |
10 kA |
| peak current
derivative |
100 kA/μs |
| velocity |
1 x 10⁸ m/s |
A short video was shown at this point (it was produced by Ken Cummins and Shipherd Reed for a display at the Flandrau Science Center on campus). It reviews and also has some nice video examples of the phenomena we have been covering. I can't include a link in these online notes because the video contains some copyright protected material.
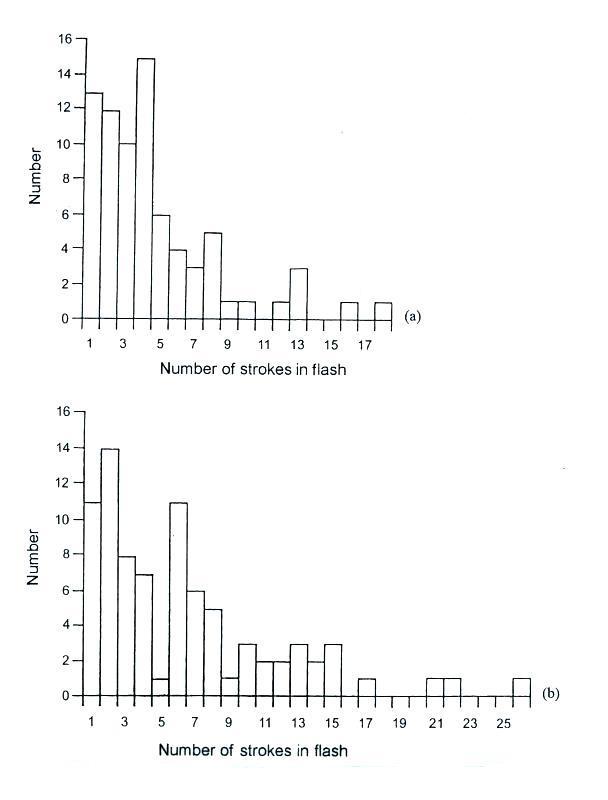
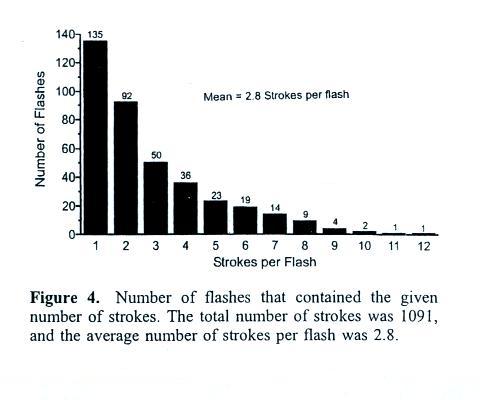
Statistics on the number of strokes per flash are shown in the following two histograms (source: Lightning: Physics and Effects, V.A. Rakov, M.A. Uman, Cambridge Univ. Press, Cambridge, 2003).
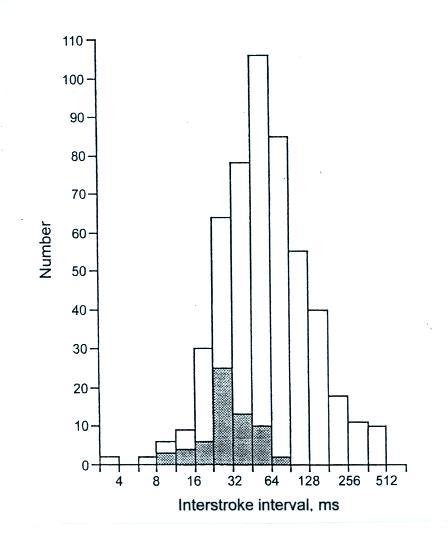
Many lightning parameters or characteristics are log-normally distributed. This appears to be the case with the interval time between return strokes distribution in the next figure (also from the Lightning: Physics and Effects source mentioned above)
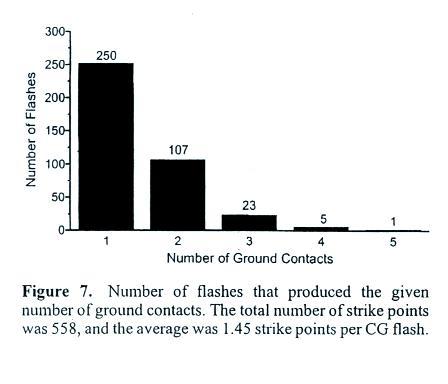
Up to now we really haven't considered the possibility that dart leaders and subsequent return strokes might depart from the channel created by the stepped leader and 1st return strokes. That does often turn out to be the case. This means that the separate strokes in a flash do not always strike the same point on the ground. The illustration and statistics below come from "Statistics and characteristics of cloud-to-ground lightning with multiple ground contacts," W.C. Valine and E.P. Krider
Next we look at how a
multi-stroke cloud-to-ground discharge might appear on
slow and fast electric field antenna records. We
might have done this earlier in the semester but now
you should have a better understanding of the various
processes involved.
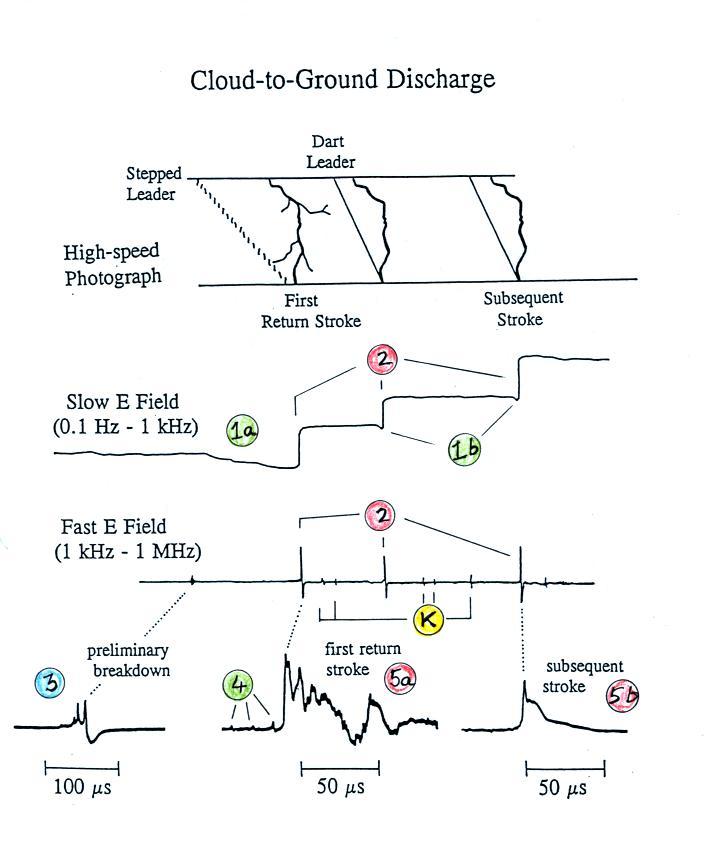
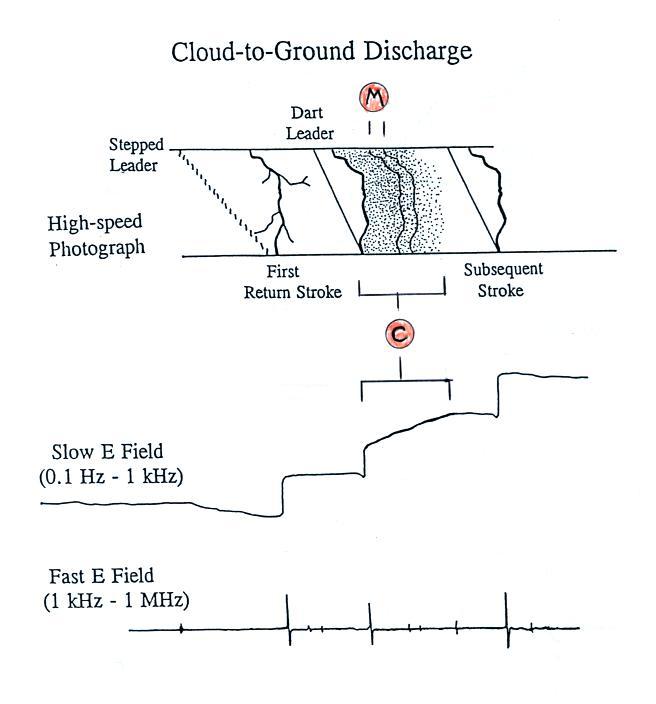
The sequence of events shown on the sketch of a high-speed photograph record of a discharge at the top of the figure should be familiar by now.
Point 1a on the slow E field record shows the field change produced by the stepped leader (the E field at the ground points upward toward the negative charge being lowered by the leader, so it looks like the atmospheric electricity convention for E field polarity is being used on this figure). The dart leader field changes are shown at Points 1b. They are smaller in amplitude (the dart leader doesn't lower as much charge as the stepped leader) and have shorter durations.
The abrupt return stroke changes are shown at Points 2 on the slow E and the fast E records. Note one the slow E field record that the leader and return stroke field changes are of opposite polarity. The return stroke removes negative charge from the leader channel, charge that came from the main negative charge center in the thundercloud. The overall effect is the same as if a quantity of positive charge had been added to the cloud and used to neutralize the negative charge.
Points K on the fast E field record are "K changes." During the interval between return strokes, in-cloud leader processes seek out additional pockets of charge in the cloud. Occasionally, when the leader finds a concentration of charge, a rapid recoil streamer travels back along the in-cloud leader channel (in some ways like a return stroke propagates back along the leader in a cloud-to-ground strike). The K changes are probably produced by these recoil streamers.
The preliminary discharge process that initiates cloud-to-ground discharges is not well understood. Sequences of bipolar waveforms like shown at Point 3 though are thought to be associated with the preliminary breakdown process.
Point 4 shows E field pulses thought to be produced by the last few steps of the stepped leader as it approaches the ground.
The fast E field waveforms produced by 1st and subsequent strokes are distinctly different. The 1st return stroke field variations following the peak are considerably noisier than is observed with subsequent strokes. Some of the "noise" on the 1st return stroke E field record is probably produced by branches. Some of the structure on both the 1st and subsequent stroke waveforms is probably due to channel tortuosity.
Some of the modern lightning detection and location instrumentation is able to distinquish between return stroke waveforms and waveforms produced by leaders or discharges that occur during the preliminary breakdown activity.
The next figure is essentially the same except that some continuing current has been added following the second stroke.
A continuing current is a low level current (10s to
100s of Amperes) that continues to flow after a return
stroke for 10s to a few 100s of milliseconds.
The continuing current can transport signficant
quantities of charge to the ground (100 ms x 250 Amps
= 25 C ). Continuing currents can burn through
metal sheets or metal skins on aircraft bodies.
A CG lightning discharge with continuing current is
sometimes referred to as "hot lightning" because these
discharges are more likely to cause a forest fire than
a discharge without continuing current. A field
change associated with the continuing current is
visible on the slow E field record. M components
are a rebrightening of the lightning channel that
occurs during a continuing current. The K
changes seen on the fast E field trace may be
associated with the M components.
The next figure illustrates a triggered lightning discharge. The figure shows a typical slow E field record and a record of the current that would be measured at the ground instead of a fast E field waveform.
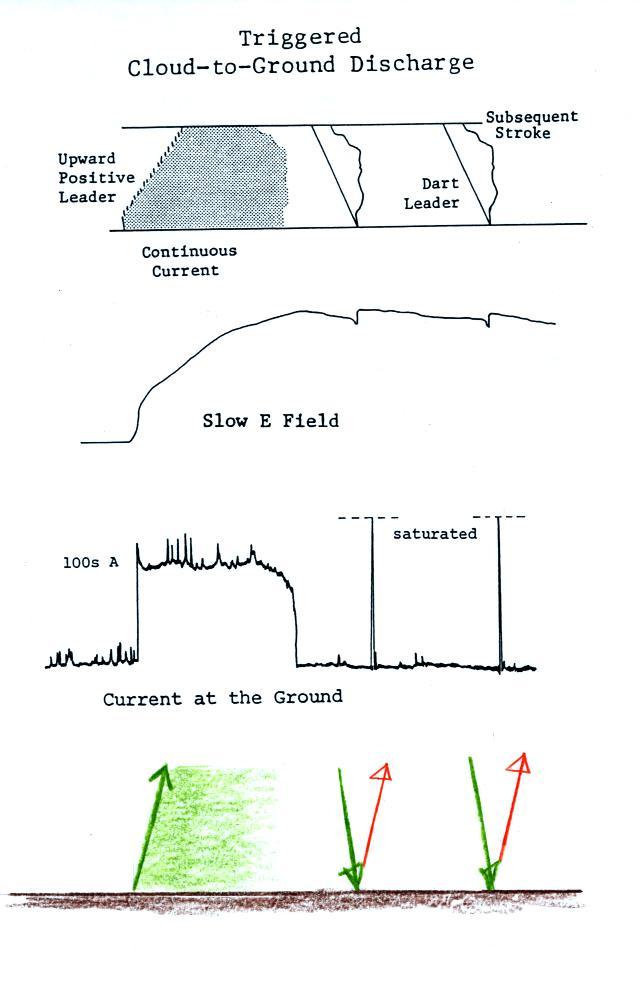
The sequence of events shown on the sketch of a high-speed photograph record of a discharge at the top of the figure should be familiar by now.
Point 1a on the slow E field record shows the field change produced by the stepped leader (the E field at the ground points upward toward the negative charge being lowered by the leader, so it looks like the atmospheric electricity convention for E field polarity is being used on this figure). The dart leader field changes are shown at Points 1b. They are smaller in amplitude (the dart leader doesn't lower as much charge as the stepped leader) and have shorter durations.
The abrupt return stroke changes are shown at Points 2 on the slow E and the fast E records. Note one the slow E field record that the leader and return stroke field changes are of opposite polarity. The return stroke removes negative charge from the leader channel, charge that came from the main negative charge center in the thundercloud. The overall effect is the same as if a quantity of positive charge had been added to the cloud and used to neutralize the negative charge.
Points K on the fast E field record are "K changes." During the interval between return strokes, in-cloud leader processes seek out additional pockets of charge in the cloud. Occasionally, when the leader finds a concentration of charge, a rapid recoil streamer travels back along the in-cloud leader channel (in some ways like a return stroke propagates back along the leader in a cloud-to-ground strike). The K changes are probably produced by these recoil streamers.
The preliminary discharge process that initiates cloud-to-ground discharges is not well understood. Sequences of bipolar waveforms like shown at Point 3 though are thought to be associated with the preliminary breakdown process.
Point 4 shows E field pulses thought to be produced by the last few steps of the stepped leader as it approaches the ground.
The fast E field waveforms produced by 1st and subsequent strokes are distinctly different. The 1st return stroke field variations following the peak are considerably noisier than is observed with subsequent strokes. Some of the "noise" on the 1st return stroke E field record is probably produced by branches. Some of the structure on both the 1st and subsequent stroke waveforms is probably due to channel tortuosity.
Some of the modern lightning detection and location instrumentation is able to distinquish between return stroke waveforms and waveforms produced by leaders or discharges that occur during the preliminary breakdown activity.
The next figure is essentially the same except that some continuing current has been added following the second stroke.
The next figure illustrates a triggered lightning discharge. The figure shows a typical slow E field record and a record of the current that would be measured at the ground instead of a fast E field waveform.
Triggered
discharges are initiated by an upward propagating,
positively charged leader which is followed by a
continuous current. This is followed by
downward moving, negatively charged dart leaders
and subsequent return strokes. The dart
leaders and subsequent strokes are thought to be
similar to those that occur in natural CG
discharges.
Finally some terms or expressions that you might hear concerning lightning.
"Dry" lightning is common early in the summer thunderstorm season in Arizona when the air is still relatively dry. Precipitation falling from the thunderstorm evaporates before reaching the ground. It is more likely that lightning striking the ground will start a brush fire because the vegetation is often quite dry.
A cloud to ground discharge with continuing current following one or more of the return strokes is sometimes referred to as "hot" lightning. This type of lightning is more likely to start a forest fire than a flash without continuing current.
When a lightning channel begins to cool and fade from view, some portions of the channel may remain luminous longer than others (or channel segments may be oriented in a way that keeps them brighter and visible longer than other channel segments). The channel will seem to break up into a series of bright spots or beads. This is bead lightning. You find a pretty good example here.
The term heat lightning refers to lightning without any thunder. It may be that the storm is too distant or, as we will see later in the class, sound waves can be refracted or bent so that they pass over the heads of people on the ground and the thunder can't be heard.
I showed an example of a multistroke cloud to ground flash captured on moving film so that the separate strokes were separated on the film. You'll sometimes see something like this when observing lightning or when photographing lightning will a camera that is not being moved. In this case wind is blowing the lightning channel horizontally and the image of lightning appears somewhat smeared. This is known as ribbon lightning; here's a very good example published in The Guardian newspaper.
Finally there's ball lightning a luminous sphere that can range from the size of a baseball up to perhaps basketball size. The ball of "fire" lasts usually for just a few seconds, appears to float through the air, and can apparently produce a variety of sounds and smells. Ball lightning hasn't been explained and there may be several different phenomena involved. In his book "All About Lightning" Martin Uman reports that ball lightning has been seen by 5 to 10% of the population which is about the same number of people that have been close enough to a lightning strike to have seen the impact point. We won't cover the subject in this class.
Finally some terms or expressions that you might hear concerning lightning.
"Dry" lightning is common early in the summer thunderstorm season in Arizona when the air is still relatively dry. Precipitation falling from the thunderstorm evaporates before reaching the ground. It is more likely that lightning striking the ground will start a brush fire because the vegetation is often quite dry.
A cloud to ground discharge with continuing current following one or more of the return strokes is sometimes referred to as "hot" lightning. This type of lightning is more likely to start a forest fire than a flash without continuing current.
When a lightning channel begins to cool and fade from view, some portions of the channel may remain luminous longer than others (or channel segments may be oriented in a way that keeps them brighter and visible longer than other channel segments). The channel will seem to break up into a series of bright spots or beads. This is bead lightning. You find a pretty good example here.
The term heat lightning refers to lightning without any thunder. It may be that the storm is too distant or, as we will see later in the class, sound waves can be refracted or bent so that they pass over the heads of people on the ground and the thunder can't be heard.
I showed an example of a multistroke cloud to ground flash captured on moving film so that the separate strokes were separated on the film. You'll sometimes see something like this when observing lightning or when photographing lightning will a camera that is not being moved. In this case wind is blowing the lightning channel horizontally and the image of lightning appears somewhat smeared. This is known as ribbon lightning; here's a very good example published in The Guardian newspaper.
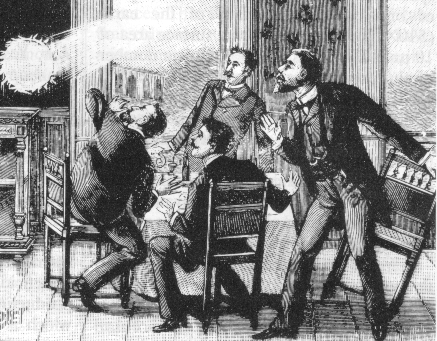
A 1991 depiction of ball
lightning (from a
Wikipedia article on the topic)
Finally there's ball lightning a luminous sphere that can range from the size of a baseball up to perhaps basketball size. The ball of "fire" lasts usually for just a few seconds, appears to float through the air, and can apparently produce a variety of sounds and smells. Ball lightning hasn't been explained and there may be several different phenomena involved. In his book "All About Lightning" Martin Uman reports that ball lightning has been seen by 5 to 10% of the population which is about the same number of people that have been close enough to a lightning strike to have seen the impact point. We won't cover the subject in this class.