Wednesday Feb. 18, 2015
The 3rd homework assignment was collected today. A new assignment was also
handed out. It is due next Wednesday (Feb. 25). It
contains an extra credit problem that appeared on the 2005 midterm
exam for this course. I don't remember ever having been able
to solve the question and am hoping one of you might.
The following information was copied from the www.SnowCrystals.com
website. This is an information packed website and you
should definitely have a look at it if only to view the
photomicrographs of snow crystals. The information below is
longer available. It briefly discusses the quasi-liquid
layer that is found at the boundary between ice and air.
The quasi liquid layer seems to play an important role in
charging in the non inductive process.
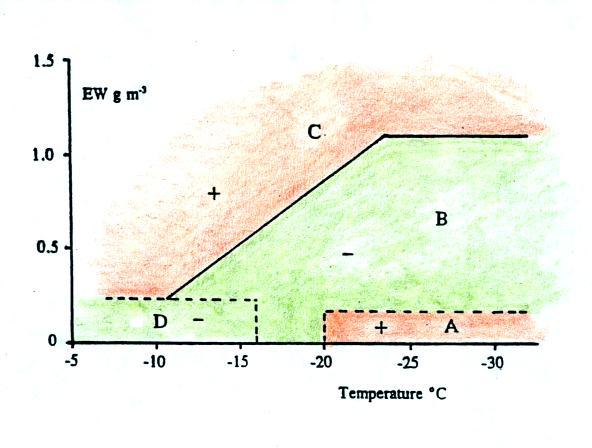
The + and - polarities in the
figure refer to the charge on the metal target that simulates a
graupel particle in these laboratory experiments. The
charge depends on the environmental temperature and on the cloud
liquid water content as shown in the figure above. EW
on the vertical axis is effective liquid water content and is the
product of liquid water content and collision efficiency (what
fraction of the supercooled water droplets colliding with the
target stick and eventually freeze to the target).
Here is my interpretation of what happens in regions A and
B. The temperature is low in both cases.
The difference is the liquid water content, the concentration of
supercooled water droplets.
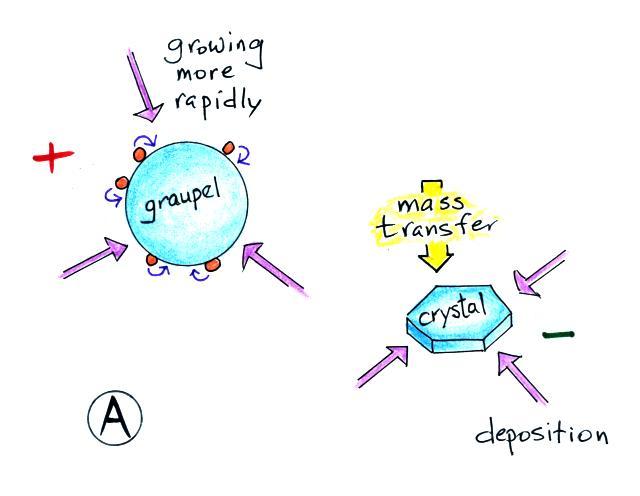
Region A
Supercooled droplets are
colliding with and sticking to the graupel particle at a
relatively low rate. That is because of the low effective
liquid water content. The droplets warm as they release
latent heat and try to freeze. The droplets warm but there
isn't enough latent heat energy release to warm the graupel
particle itself. So both the graupel and the ice crystal are
cold and the rates of deposition of water vapor to the graupel and
the ice crystal are about equal (deposition is the
water vapor to ice phase change). The graupel
gets some additional deposition from the warm water droplets on
its surface (the thin purple arrows from the droplets to the
graupel particle in the figure). As a result the graupel is
growing more quickly and has the thicker quasi liquid layer.
Mass transfer during a collision with an ice crystal is to the ice
crystal. The ice crystal ends up with negative charge, the
graupel particle with positive charge.
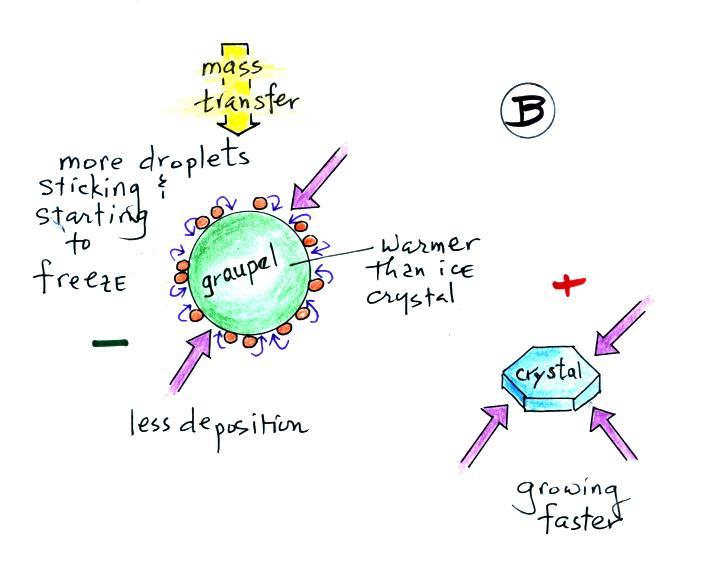
Region B
The effective liquid water content is higher and there are more
supercooled water droplets colliding with and sticking to the
graupel particle. Now as they release latent heat and try to
freeze they are able to warm the graupel particle. The net
rate of deposition from the surroundings to the graupel particle
is reduced (2 arrows are shown in B versus 3 arrows in A).
Even with the deposition from the droplets on the surface of the
graupel particle, the ice crystal grows more quickly and has the
thicker quasi liquid layer. Mass transfer during a collision
goes to the graupel particle and the graupel particle ends up with
negative charge.
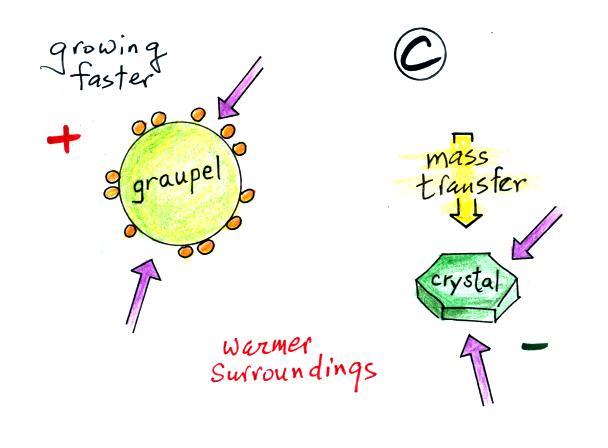
Both the ice crystal and the graupel particle are in warmer
surroundings and the rate of deposition to each is reduced.
The graupel is warmer than it was in Region B. Now however
the deposition from the accreted water droplets is increased
because it takes them longer to freeze. The graupel particle
grows faster and has the thicker quasi liquid layer. Mass
transfer is to the ice crystal again and it ends up with negative
charge.
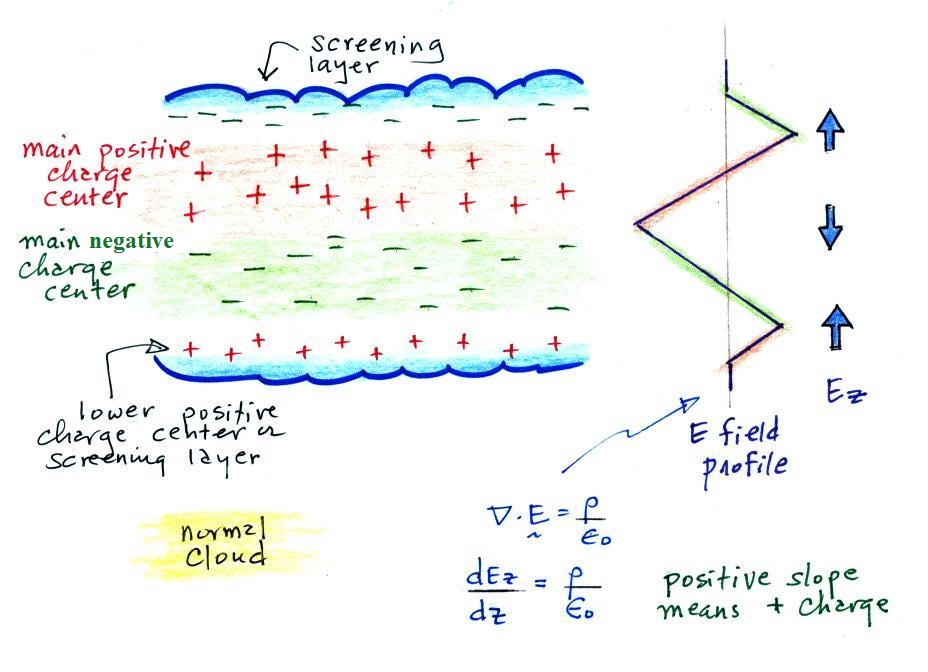
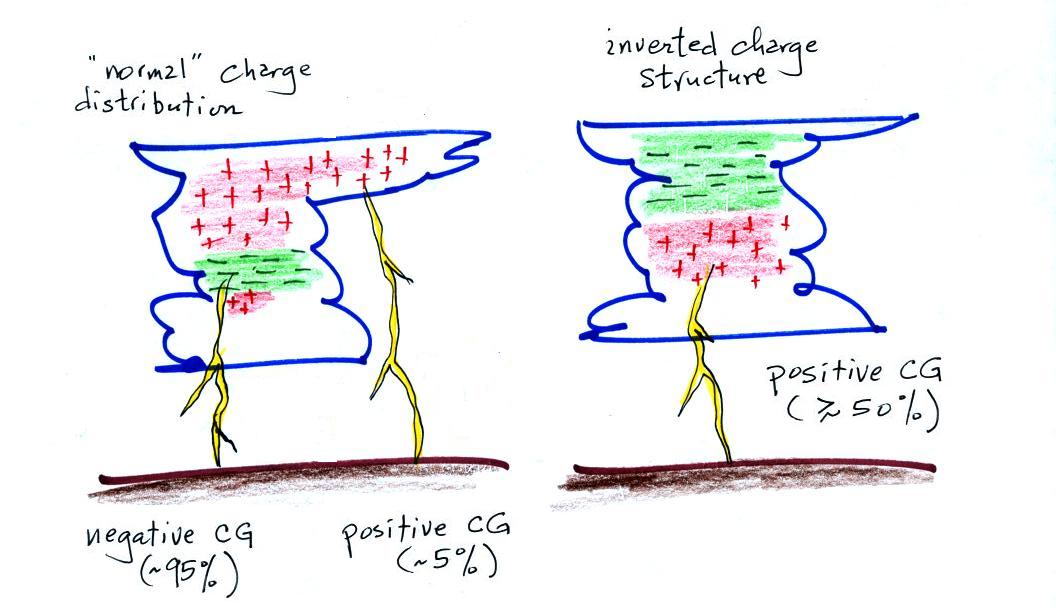
Most thunderstorms have the dipolar (or tripolar) charge
distribution as shown below at left. The majority of cloud
to ground (CG) discharges from these types of storms carry
negative charge to ground. Just a few percent of the CG
discharges are positively charged (we'll see though that these
positive CG discharges sometimes have very large peak currents).
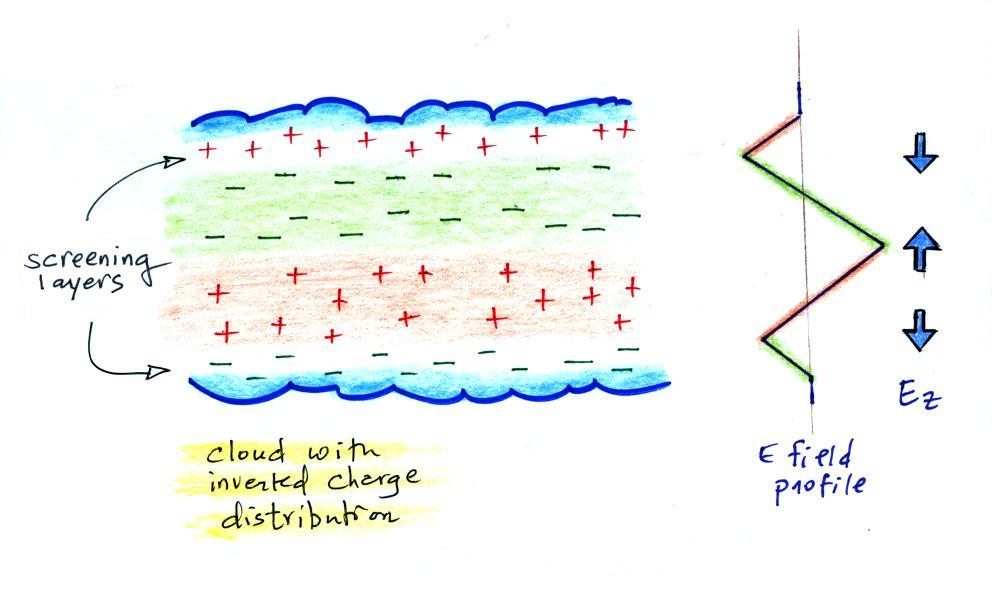
A much larger percentage (50% or more) of positive CG discharges
have been observed coming from some Central Plains storms in
recent field experiments. This would suggest the clouds
might have had an inverted charge distribution like that shown
below at right. And one might wonder whether a different
cloud electrification mechanism is at work (different from the
Reynolds, Brook, Gourley process discussed last Thursday).
Other than the high incidence of positive CG discharge, E field
soundings in thunderstorms have provided evidence of the inverted
charge structure. This is discussed in a fairly recent paper
that you can find here.
The
two
figures
below
illustrate
E
field
soundings
in
"normal"
clouds
and in clouds with inverted charge distributions. These are a little more detailed than was
shown in class.
As you move upward from the bottom toward the top of the cloud you
encounter a positively charged screening layer, the main negative
and positive charge centers, and a positive screening layer at the
top of the cloud.
Just the opposite situation was observed in the inverted polarity
clouds. At first glance these clouds would seem to
invalidate the Reynolds, Brook, Gourley process we have been
studying or at least suggest there might be another process that
sometimes is at work.
Follow up studies, however, seem to indicate that the
non-inductive electrication mechanism is capable of
explaining clouds with inverted charge distributions. This
is shown on the figure below
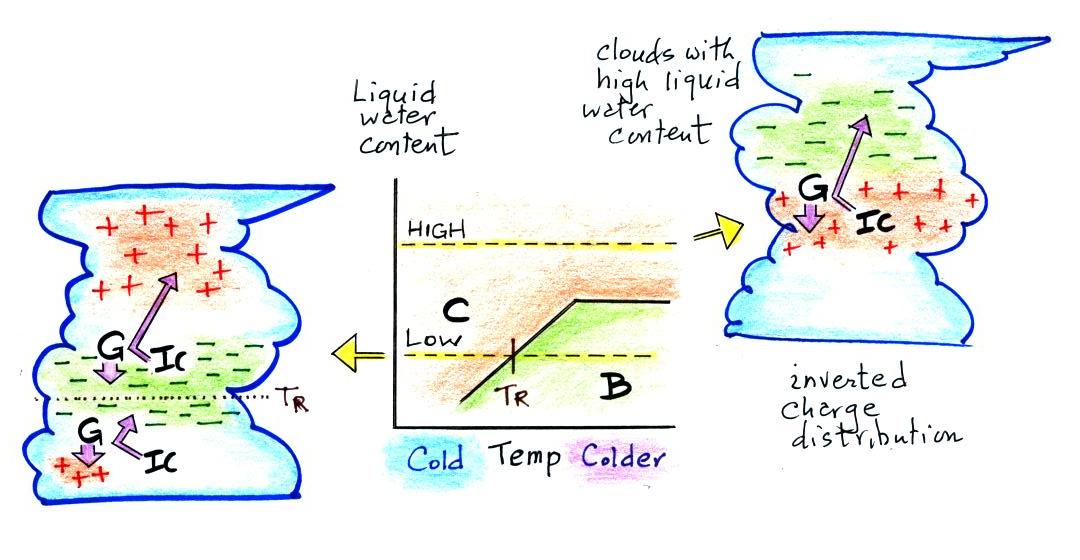
In the center of the figure is the graph that we examined in some
detail earlier in this lecture. It shows the polarity of
charge acquired by a graupel particle colliding with ice crystals
in a laboratory simulation of a cloud environment containing
supercooled water droplets. The liquid water content on the
vertical axis is a measure of the supercooled droplet
concentration.
Liquid water content in a typical cloud would be found near the
level of the lower dotted line on the graph. The tripolar
cloud charge distribution in a typical cloud is shown at
left. High in the cloud where the temperature is cold, the
graupel particle acquires negative charge and the ice crystals
positive charge (region B on the graph). The ice crystals
are carried upward and form the main positive charge center.
The heavier graupel particle descends to form the main negative
charge center. Somewhat lower in the cloud where
temperatures are warmer than TR
(the reversal temperature) but still below freezing the polarity
of the charging changes (region C on the graph). The graupel
ends up with positive charge and the ice crystals with negative
charge. The positively charged graupel form the lower
positive charge centers.
It seems that the unusual Central Plains storms have very high
liquid water contents. If we look at the level of the upper
dotted line on the charging graph in the center of the figure we
see that the graupel particle always ends up with positive charge
in this high LWC environment. There is no charge reversal
temperature. The Reynolds, Brook, Gourley mechanism can
account for clouds with inverted charge distributions. That
would seem to be further validation of this process (and of the
laboratory results from UMIST).