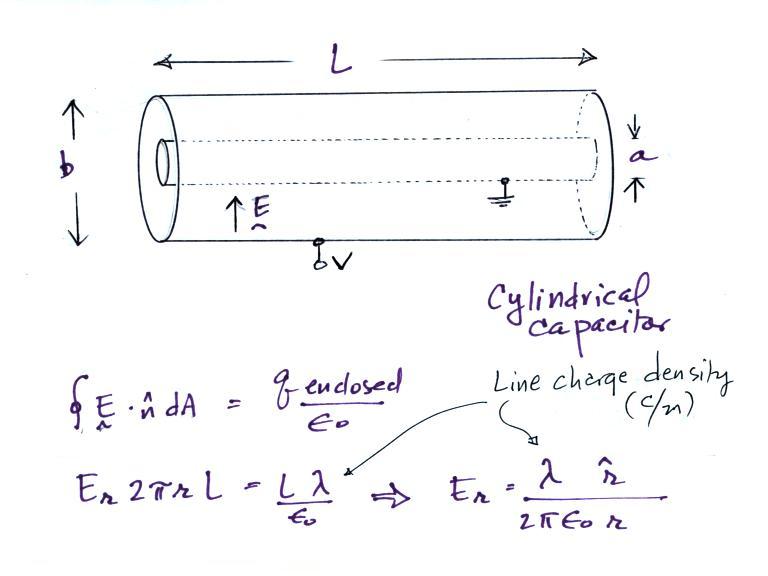
If we assume that we are
looking a just a small section in the middle of a much longer
cylinder (i.e. staying away from the open ends), the E field
will have just a radial component, Er. The solution
above, obtained using Gauss' Law, is the same as the field
around an infinitely long line of charge with uniform line
charge density (the charge is induced on the inner, grounded,
conductor when the outer cylinder is raised to potential
V). A caution:
λ above represents line charge
density (Coulombs/meter). We'll later be using λ
to represent conductivity.
Next we will try to find an expression for the electric field in terms of the potential difference between the two cylinders.
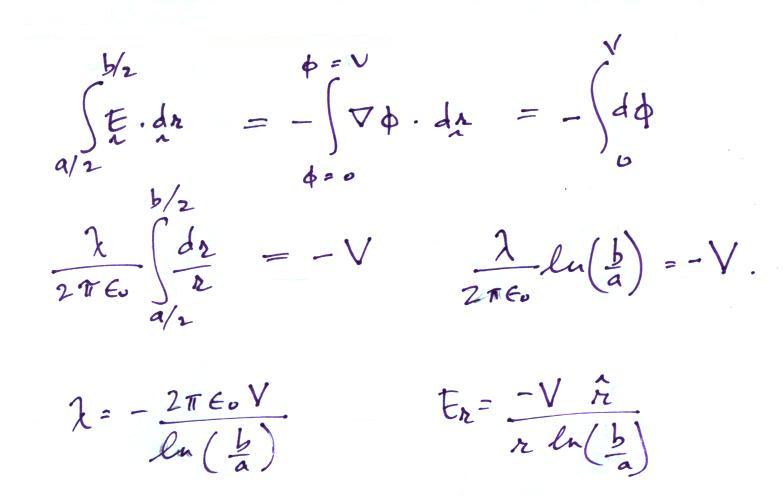
If the outer cylinder is connected to positive potential,
the grounded inner cylinder will have negative charged induced
on it. The E field will point inward as shown in the
figure above.
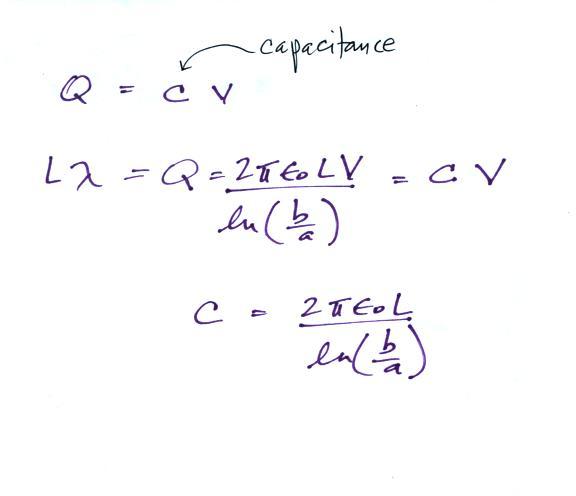
It is a relatively easy matter to determine the capacitance
Let's look first at how an ion counter works. An ion counter will measure the concentration of small ions in the air (the concentration of ions of one polarity).
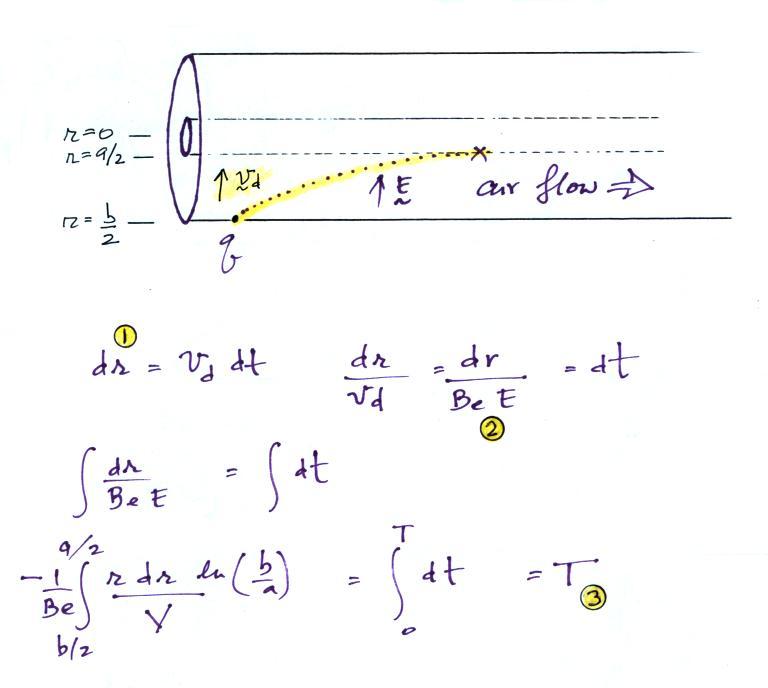
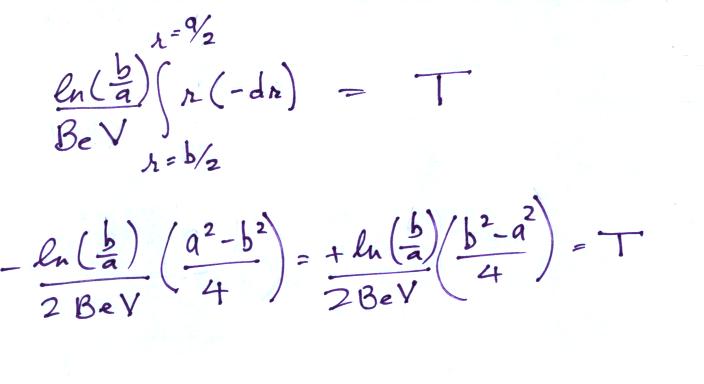
The electric field will cause a positively charged small ion entering the cylindrical capacitor at the left to drift toward the inner conductor with a drift velocity (vd). In time dt, the small ion will drift a distance dr (Point 1). The drift velocity, Point 2, is just the electrical mobility, Be, times the electric field. T at Point 3 is the time it will take the small ion to drift from the outer cylinder to the inner cylinder.
Now in order to be "counted" the small ion must make it to the center conductor before it travels a distance L, the length of the cylindrical capacitor.
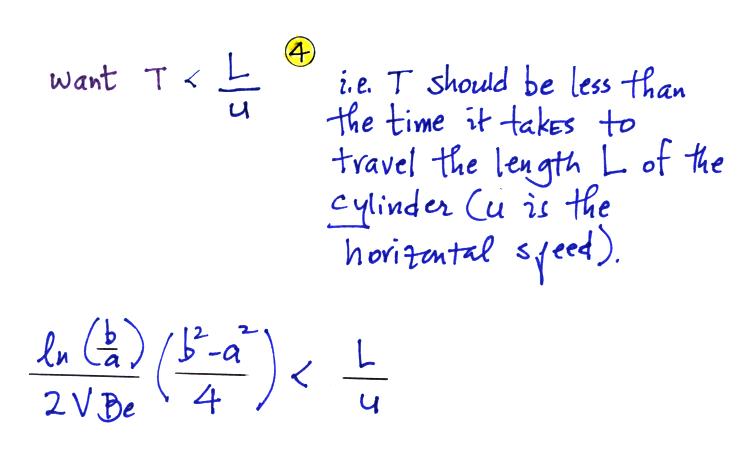
This means (Point 4) that T must be less than L/u, where u is the speed at
which the air is traveling along the length of the
cylindrical capacitor (we assume u is uniform, that there
is no dependence on r).
Mobile ions are more likely to make it to the center electrode. So another way of looking at this is in terms of a critical mobility, Bc.
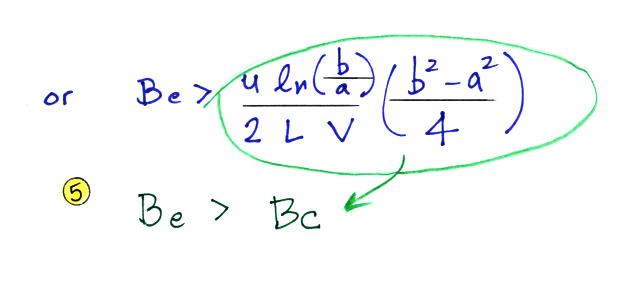
Ions with a mobility Be greater than Bc will be collected, the others won't. The volumetric flow rate is an easier parameter to measure than the horizontal speed. So we can rewrite Bc in terms of flow rate.
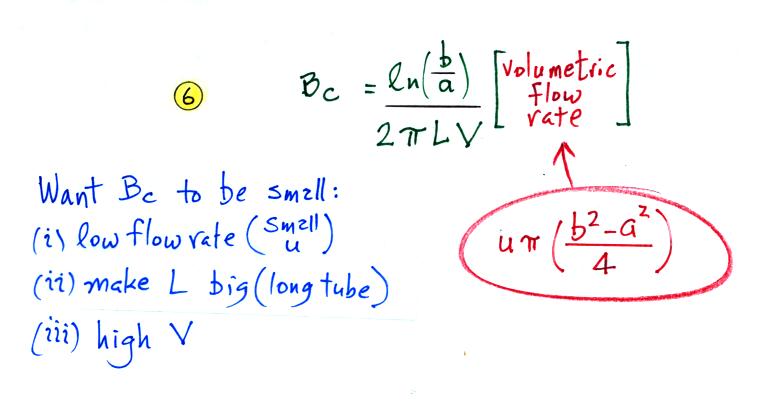
We want Bc to be small so that all of the small ions have a mobility greater than Bc and can be counted. Clearly the lower the flow rate and the longer the tube, the more time the small ions will spend in the capacitor and the more likely they will be collected. Increasing the potential difference between the two cylinders will increase the strength of the electric field and the inward drift velocity of the small ions.
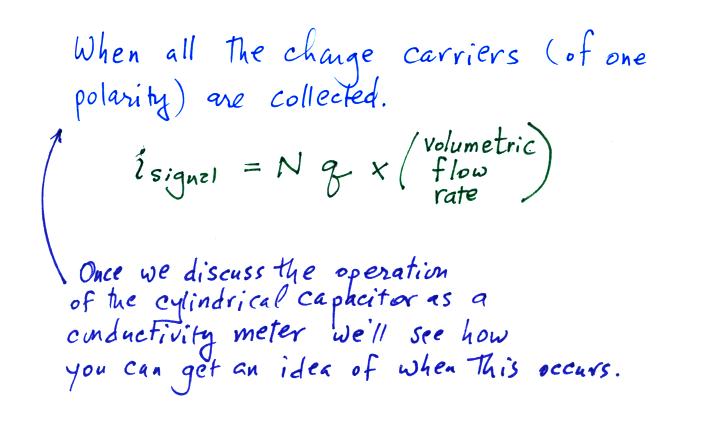
We'll assume that all of the small ions of one polarity are collected by the center electrode as they pass through the cylinder. The current flowing to the center electrode would then be the product of the small ion concentration, the charge per small ions, and the volumetric flow rate. Later in this lecture we will look at instrumentation that could be used to measure this (small) current.
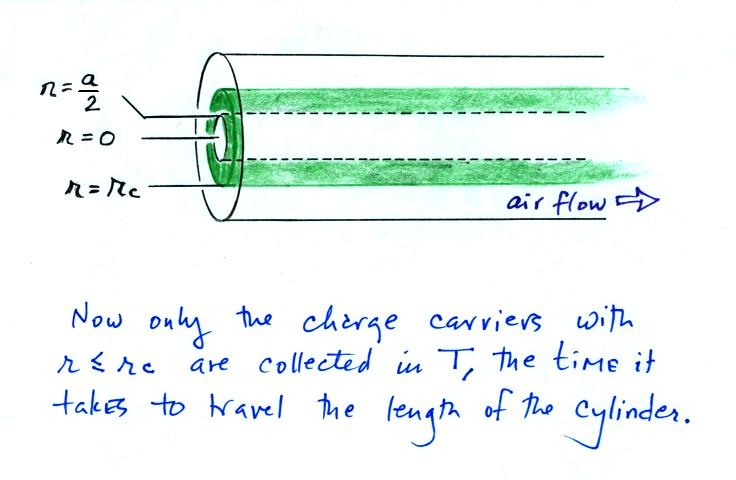
When functioning as a conductivity meter, only the small ions in a portion of the volume of air flowing through the cylindrical capacitor are collected (the green shaded volume in the figure below).
On an earlier figure (Point 3) we determined the time, T,
needed to travel from the outer electrode to the inner
electrode (from b/2
to a/2).
We'll write down the expression again but substitute rc for b/2 (see Point 7 below).
Note a small error in the notes handed out in class in
the 2nd and 3rd equation below has been corrected.
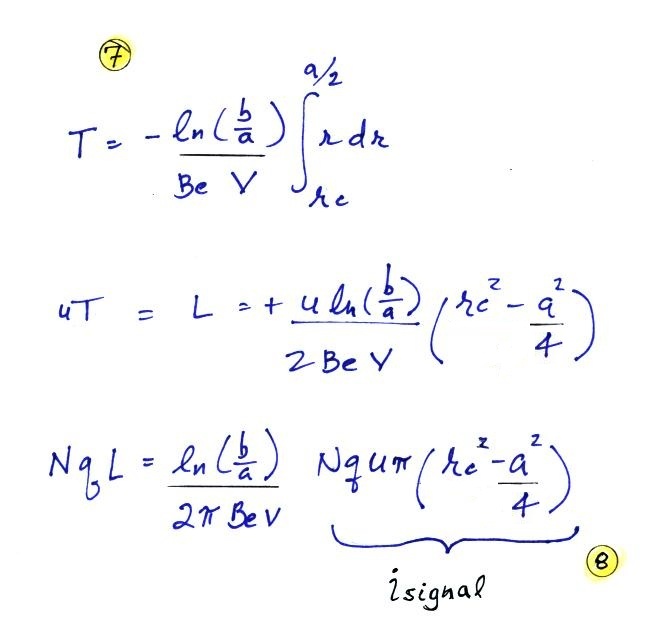
The last term at Point 8 is the rate at which the green shaded volume is flowing through the cylinder times N q. This is the charge collected at the inner conductor per unit time and is the signal current. Let's solve the expression for isignal and then try to relate the signal current to conductivity.
Next we will try to find an expression for the electric field in terms of the potential difference between the two cylinders.
It is a relatively easy matter to determine the capacitance
Let's look first at how an ion counter works. An ion counter will measure the concentration of small ions in the air (the concentration of ions of one polarity).
The electric field will cause a positively charged small ion entering the cylindrical capacitor at the left to drift toward the inner conductor with a drift velocity (vd). In time dt, the small ion will drift a distance dr (Point 1). The drift velocity, Point 2, is just the electrical mobility, Be, times the electric field. T at Point 3 is the time it will take the small ion to drift from the outer cylinder to the inner cylinder.
Now in order to be "counted" the small ion must make it to the center conductor before it travels a distance L, the length of the cylindrical capacitor.
Mobile ions are more likely to make it to the center electrode. So another way of looking at this is in terms of a critical mobility, Bc.
Ions with a mobility Be greater than Bc will be collected, the others won't. The volumetric flow rate is an easier parameter to measure than the horizontal speed. So we can rewrite Bc in terms of flow rate.
We want Bc to be small so that all of the small ions have a mobility greater than Bc and can be counted. Clearly the lower the flow rate and the longer the tube, the more time the small ions will spend in the capacitor and the more likely they will be collected. Increasing the potential difference between the two cylinders will increase the strength of the electric field and the inward drift velocity of the small ions.
We'll assume that all of the small ions of one polarity are collected by the center electrode as they pass through the cylinder. The current flowing to the center electrode would then be the product of the small ion concentration, the charge per small ions, and the volumetric flow rate. Later in this lecture we will look at instrumentation that could be used to measure this (small) current.
When functioning as a conductivity meter, only the small ions in a portion of the volume of air flowing through the cylindrical capacitor are collected (the green shaded volume in the figure below).
The last term at Point 8 is the rate at which the green shaded volume is flowing through the cylinder times N q. This is the charge collected at the inner conductor per unit time and is the signal current. Let's solve the expression for isignal and then try to relate the signal current to conductivity.
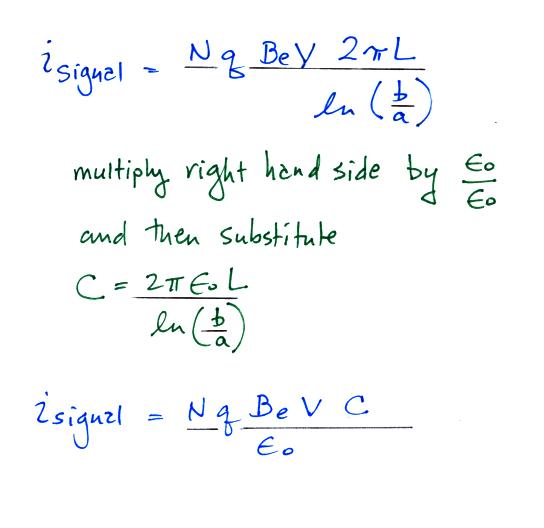
We substitute in for
capacitance and next we recall that N Be q is
conductivity.
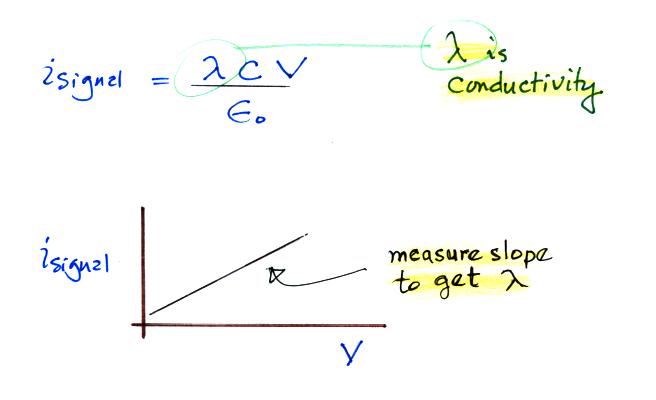
There is a linear relationship between isignal and V. The slope of a plot of isignal vs V should provide an estimate of conductivity. And again because we collect only one polarity of small ion we aren't measuring the total conductivity. The total conductivity depends on charge carriers of both polarities.
The following figure shows a conventional ion counter/conductivity meter design and an op-amp circuit that could be used to measure the signal current (Vout = signal current x R).
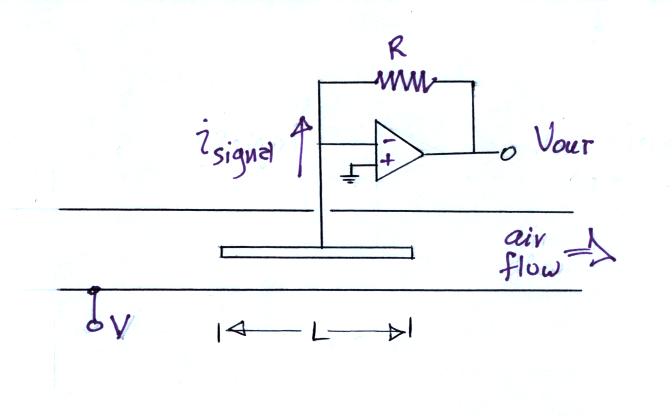
Note how the op-amp keeps the center conductor at ground potential. Because the signal current is very small, a large feedback resistor is needed in the op-amp circuit (1013 ohms was used in the "instrument" demonstrated in class).
When the outer cylinder is connected to +V as shown above, positive charge carriers will move to the center conductor and will produce the current signal shown above. Because this is connected to the - input of the amplifier we should see a negative polarity output voltage. Similarly when the outer cylinder is connected to -V, negative charge carriers will flow to the center conductor, the signal current will reverse polarity and the output voltage will be positive.
We did verify that this was happening with the crude instrument that was operated in class. Here's a summary of those measurements (the numbers below are from the 2013 edition of the course, I'll update them with 2015 numbers after class).
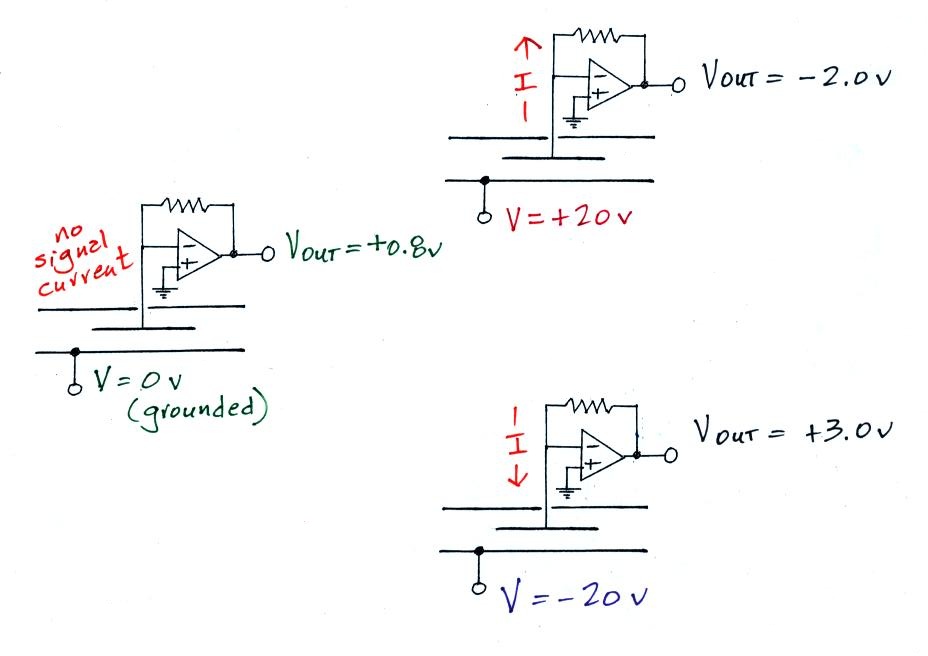
The meter was first operated with 0 volts connected
to the outer cylinder. The amplifier output
voltage was 0.8 v. When the outer cylinder was
connected to +20 v, the output was -2.0. This is a
net change of -2.0 - 0.8 volts = - 2.8 v.
An output voltage of +3.0, a change of 3.0 - 0.8 = +2.2
volts, was observed when the outer cylinder was
connected to -20 volts.
Thus the instrument was operating more or less as expected.
The photograph below is from a paper describing measurements of air conductivity under thunderstorms in Florida ("Ground Level Measurements of Air Conductivities Under Florida Thunderstorms," R.J. Blakeslee & E. P. Krider, J. Geophys. Res., 97, 12947-12951, 1992). Three conductivity meters were operated simultaneously. One was connected to positive voltage, one was grounded, and one was connected to negative voltage, much as we did in the class demonstration.
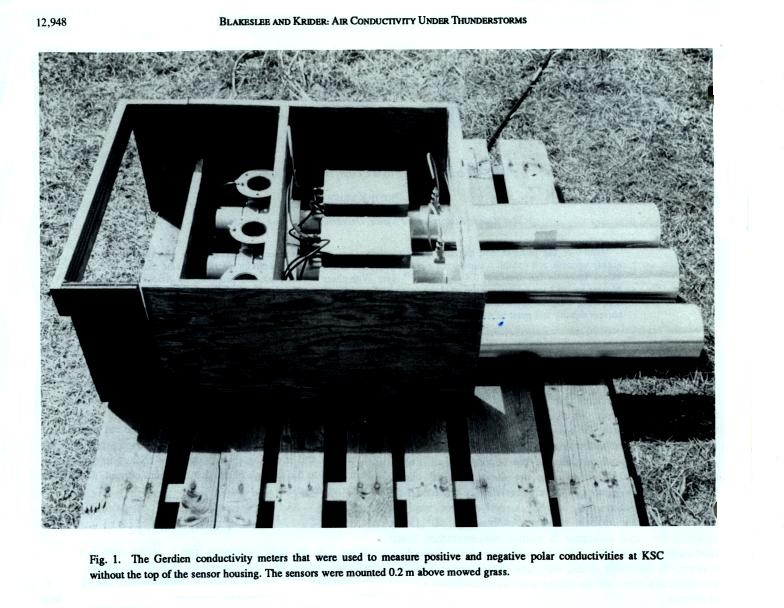
The sensors were kept in a wooden box (uncovered in
the photo) to protect them and the electronics from
rain. Air was drawn in through the three tubes at
right.
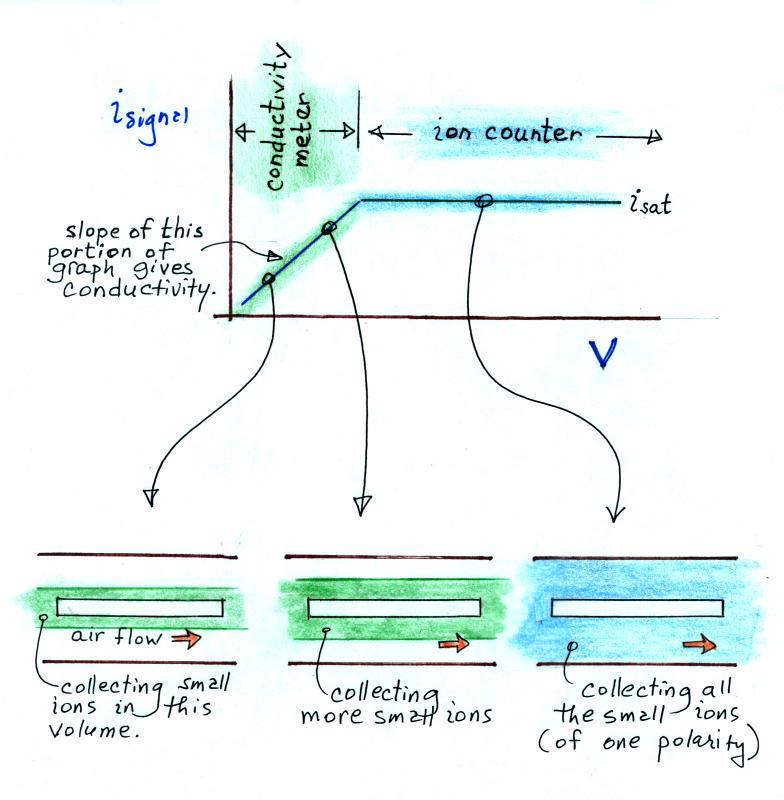
In this last figure we get a better idea of how this instrument can function as either a conductivity meter or an ion counter and how it transitions from one to the other.
For a given rate of air flow through the cylindrical capacitor we monitor the signal current as the potential difference between the outer and inner conductors is increased. As V increases small ions in a growing volume of air are collected and measured. The signal current increases. Eventually all of the small ions are collected and the signal current flattens out (saturates).
The slope of the linearly increasing, early portion of the plot (shaded green above) provides an estimate of conductivity. The amplitude of the signal current, once it has flattened out (blue) can be related to small ion concentration.
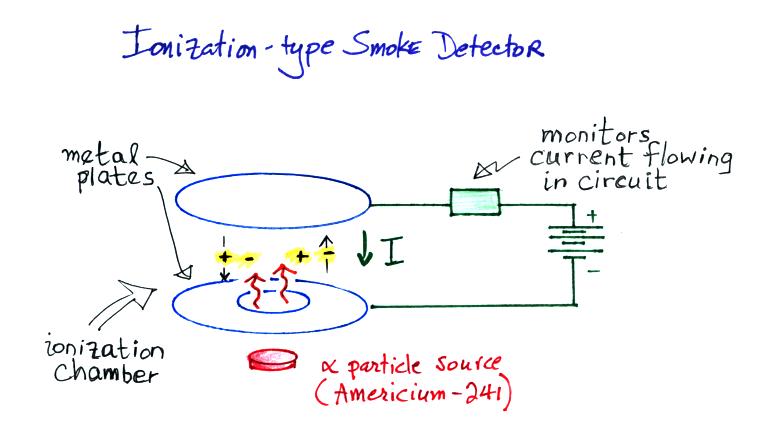
A common household ionization-type smoke detectors is really just a very basic conductivity meter.
There is a linear relationship between isignal and V. The slope of a plot of isignal vs V should provide an estimate of conductivity. And again because we collect only one polarity of small ion we aren't measuring the total conductivity. The total conductivity depends on charge carriers of both polarities.
The following figure shows a conventional ion counter/conductivity meter design and an op-amp circuit that could be used to measure the signal current (Vout = signal current x R).
Note how the op-amp keeps the center conductor at ground potential. Because the signal current is very small, a large feedback resistor is needed in the op-amp circuit (1013 ohms was used in the "instrument" demonstrated in class).
When the outer cylinder is connected to +V as shown above, positive charge carriers will move to the center conductor and will produce the current signal shown above. Because this is connected to the - input of the amplifier we should see a negative polarity output voltage. Similarly when the outer cylinder is connected to -V, negative charge carriers will flow to the center conductor, the signal current will reverse polarity and the output voltage will be positive.
We did verify that this was happening with the crude instrument that was operated in class. Here's a summary of those measurements (the numbers below are from the 2013 edition of the course, I'll update them with 2015 numbers after class).
Thus the instrument was operating more or less as expected.
The photograph below is from a paper describing measurements of air conductivity under thunderstorms in Florida ("Ground Level Measurements of Air Conductivities Under Florida Thunderstorms," R.J. Blakeslee & E. P. Krider, J. Geophys. Res., 97, 12947-12951, 1992). Three conductivity meters were operated simultaneously. One was connected to positive voltage, one was grounded, and one was connected to negative voltage, much as we did in the class demonstration.
In this last figure we get a better idea of how this instrument can function as either a conductivity meter or an ion counter and how it transitions from one to the other.
For a given rate of air flow through the cylindrical capacitor we monitor the signal current as the potential difference between the outer and inner conductors is increased. As V increases small ions in a growing volume of air are collected and measured. The signal current increases. Eventually all of the small ions are collected and the signal current flattens out (saturates).
The slope of the linearly increasing, early portion of the plot (shaded green above) provides an estimate of conductivity. The amplitude of the signal current, once it has flattened out (blue) can be related to small ion concentration.
A common household ionization-type smoke detectors is really just a very basic conductivity meter.
Alpha particles from
a small amount of radioactive Americium-241 ionizes
the air between two metal plates. The plates
are connected to a battery and the voltage
difference causes a weak current to flow between the
plates.
The current flowing through the ionization chamber drops significantly when smoke enters the chamber. This is because the charge carriers quickly stick to any smoke particles that enter the ionization chamber and suffer a large drop in their electrical mobility. The drop in current is sensed and used to sound the alarm.
The smoke detector was opened and the conductivity chamber was placed near the opening of the class conductivity meter. My thinking was that some of the additional charge carriers created by the Americium-241 source would be drawn into the conductivity meter and we should be able to see a larger output signal. That did seem to be the case.
Here's a good video explanation embedded in a larger Wikipedia article.
An to finish off another example of another conductivity "meter", the so-called Nu-Klear Detector.
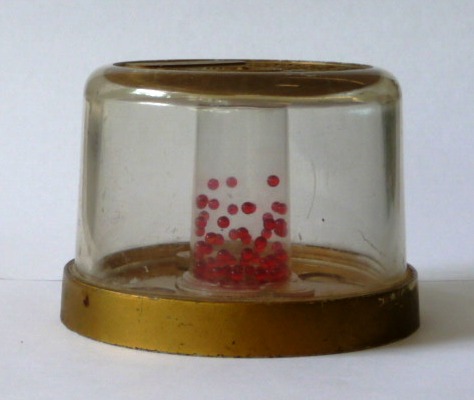
The instructions read "Shake gently until some
beads float. Seek shelter at once if all beads
drop. Remain in shelter until some beads
float." Shaking the device charges the red
beads in the center cylinder (probably another
example of triboelectric charging). If
ionizing radiation is present (such as would be the
case following a nuclear explosion) the air in the
cylinder would become conducting and would
neutralize the charge on the beads. They'd
fall to the bottom of the device. You
can read more about it here.
The current flowing through the ionization chamber drops significantly when smoke enters the chamber. This is because the charge carriers quickly stick to any smoke particles that enter the ionization chamber and suffer a large drop in their electrical mobility. The drop in current is sensed and used to sound the alarm.
The smoke detector was opened and the conductivity chamber was placed near the opening of the class conductivity meter. My thinking was that some of the additional charge carriers created by the Americium-241 source would be drawn into the conductivity meter and we should be able to see a larger output signal. That did seem to be the case.
Here's a good video explanation embedded in a larger Wikipedia article.
An to finish off another example of another conductivity "meter", the so-called Nu-Klear Detector.