Monday Apr. 13, 2015
In this class we'll take a quick look at fast time
resolved lightning spectroscopy. Spectroscopic measurements
have been used to determine some interesting and important
properties of the lightning channel such as temperature and
pressure. Also we need to take note of some of the bright
spectral emissions that might be used to detect and locate
lightning from a satellite.
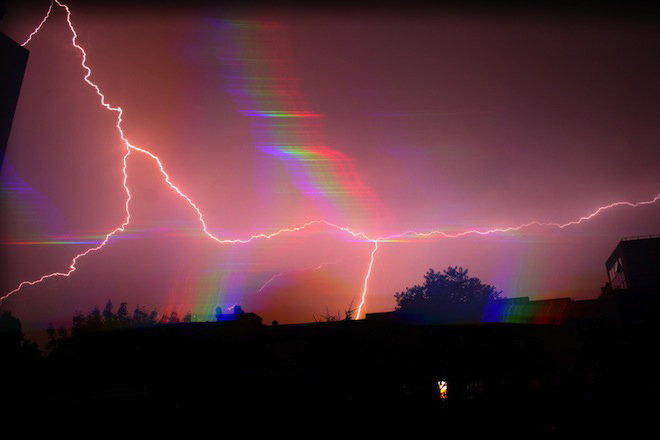
The image above was most likely captured by placing a
diffraction grating in front of the camera lens
Fast time resolved lightning spectroscopy
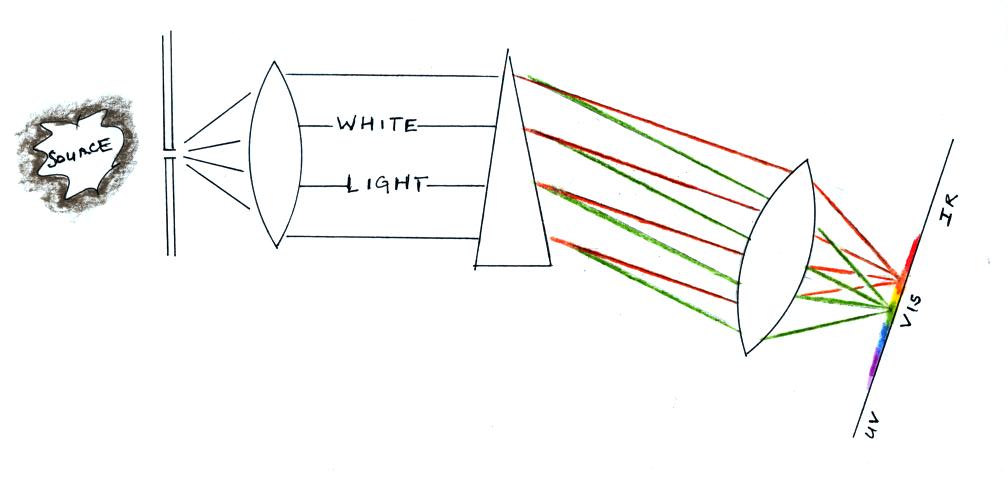
A conventional spectrometer is shown in the figure below
Light from an extended source enters the spectrometer through a
narrow slit which is positioned at the focal point of a
collimating lens. The parallel rays of light then passes
through a prism or diffraction grating and are refracted and
dispersed. These rays are focused onto a detector with a
second lens. The spectrum that is obtained is a multitude of
images of the entrance slit, each at a different wavelength,
spread out across the detector.
A schematic diagram of a somewhat simpler "slitless" spectrometer
design is shown below (the lenses have been left out of the
figure).
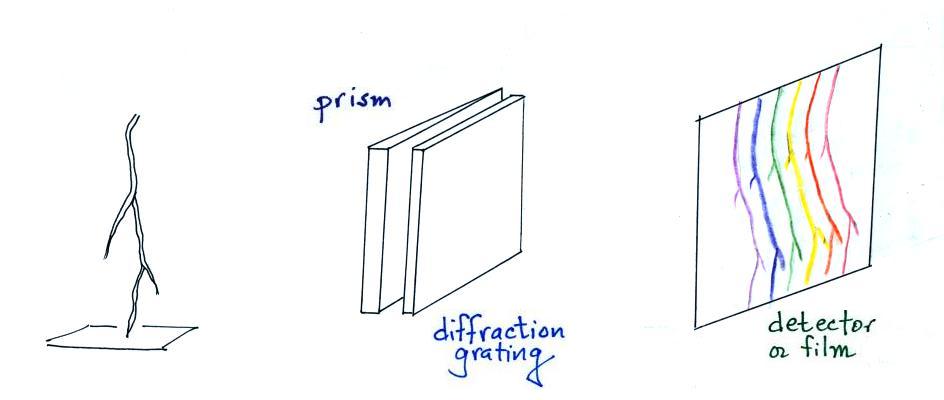
Light from a lightning channel
passes through both a prism and a diffraction grating and is
imaged on film (or a detector of some kind). An entrance
slit is not needed because the lightning channel is
essentially a line source. The spectrum that you would
obtain in this case would be a series of images of the channel
at each of the wavelengths emitted by the discharge. In
a
1961 article in Science, Leon Salanave explains that
both a prism and a diffraction grating were used and arranged
"so that their respective deviations counterbalance, to make a
more 'straight-through' optical system." Salanave
directed much of the lightning spectroscopic work done at the
University of Arizona for several years. He is also the
author of "Lightning and Its Spectrum " published by the
University of Arizona Press in 1980.
Here's a modern implementation of the principle


These images are from an online
PowerPoint presentation "Lightning Spectroscopy" by T.
Walker, H. Christian, and D. Sentman. The camera is a
Phantom v710 with a CMOS 1280x800 array with 12 bit dynamic
range (in a separate
conference publication the resolution was reduced to
1040 x 8 pixels so that 673 k images could be acquired per
second).
An example spectrum obtained with the system above from a
triggered lightning discharge (probably early during the
continuing current portion of the discharge) is shown below.
Many of these spectral features appear to be from
vaporization of the copper wire used to trigger the discharge.
In the early studies a time resolved spectrum was obtained
by isolating a vertical segment of the lightning
channel. The spectrum was recorded on moving film.
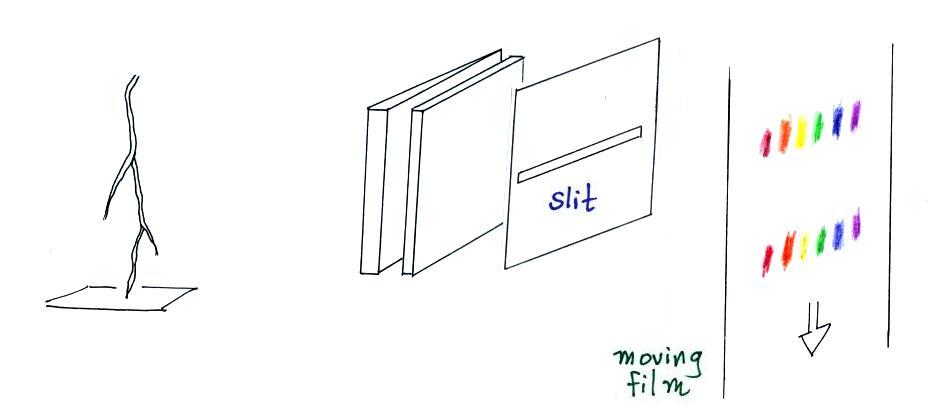
The film is shown moving
downward in this picture (and sorry that the perspective
isn't quite right). Spectra from two separate return
strokes, perhaps, have been recorded on the film.
Here are actual implementations that provide moderate
and very fast time resolution (from E.P.
Krider,
"Lightning
Spectrosocpy,"
Nuclear
Instruments and Methods, 110, 411-419, 1973).
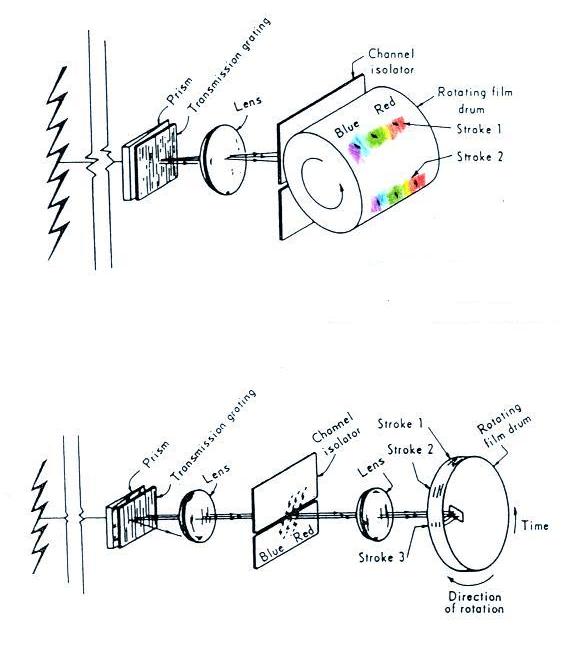
The rotating drum in the lower figure provides the
fastest time resolution. Rapidly rotating drums
in streaking cameras are also used in photographic
measurements of return stroke velocity.
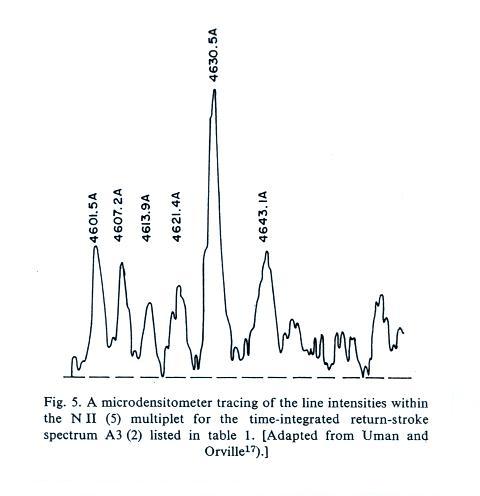
The next figure shows an actual example of a very
fast time resolved spectrum from a return stroke.
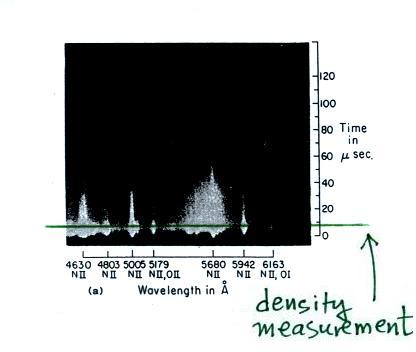
Several emission features are identified on this
spectrum early in the return stroke discharge (NII
denotes a singly ionized nitrogen atom). Now
what is usually done next is to scan across the
film image using a densitometer at say perhaps the
level of the green line (i.e. at a time about 10
microseconds after the beginning of the return
stroke).
but I'm guessing
it looks something like shown here.
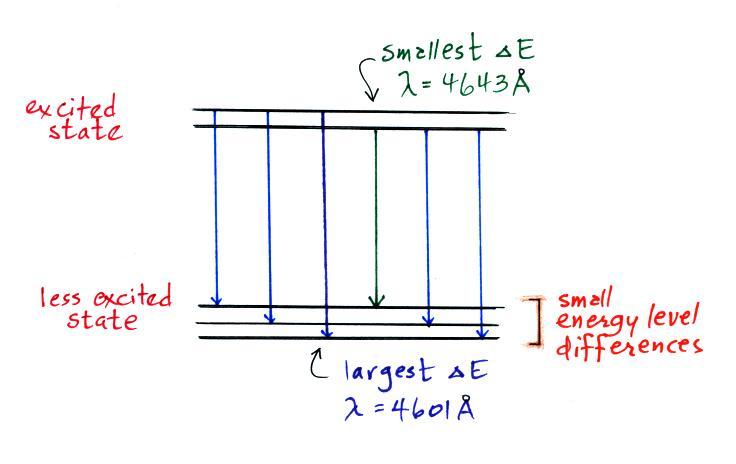
Transitions from 2 slightly different energy
levels from an excited state to 1 of 3 levels at a
lower energy state could produce emissions of 6
slightly different wavelengths.
In any event it is the relative amplitudes of
lines in a multiplet group that can be used to
estimate lightning channel temperature. The
procedure is described below. Our goal is
not understand all the steps but rather to get a
flavor for the procedure or method.
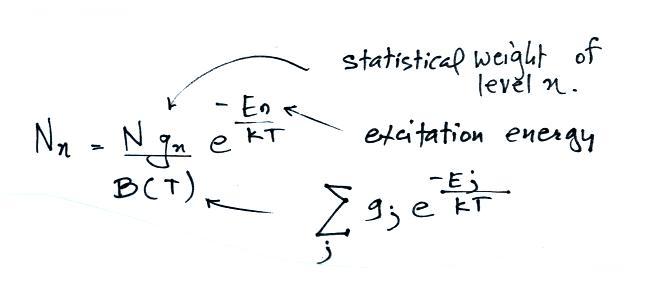
The first assumption made is that the number of
atoms in a particular energy level can be
described using a Maxwell-Boltzmann distribution
Nn is the
number of atoms in energy level n, N is the total
number of atoms.
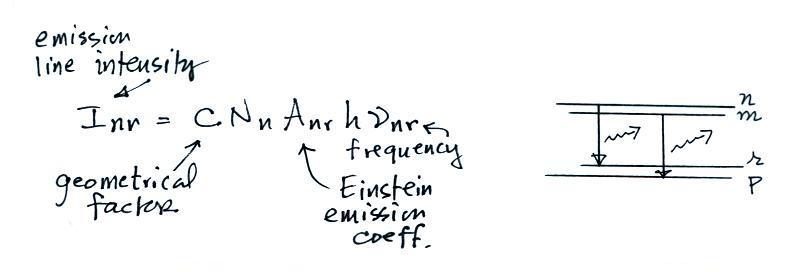
The intensity of the emission produced by transitions
from energy level n to r is shown above.
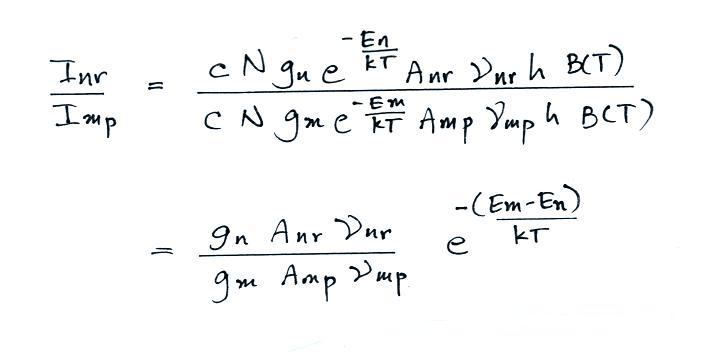
Now we will look at the ratio of measured intensities
from two different transitions: n to r and m to p
It is these transition intensities that can be
measured on the fast time resolved lightning
spectra. Note that many of the parameters
cancel. This is fortunate because some of them
(such as the geometric factor) might be difficult to
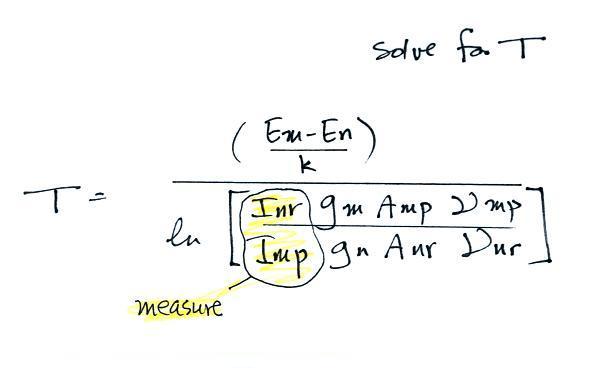
determine. Solving for temperature yields
Often what is done is that several determinations
of temperature are made using different combinations
of lines in the multiplet group and an average is
computed. In the case of the NII(5) multiplet 5
ratios could be computed: 4630/4601, 4630/4607,
4630/4613, 4630/4621, and 4630/4643.
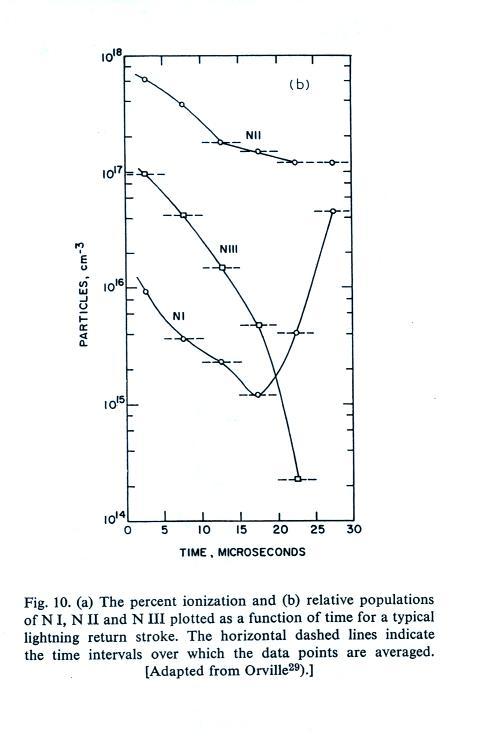
The next several figures shown some of the results
of these spectroscopic measurements and analyses.
Concentrations of NIII (doubly ionized atomic
nitrogen), NII (singly ionized atomic nitrogen), and
NI (neutral atomic nitrogen) early in a return stroke
discharge. NII is initially the most abundant
species and is used in spectroscopic determinations of
peak temperature in the return stroke channel.
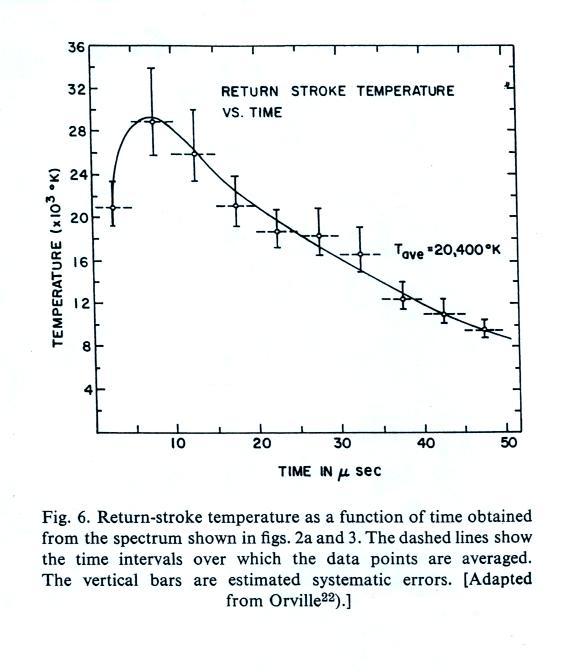
Estimate of peak return stroke channel
temperature. The value approaches 30,000 K which
is approximately 5 times hotter than the surface of
the sun (6000 K).
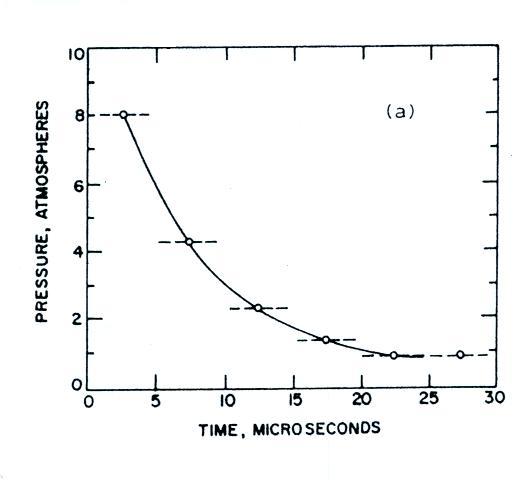
Here are estimates of channel pressure. This
requires a measurement of temperature and probably
density (including electron density from the ionized
air molecules).
references:
T.D. Walker and H.J. Christian, "Novel Observations
in Lightning Spectroscopy," XV International
Conference on Atmospheric Electricity, Norman OK,
2014.