Tuesday Mar. 24, 2015
Selections from The Beatles before class today: "You Can't Do
That", "I
Should Have Known Better", "If I Fell",
"Tell Me Why",
"I'll Cry
Instead", "Things We
Said Today", and "I'll Be Back".
I hope you had a nice Spring Break. I spend a large
portion of my time catching up on the grading. Everything in
my possession has been graded and was returned in class today
together with "midterm" grade summaries. More about the
grade summaries at the end of today's notes.
Everyone should already have completed an experiment or should
be currently working on an experiment. You should check with
me if that isn't the case for you. The Experiment #3 reports
and the Expt. #2 revised reports are both due next Tuesday (March
31). Unless I tell you differently all other outstanding
reports are due by Tuesday April 7. That will give me time
to get them graded, return them to you, and give you ample time to
revise your report if you want to.
We needed to finish up a few short greenhouse effect-related
topics before moving onto something new.
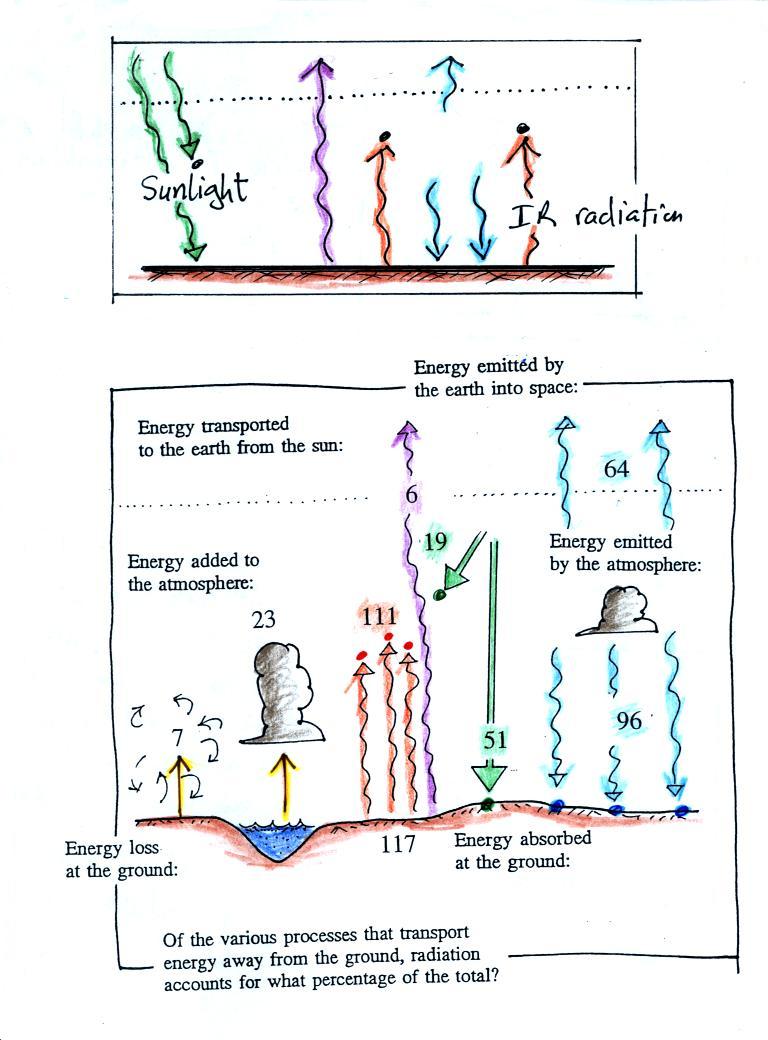
A more realistic picture of energy balance on the earth.
The top part of the figure below is our simplified
representation of energy balance. We tried to keep
this as basic as possible so that you can understand how the
greenhouse effect works.
In the top figure you should recognize the incoming
sunlight (green), IR emitted by the ground that passes through the
atmosphere (violet), IR radiation emitted by the ground that is
absorbed by greenhouse gases in the atmosphere (orange) and IR
radiation emitted by the atmosphere (blue).
The lower part of the figure is pretty complicated. It would
be difficult to start with this figure and find the greenhouse
effect in it. That's why we used a simplified version.
Once you understand the upper figure, you should be able to find
and understand the corresponding parts in the lower figure (I've
tried to use the same colors for each of the corresponding parts).
Some of the incoming sunlight (51 units in green) reaches the
ground and is absorbed. 19 units of sunlight are absorbed by
gases in the atmosphere. The 30 units of reflected sunlight
weren't included in the figure.
The ground emits a total of 117 units of IR light. Only 6
shine through the atmosphere and go into space. The
remaining 111 units are absorbed by greenhouse gases.
There were 3 things I wanted you to notice in the
bottom figure and try to explain.
(1). How can the
ground be emitting more energy (117 units) than it gets from the
sun (51 units). It is able to achieve energy balance
because it also gets energy from the atmosphere (96 units).
That's thanks to the greenhouse effect.
If you're really paying attention you would notice that 117 units
emitted doesn't balance 96 + 51 = 147 units absorbed. The
surface is emitting 117 units but an additional 30 units are being
carried from the ground to the atmosphere by conduction,
convection, and latent heat (at the far left of the figure).
That brings everything into balance (117 + 30 = 147). Note
how much smaller the energy transport by conduction, convection,
and latent heat are compared to radiant energy transport.
(2). Why are the amounts
of energy emitted upward (64 units) and downward (96 units)
different?
One reason might be that the lower atmosphere is warmer than the
upper atmosphere (warm objects emit more energy than cold
objects). But I think a better explanation is probably that
there is more air in the bottom of the atmosphere (the air is
denser) than near the top of the atmosphere. It is the air
in the atmosphere that is emitting radiation. More air
= more emission.
(3). The ground is receiving more
energy from the atmosphere (96 units) than it gets from the sun
(51 units)! Doesn't that seem odd? I think the
main reason for this is that the sun just shines for part of the
day. We receive energy from the atmosphere 24 hours per day,
365 days per year.
The effects of clouds on daytime high and
nighttime low temperatures
This can be found on pps 72a & 72b in the ClassNotes (I've
included a little more detailed discussion here than was done in
class). Before we go any further ask yourself
what you already know about this. For the last few days it
has been getting up into the low 80s during the day and dropping
into the low 50s at night. The skies have been clear.
If clouds were to appear they would lower the daytime high
temperature (form 80 to 75 or 70 F perhaps) and raise the
nighttime low (from 50 to maybe 60 F). Now we need to try to
understand why this happens.
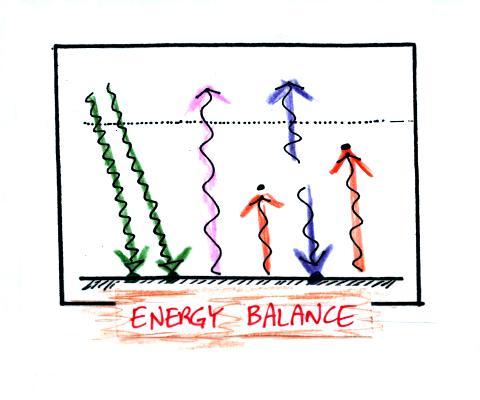
Here's the simplified picture of radiative equilibrium
again. You should be able to say something about
every arrow in the picture.
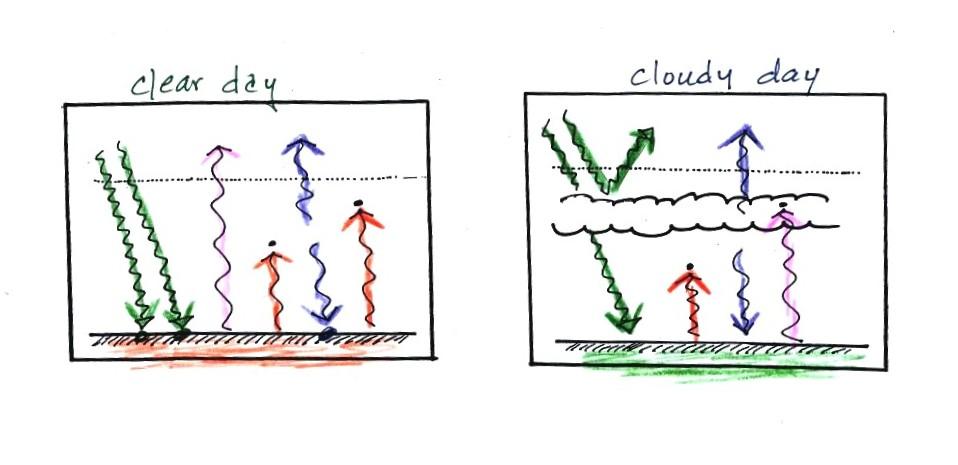
The next two figures compare clear and cloudy days.
Sunlight is made up of mostly visible and near-IR light.
The fact that clouds are white tells us they reflect visible
light. What about near IR light? Have a look at the
photograph of the tree near the start of the
Tue., Mar. 10 notes. The clouds in both pictures are
white, that tells us clouds are good reflectors of both visible
and near-IR light. The effect of this is to reduce the
amount of sunlight energy reaching the ground in the right
picture. With less sunlight being absorbed at the ground,
the ground won't warm up as much during the day.
It is generally cooler during the day on a cloudy day than on a
clear day.
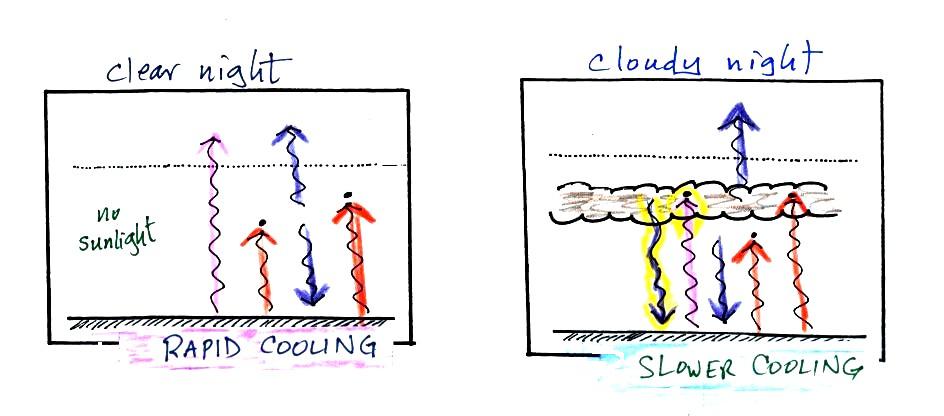
What happens at night. The first thing we need to do is to
remove the two arrows of sunlight.
Note first of all that neither picture is in radiative
equilibrium. The picture on the left shows a clear
night. The ground is losing 3 arrows of energy and getting
one back from the atmosphere. That's a net loss of 2
arrows. The ground cools rapidly and gets cold during the
night.
A cloudy night is shown at right. Notice the effect of
the clouds. Here's a surprising fact: clouds are
good absorbers
of far infrared
radiation (10 μm wavelength). If we could
see 10 μm far IR light, clouds would appear black,
very different from what we are used to (actually it would be more
complex than that because clouds also emit IR light, the clouds
might also glow). Because of the clouds none of the IR
radiation emitted by the ground passes through the atmosphere into
space. It is all absorbed either by greenhouse gases or by
the clouds. Because the clouds and atmosphere are now
absorbing 3 units of radiation they must emit 3 units: we'll draw
1 going upward into space, the other 2 downward to the
ground.
There is still a net loss of energy at the ground on the cloudy
night but it's smaller, only 1 arrow. The ground
won't cool as quickly and won't get as cold on a cloudy night as
it does on a clear night. That makes for very pleasant early
morning bicycle rides this time of the year.
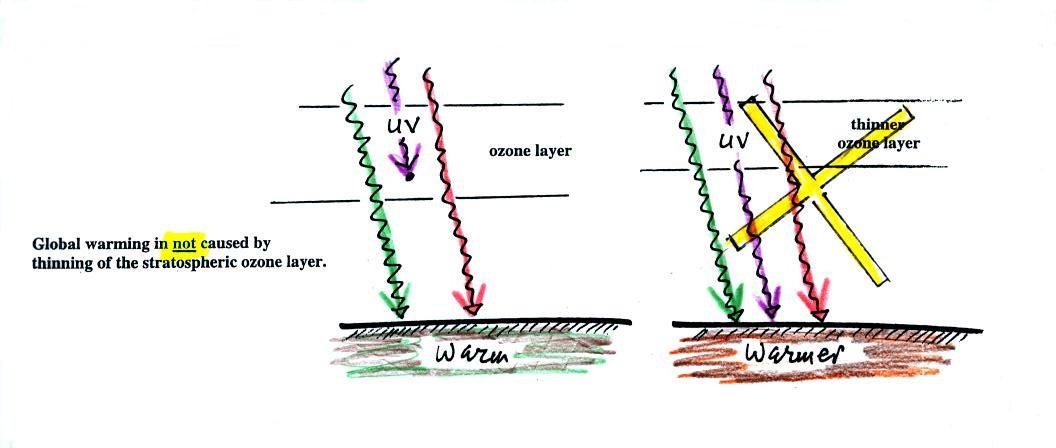
A common misconception about
the cause of global warming.
Many people know that sunlight contains UV light and that the
ozone layer absorbs much of this dangerous type of high energy
radiation. People also know that release of chemicals such
as CFCs are destroying stratospheric ozone and letting some of
this UV light reach the ground. That is all correct.
But then they conclude that it is this additional UV energy
reaching the ground that is causing the globe to warm. This is not correct.
There isn't much UV light in sunlight in the first place (only
about 7% of sunlight is UV) and just a portion of that would reach
the ground. The small amount of additional UV light reaching
the ground won't be enough to cause global warming. It will
cause cataracts and skin cancer and those kinds of problems but
not global warming.
If all 7% of the UV light in sunlight were to reach the ground
it probably would cause some warming. But it probably
wouldn't matter because some of the shortest wavelength and most
energetic forms of UV light would probably kill us and most other
forms of life on earth. We wouldn't be around long enough to
have to worry about climate change.
Enhancement of the greenhouse effect and global warming
Here's the real cause of global warming and the reason for
concern (this is also the last time you'll see these
energy balance pictures)
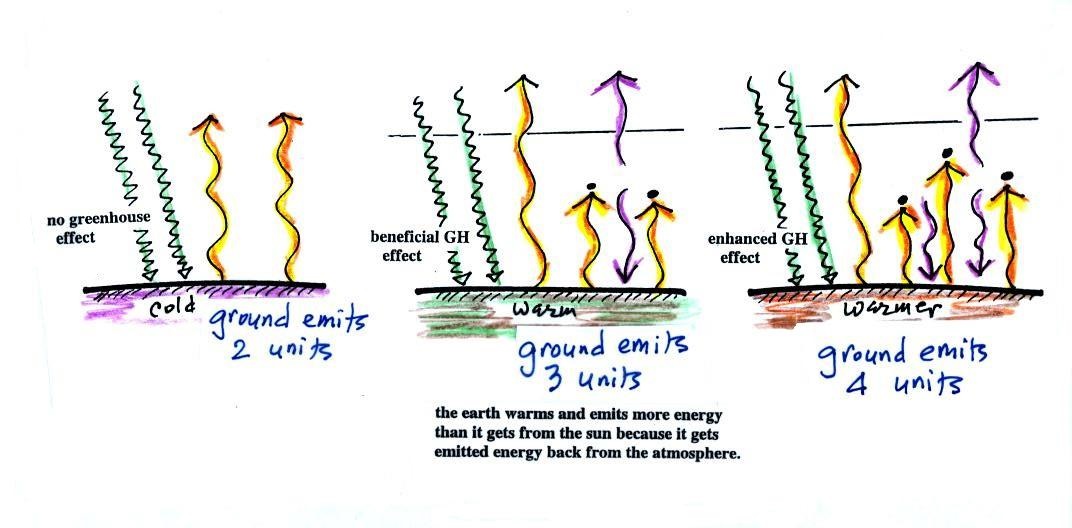
The figure (p. 72c in the photocopied Class
Notes) on the left shows energy balance on the earth without an
atmosphere (or with an atmosphere that doesn't contain
greenhouse gases). The ground achieves energy balance by
emitting only 2 units of energy to balance out what it is
getting from the sun. The ground wouldn't need to be very
warm to do this, only 0 F.
If you add an atmosphere and greenhouse gases, the atmosphere
will begin to absorb some of the outgoing IR radiation.
The atmosphere will also begin to emit IR radiation, upward into
space and downward toward the ground. After a period of
adjustment you end up with a new energy balance. The
ground is warmer and is now emitting 3 units of energy even
though it is only getting 2 units from the sun. It can do
this because it gets a unit of energy from the atmosphere.
This is what I refer to as the beneficial greenhouse
effect. It makes the earth more habitable by raising the
average surface temperature to 60 F.
In the right figure the concentration of greenhouse gases has
increased even more (due to human activities). The earth
might find a new energy balance. In this case the ground
would be warmer and could be emitting 4 units of energy, but
still only getting 2 units from the sun. With more
greenhouse gases, the atmosphere is now able to absorb 3 units
of the IR emitted by the ground. The atmosphere sends 2
back to the ground and 1 up into space. A new balance is
achieved but the earth's surface is warmer. How much
warmer? That's the big question.
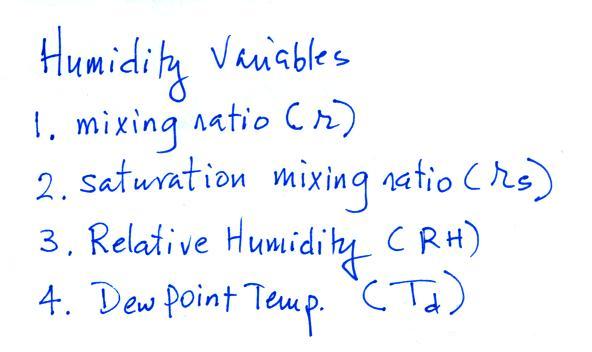
Next a new topic: humidity variables
Now a new block of
material on humidity and an introduction to humidity
variables. This topic and the terms
that we will be learning are probably new and might be
confusing. That's the reason for this
introduction. We will be mainly be
interested in 4 variables:
Your task will be to learn the "jobs" of
these variables, their units, and what can cause them to change
value.
An In-Class
Optional Assignment was handed out in class. You
were supposed to complete and turn in the assignment at the end
of class. If you weren't in class you can download the
assignment and turn it in before the start of class on Thursday.
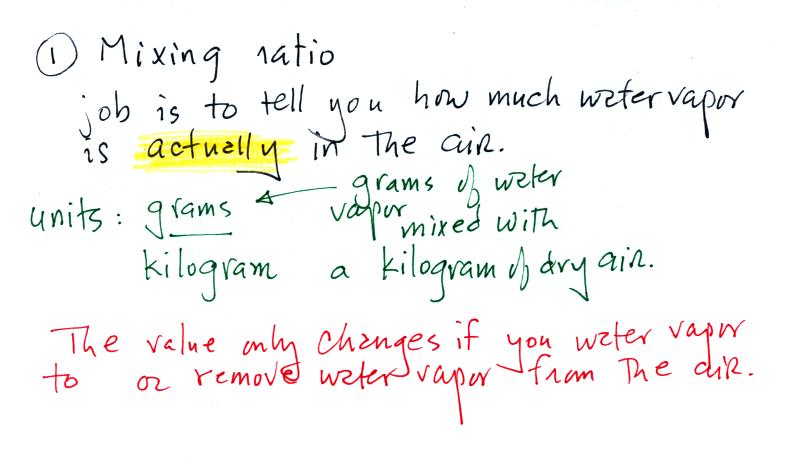
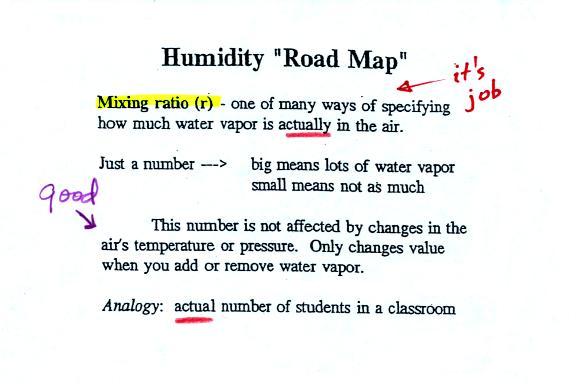
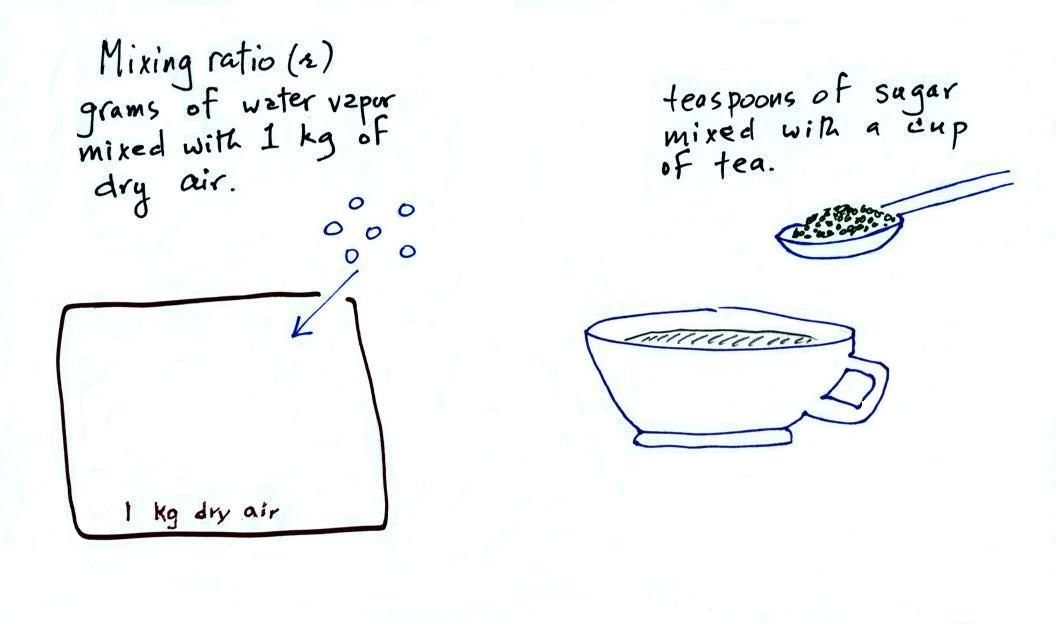
Mixing ratio
The bottom half of the figure below can be found on p. 83 in the
ClassNotes.
Mixing ratio tells you how much water vapor
is actually in
the air. Mixing ratio has units of grams of water
vapor per kilogram of dry air (the amount of water vapor in
grams mixed with a kilogram of dry air). A kilogram of air
is about one cubic meter of air (about one cubic yard of
air). Mixing ratio is basically the same idea as teaspoons of sugar mixed in
a cup of tea.
The value of the mixing
ratio won't change unless you add water vapor to or remove
water vapor from the air. Warming the air won't change
the mixing ratio. Cooling the air won't change the
mixing ratio (with
one exception - when the air is cooled below its
dew point temperature and water vapor starts to
condense). Since the mixing ratio's job is to tell you
how much water vapor is in the air, you don't want it to
change unless water vapor is actually added to or removed
from the air.
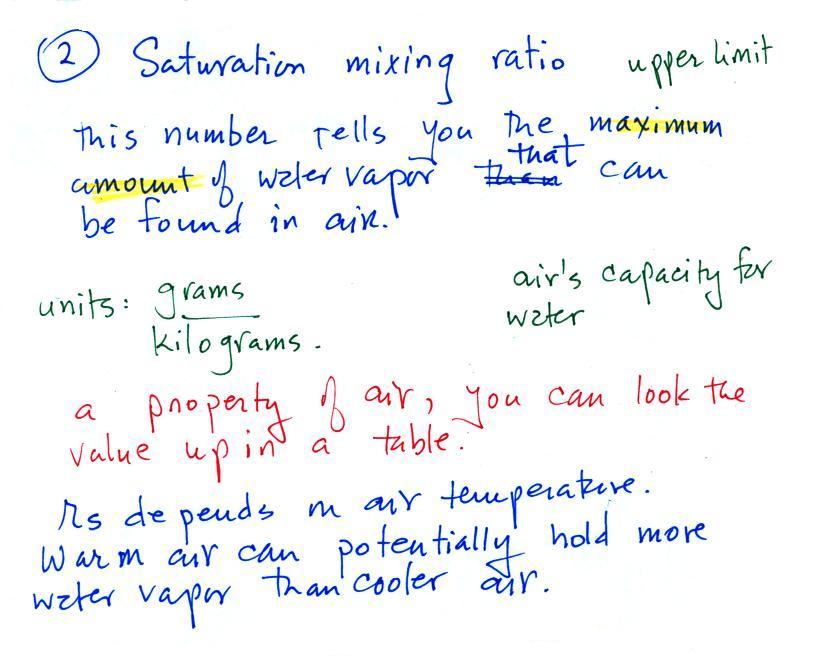
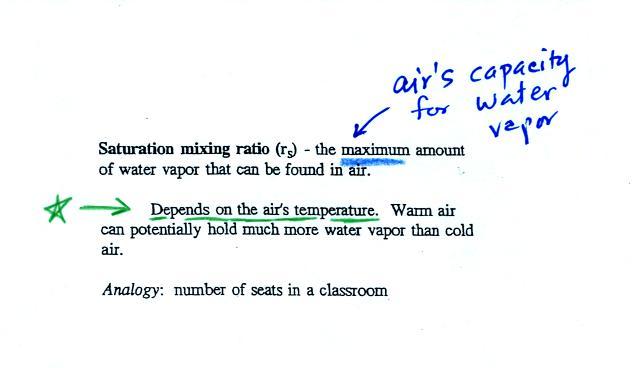
Saturation mixing ratio
Saturation mixing ratio is just an upper limit to
how much water vapor can be found in air, the air's capacity for
water vapor. It's a property of air and depends on the
air's temperature; warm air can potentially hold
more water vapor than cold air. It doesn't
say anything about how much water vapor is actually in the air
(that's the mixing ratio's job). This
variable has the same units: grams of water vapor per kilogram
of dry air. Saturation mixing ratio values for different
air temperatures are listed and graphed on p. 86 in the
ClassNotes.
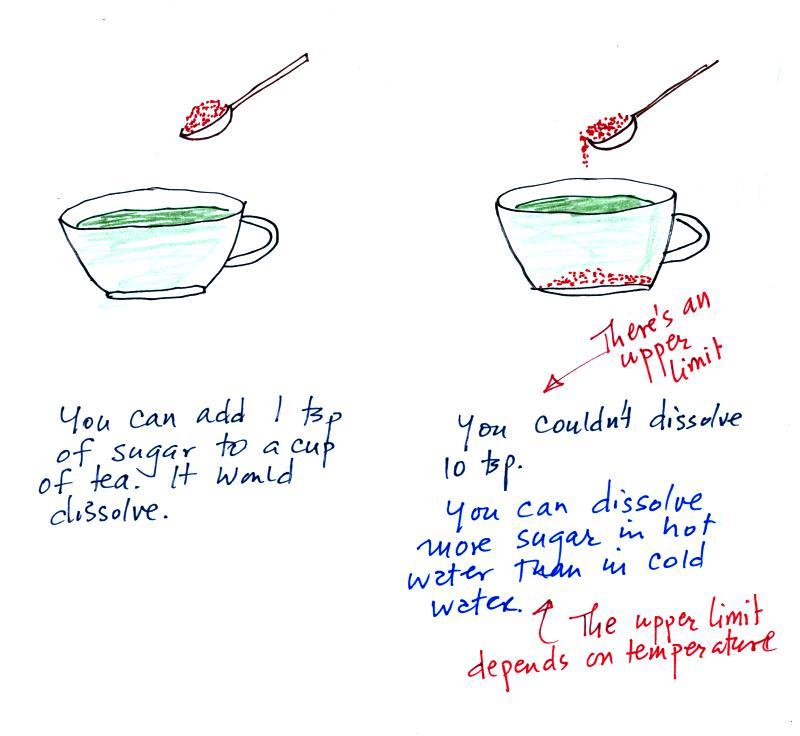
The sugar dissolved in tea analogy is still helpful.
Just as is the case with water vapor in air, there's a limit
to how much sugar can be dissolved in a cup of hot
water. And not only that, the amount depends on
temperature: you can dissolve more sugar in hot water than in cold
water.
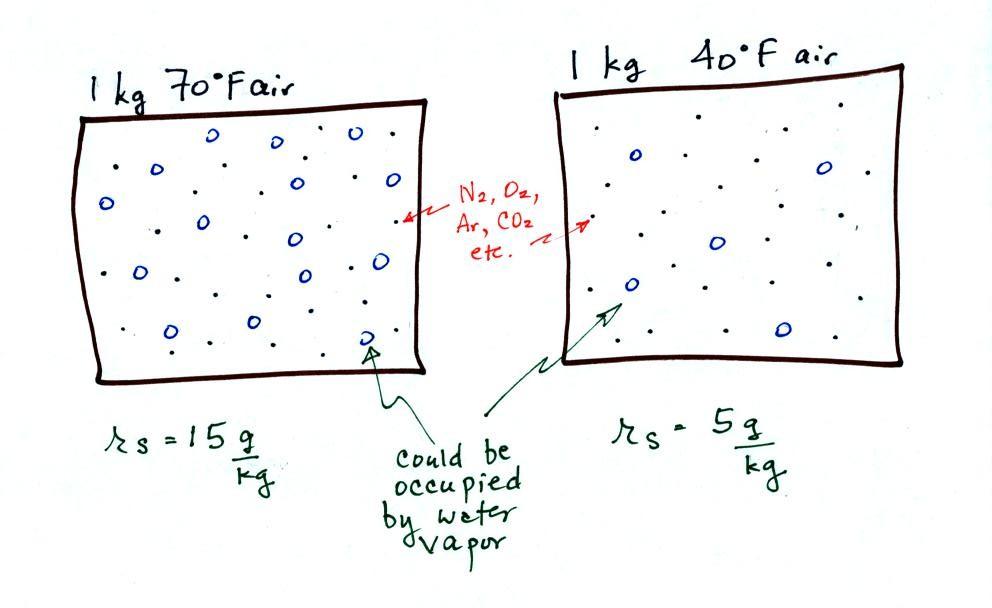
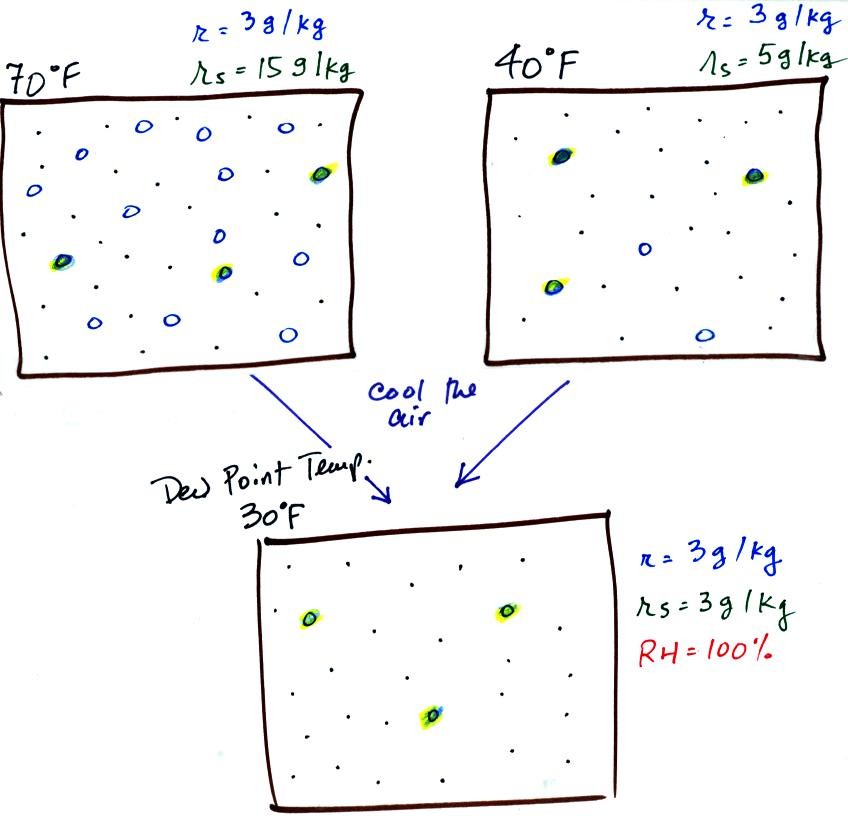
The dependence of saturation mixing ratio on air
temperature is illustrated below:
The small specks represent all
of the gases in air except for the water vapor. Each of
the open circles represents 1 gram of water vapor
that the air could potentially hold. There are 15 open
circles drawn in the 1 kg of 70 F air; each 1 kg of 70 F air
could hold up to 15 grams of water vapor. The 40 F air
only has 5 open circles; this cooler air can only
hold up to 5 grams of water vapor per kilogram of dry air.
The numbers 15 and 5 came from the table on p. 86.
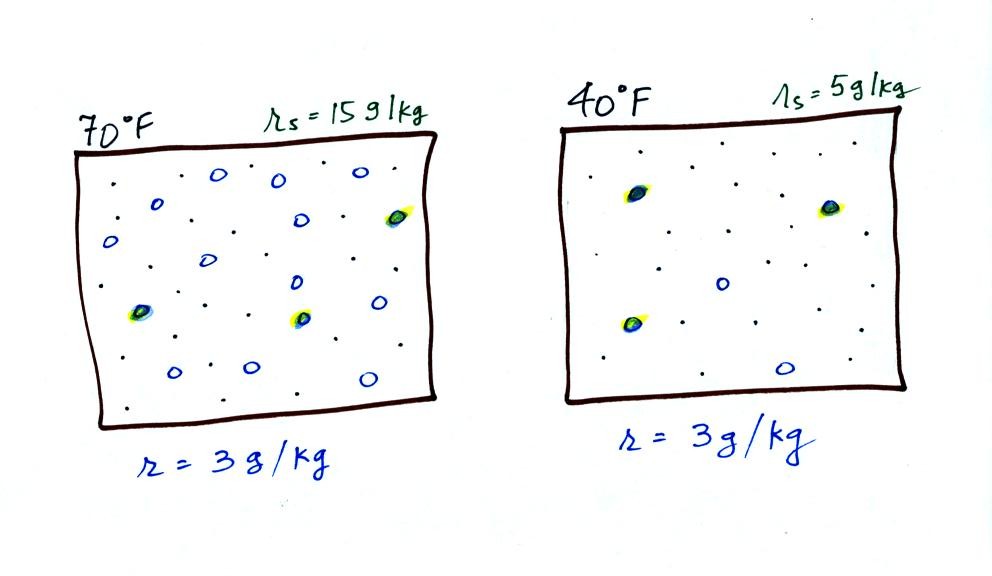
Now we have gone and actually
put some water vapor into the volumes of 70 F and 40 F air (the
open circles are colored in). The same amount, 3 grams of
water vapor, has been added to each volume of air. Three
of the open circles have been colored in. The mixing
ratio, r, is 3 g/kg in both cases.
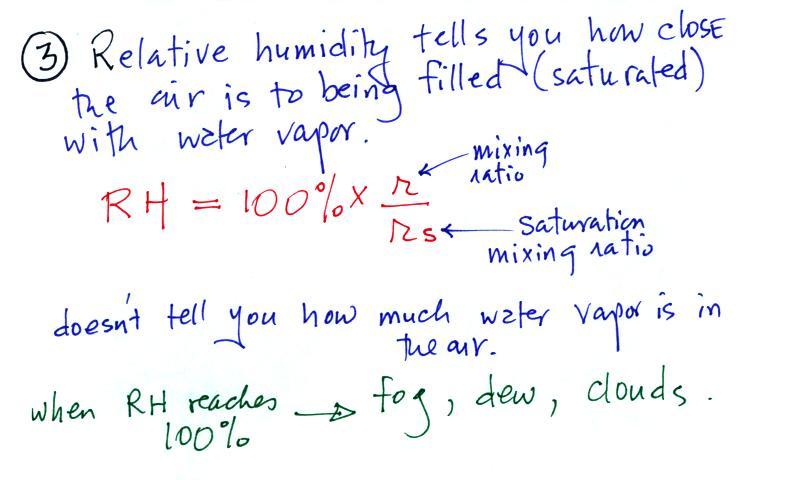
Relative humidity
After looking at the figure above you might be able to figure
out what relative humidity is
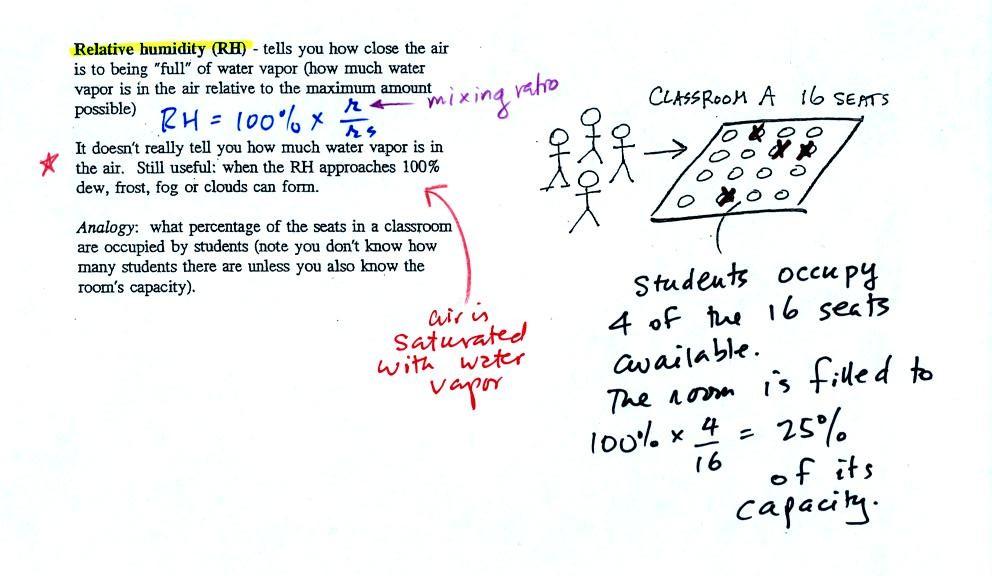 |
The relative humidity is the
variable most people are familiar with. It tells you how
"full" the air is with water vapor, how close it is to being
filled to capacity with water vapor, how close
the air is to being "saturated" with water vapor.
RH has units of %.
In the analogy (sketched on the right hand side of p. 83 in
the photocopied notes) 4 students wander into Classroom A which
has 16 empty seats. Classroom A is filled to
25% of its capacity. You can think of 4, the
actual number of students, as being analogous to the mixing
ratio. The classroom capacity is analogous to the
saturation mixing ratio. How full the room is is analogous
to the relative humidity.
The figure below goes back to the volumes (1 kg each) of 70 F
and 40 F air that could potentially hold 15 grams or 5 grams of
water vapor.
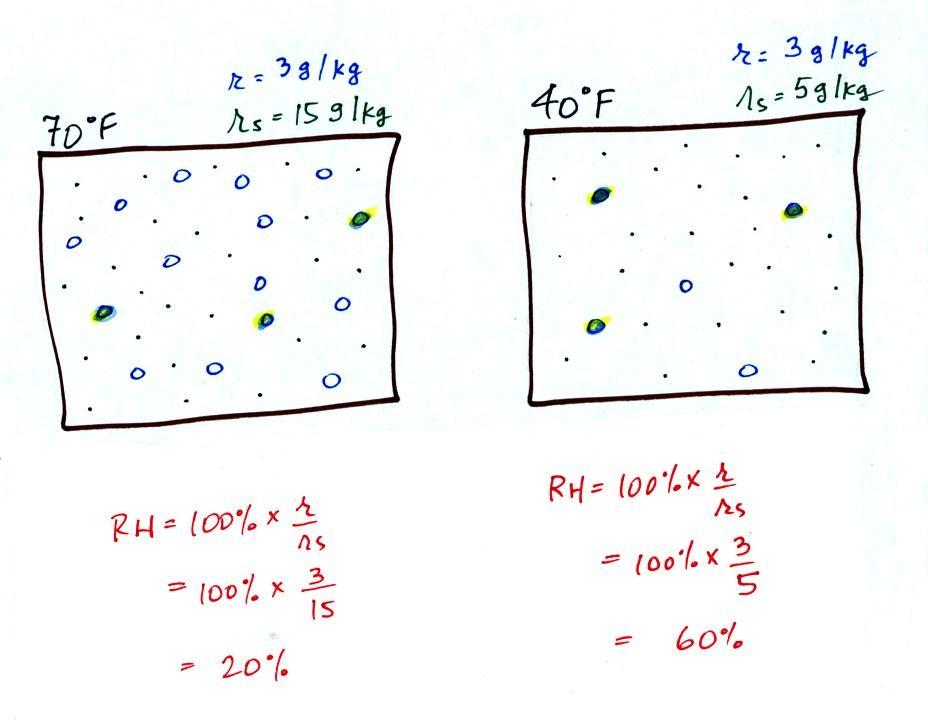
Both the 70 F and the 40 F air each contain 3
grams of water vapor. The 70 F air is only filled to 20%
of capacity (3 of the 15 open circles is colored in) because
this warm air's capacity, the saturation mixing ratio, is
large. The RH in the 40 F is 60% even though it has the
same actual amount of water vapor because the 40 F air can't
hold as much water vapor and is closer to being
saturated.
Something important to note: RH doesn't really
tell you how much water vapor is actually in the air.
The two volumes of air above contain the same amount of water
vapor (3 grams per kilogram) but have very different values of
relative humidity. You could just as easily have two
volumes of air with the same relative humidity but different
actual amounts of water vapor.
What is the RH good for if it doesn't tell you how much
moisture is in the air? When the RH reaches 100% dew, fog,
and clouds form. RH tells you whether clouds or fog are
about to form or not.
Dew point temperature
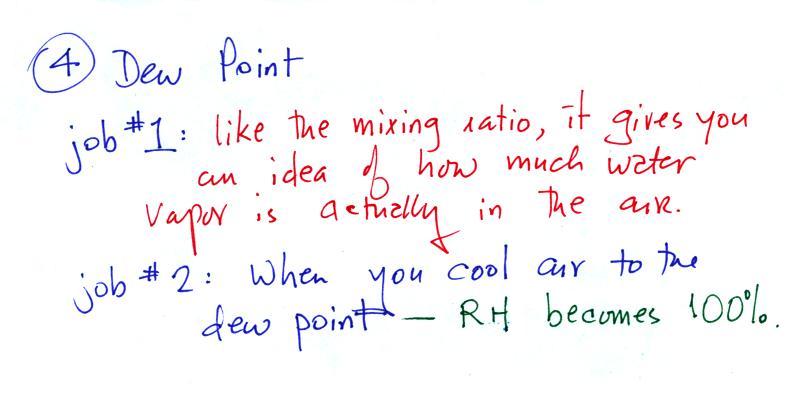
|
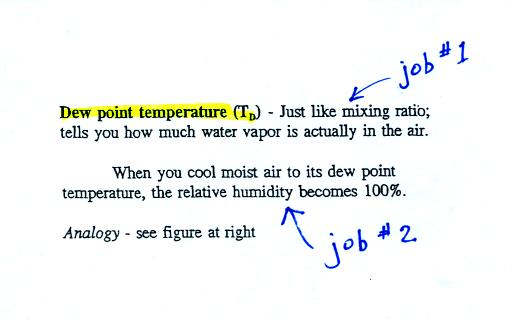 |
The dew point temperature has
two jobs. First it gives you an idea of the actual amount
of water vapor in the air. In this respect it is
just like the mixing ratio. If the dew point temperature
is low the air doesn't contain much water vapor. If it is
high the air contains more water vapor. This is something
we learned early in the semester.
The dew point is a temperature and has units of
oF or oC
Second the dew point tells you how much you
must cool the air in order to raise the RH to 100% (at which
point a cloud, or dew or frost, or fog would form). This
idea of cooling the air until the RH increases to 100% is
important and is something we will use a lot.
If we cool the 70 F air or the 40 F air
to 30 F we would find that the saturation mixing ratio would
decrease to 3 grams/kilogram. Since the air actually
contains 3 g/kg, the RH of the 30 F air would become 100%.
The 30 F air would be saturated, it would be filled to capacity
with water vapor. 30 F is the dew point temperature for 70
F air that contains 3 grams of water vapor per kilogram of dry
air. It is also the dew point temperature for 40 F air
that contains 3 grams of water vapor per kilogram of dry air.
Because both volumes of air had the same amount of water
vapor, they both also have
the same dew point temperature.
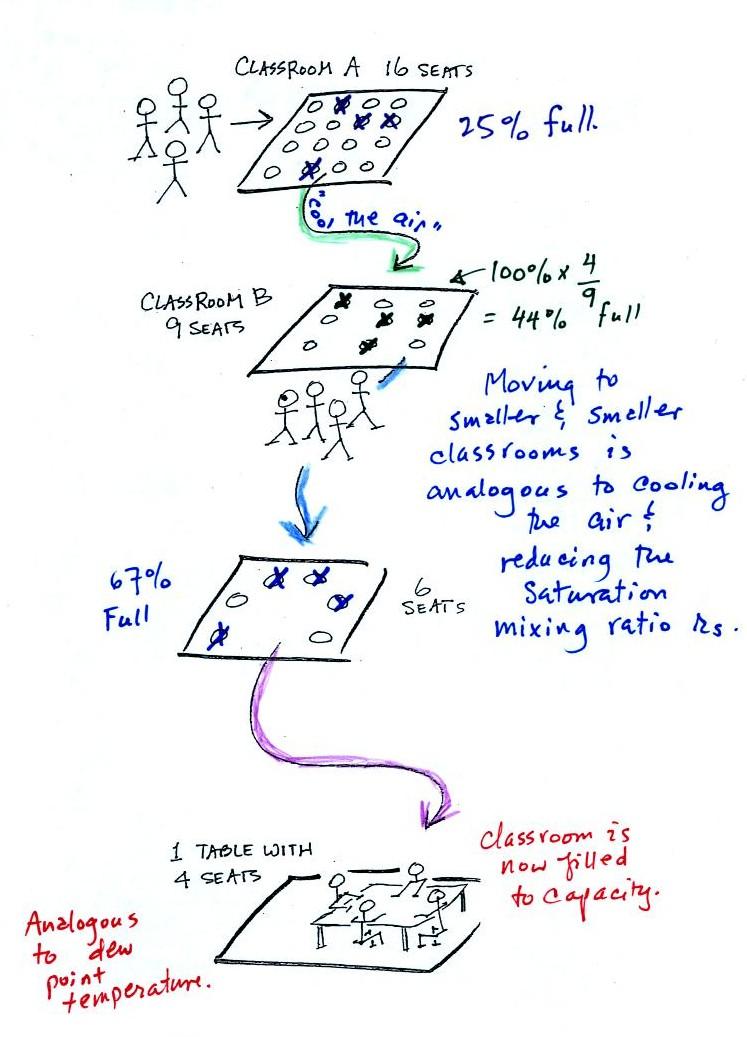
Now back to the
student/classroom analogy.
The 4 students move into classrooms of
smaller and smaller capacity. The decreasing capacity of
the classrooms is analogous to the decrease in saturation
mixing ratio that occurs when you cool air. Eventually the
students move into a classroom that they just fill to capacity.
This is analogous to cooling the air to the dew point.
We're going to work 4 example problems.
I was going to do the first of them today but we were running
short on time. So we finished up with a quick look at an
example grade like the one you should have received in class
today.
Grade summary example
Doe_J
quiz1 -48.0 (190.0 pts
possible) 74.7%
quiz2 -42.0 (150.0 pts
possible) 72.0%
1.1 EC points (1.8 pts
possible)
writing scores: 32.0
(expt/book report) + 14.0 (1S1P pts)
writing percentage grade estimate: 83.6%
average (no quiz scores dropped): 75.4 + 1.1 = 76.6%
average (lowest quiz score dropped): 77.0% + 1.1 = 78.1
The first two items (green)
are your scores on the quizzes.
This is followed by the number of extra credit (EC) points
(purple) you've earned
so far. If you've done all the Optional Assignments
(and selected the extra credit points option on the two
recent surface weather map analysis and upper level charts
assignments) you could have earned up to 1.8 pts so
far. There will be at least 3 pts possible by the
end of the semester. You can also see whether they
enter into your overall grade.
Your writing score (red)
is next. This is made up of your experiment report
grade (up to 40 pts) and the number of 1S1P pts you've
earned so far (this should be 45 pts by the end of the
semester). Many of you haven't done an experiment or
have turned in a report that hasn't yet been graded.
In these cases your grade summary shows a 0 but the
computation of your writing percentage grade assumes an
average score. This is just to show you how the
writing grade can help your overall average.
Finally two overall averages are computed:
(i) the first doesn't drop any quiz scores. This is
the score that must be 90.0 or above at the end of the
semester in order to be exempt from the Final Exam.
(ii) the lowest quiz score when computing the 2nd average.
These grade estimates attempt to predict the grade you
will end up with at the end of the semester if you keep on
doing as you have done so far. A student that ends
up with a 78.1% average on the last day of classes will
have to take the Final Exam. The student would need
to score 38% on the Final to keep the C grade that they
currently have. They would need to score 83% on the
Final Exam to raise their overall average to a B.
If you're happy with your overall average, you need to
keep up the quality of work you have done so far.
If your score is lower than you'd like there is still
plenty of time for improvement. Improved scores on
the remaining two quizzes can change
your overall average dramatically. Also be sure to
turn in an experiment report and earn 45 1S1P pts (the
max. no. allowed). The writing
percentage grade has the same weight as a quiz and there
is no reason it shouldn't be near or even above 100%.
Finally be sure to check that all of the information on
your grade summary is correct.