Thursday April 23, 2015
Selections from The Buena Vista Social Club before
class this morning: "Candela
(Live in Amsterdam)", "Chan Chan
(Live at Carnegie Hall)", "La Negra
Tomasa", "Mandinga
(Live at Carnegie Hall", and "Hasta
Siempre Commandante" (3:13)
The Experiment #3 revised reports were collected today.
The last assignment of the semester has been posted. You
choose choose between earning 1S1P points or Extra Credit
points.
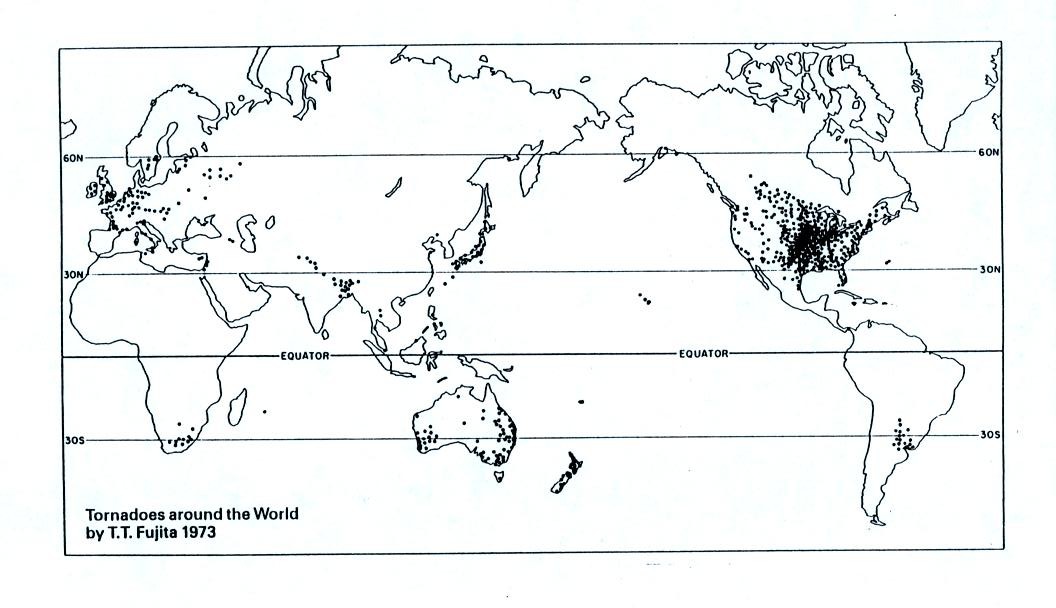
Tornadoes
The
United States has roughly 1000
tornadoes in an average
year. The US
has more tornadoes than any
other country in the world.
A
year's worth of tornado activity plotted
on a world map. Note the name at
bottom left: T.T. Fujita, "Mr.
Tornado." The scale used to rate
tornado strength and intensity is named
after him.
This is
mostly just a consequence of
geography.
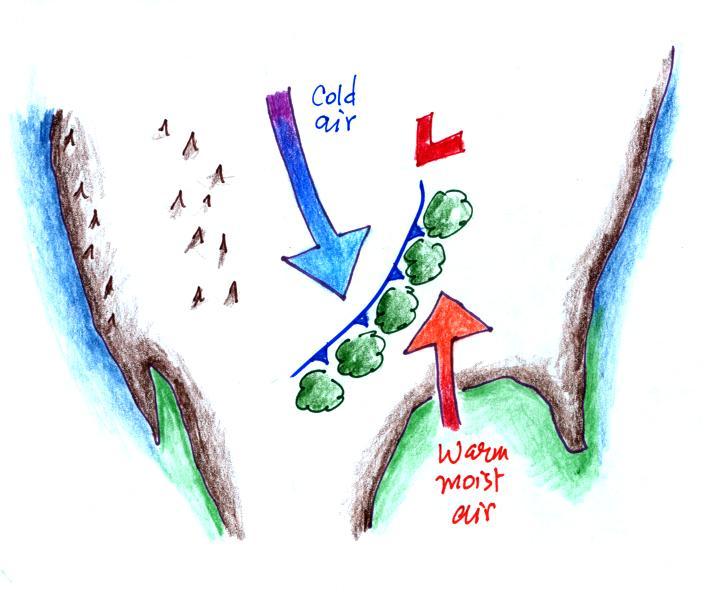
Without any mountains in
the way, cold dry air can move in the spring all the
way from Canada to the Gulf Coast. There it
collides with warm moist air from the Gulf of Mexico
to form strong cold fronts and thunderstorms.
There are some other meteorological conditions that
come into play that make these storms capable of
producing tornadoes.
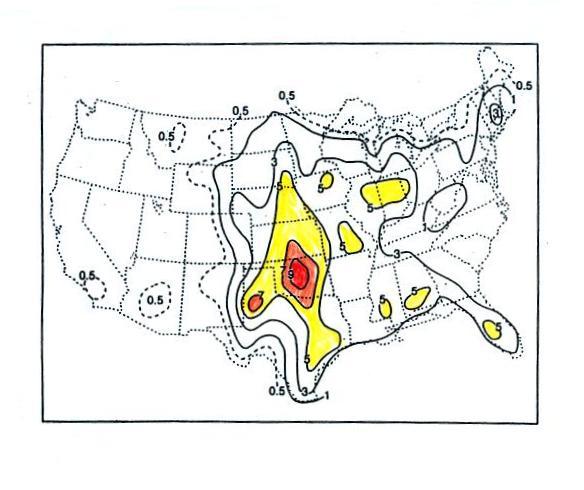
This map (found on p. 161 in the
ClassNotes) shows the average frequency of tornado
occurrence in the US. Tornadoes have been
observed in every state (including Alaska), but tornadoes are most frequent
in the Central Plains, a region referred to as
"Tornado Alley" (highlighted
in red, orange, and yellow above).
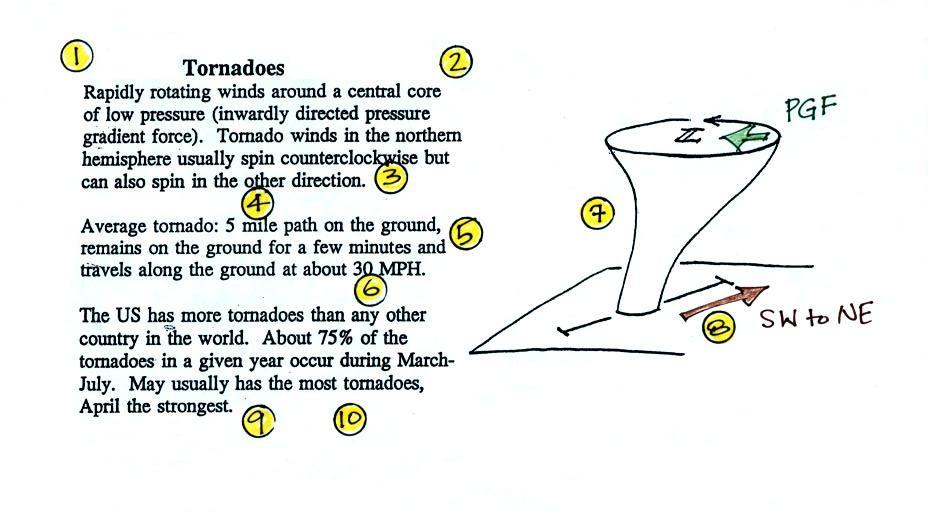
Tornado characteristics
Here are some basic tornado characteristics (the
figure above is also on p. 161)
1. About 2/3rds (maybe 3/4) of tornadoes are
F0 or F1 tornadoes (this is referring to the Fujita Scale,
which we'll learn more about on Tuesday) and have spinning
winds of about 100 MPH or less. Microburst winds can
also reach 100 MPH. Microbursts are much more common in
Tucson in the summer than tornadoes and can inflict the same
level of damage.
2. A very strong inwardly directed pressure
gradient force is needed to keep winds spinning in a circular
path. The pressure in the center core of a tornado can
be 100 mb less than the pressure in the air outside the
tornado. This is a very large pressure difference in
such a short distance. The
PGF
is
much
stronger
than
the
Coriolis
Force
(CF)
and
the
CF
can
be
neglected.
The same pressure drop can be found in strong hurricanes but
it takes place over a much larger distance. The PGF
isn't as strong and the CF does play a role.
3. Because the Coriolis force doesn't play a
role, tornadoes can spin clockwise or counterclockwise, though
counterclockwise rotation is more common. This might be
because larger scale motions in the cloud (where the CF is
important, might determine the direction of spin in a
tornado).
4, 5, 6. Tornadoes usually last only a few
minutes, leave a path on the ground that is a few
miles long, and move at a few 10s of MPH.
There are exceptions, we'll look at one shortly.
7, 8. Most tornadoes move from the SW toward
the NE. This is because tornado-producing thunderstorms
are often found just ahead of a cold front where winds often
blow from the SW. Most
tornadoes
have
diameters
of
10s
to
a
few
100s of yards but tornadoes with diameters over a mile have
been observed. Tornado diameter can also be much larger
near the base of the thunderstorm than it is near the ground.
9, 10. Tornadoes
are
most
frequent
in
the
Spring.
The
strongest
tornadoes
also
occur
at
that
time
of
year.
You
don't need to remember the specific months. Tornadoes
are most common in the late afternoon when the atmosphere is
most unstable.
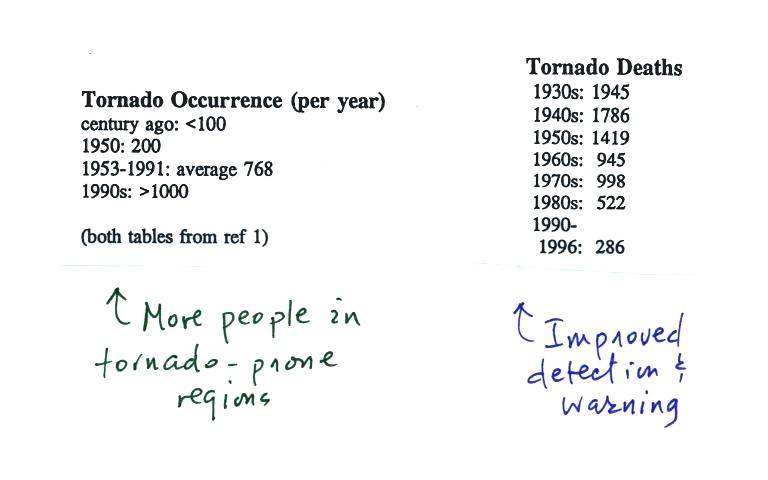
At the present time about 75 people are killed every year
in the United States by tornadoes. This is about a factor of
ten less than a century ago due to improved methods of detecting
tornadoes and severe thunderstorms. Modern day
communications also make easier to warm people of dangerous
weather situations. Lightning and flash floods (floods are
the most serious severe weather hazard) kill slightly more people
than tornadoes. Hurricanes kill fewer people on average than
tornadoes.
The increase in the number of tornadoes observed per year is
probably more due to there being more people in locations that are
able to observe and report a tornado rather than a true increase
in tornado activity.
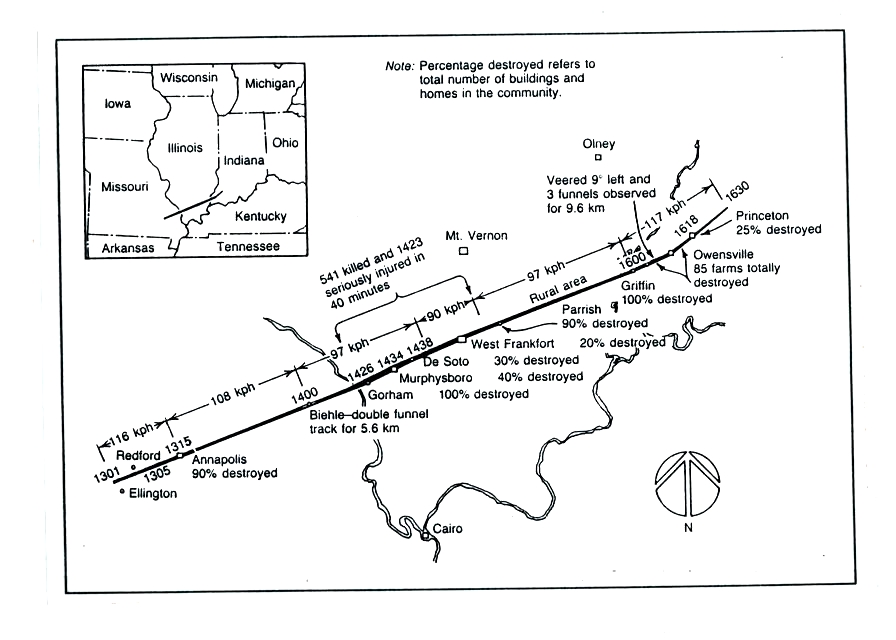
1925 Tri State Tornado
This figure traces out the path of the
1925 "Tri-State
Tornado" . The tornado path (note the SW to NE
orientation) was 219 miles long, the
tornado lasted about 3.5 hours and killed 695
people. The tornado was traveling over 60
MPH over much of its path. It is still today the
deadliest single tornado ever in the United States
(you'll find a compilation of tornado records here).
The Joplin
Missouri tornado (May 22, 2011) killed 162 people making
it the deadliest since 1947 and the 7th deadliest tornado in
US history.
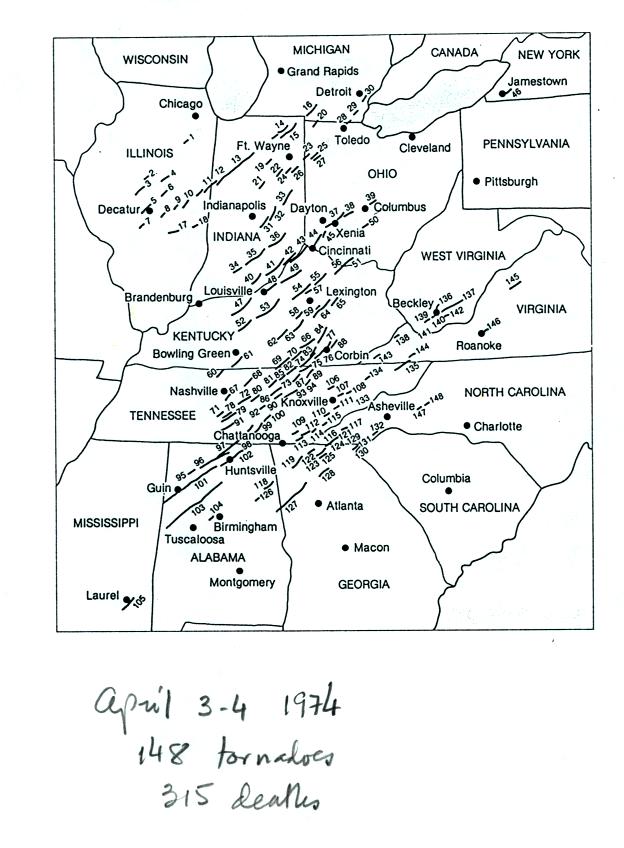
Tornado
outbreaks
Tornadoes often
occur in "outbreaks." The paths of 148 tornadoes
during the April 3-4, 1974 "Jumbo
Tornado Outbreak" are shown above. Note
the first tornadoes were located in the upper left
corner of the map and all
of the tornado paths are oriented from SW to NE.
The April
25-28, 2011 outbreak is now apparently the largest
tornado outbreak in US history (358 tornadoes, 346 people
killed)
As we learn more about tornadoes I'm
hoping you'll look at video with a more critical eye than
you would have otherwise. So we took a moment, at
this point, to have a look at some tornadoes caught
on video. If you click on the links below you'll see
the same or a similar video that I found online. The
videos shown in class were from a tape called "Tornado
Video Classics".
The numbers in the left column identified the tornado on
the tape. The next column shows the Fujita Scale
rating (the scale runs from F0 (weakest) to F5
(strongest). The locations and date are shown
next. The last column has comments and things to
look for when watching the video segment.
Video
ID
|
Fujita
Scale
rating
|
Location
|
Date
|
Comments
|
54a
|
F3
|
Grand Isle NE
|
Mar. 13, 1990
|
tornado cloud is pretty
thick and vertical |
61f
|
F3
|
McConnell
AFB
KS
|
Apr. 26, 1991
|
this is about as close
to a tornado as you're ever likely to get. Try to
judge the diameter of the tornado cloud. What
direction are the tornado winds spinning?
|
52
|
F5
|
Hesston
KS
|
Mar. 13, 1990
|
Watch closely, you may
see a tree or two uprooted by the tornado winds
|
51
|
F3
|
North
Platte
NE
|
Jun. 25, 1989
|
Trees uprooted and
buildings lifted by the tornado winds. The online
video is longer than the one shown in class and has some
good closeup video. See especially the last couple
of minutes of the video
|
65
|
F1
|
Brainard
MN
|
Jul. 5, 1991
|
It's a good thing this
was only an F1 tornado
|
57
|
F2
|
Darlington
IN
|
Jun. 1, 1990
|
Tornado cloud without
much dust
|
62b
|
F2
|
Kansas
Turnpike
|
Apr. 26, 1991
|
It's sometimes hard to
run away from a tornado. Watch closely you'll see a
van blown off the road and rolled by the tornado.
The driver of the van was killed!
|
47
|
F2
|
Minneapolis
MN
|
Jul. 18, 1986
|
Tornado cloud appears
and disappears. The online video compares features
seen in this tornado with one created in a laboratory.
|
The online Kansas
turnpike video also has a warning that a highway underpass
is actually a very dangerous place to take shelter from a
tornado. Here is some
additional information from the Norman OK office of the
National Weather Service. Slide 6 lists some of the reasons
why underpasses are so dangerous.
Supercell thunderstorms
In the next video you'll see
1. Some additional footage of the Andover KS tornado (the
one that tore through the parking lot and the one that caught up
the people driving on an interstate highway and forced them to
seek shelter under a bridge).
2. Pictures of new and distant supercell
thunderstorms and wall clouds.
3. A computer simulation of the growth and
development of a supercell thunderstorm.
But first we need to learn a little bit about supercell
thunderstorms.
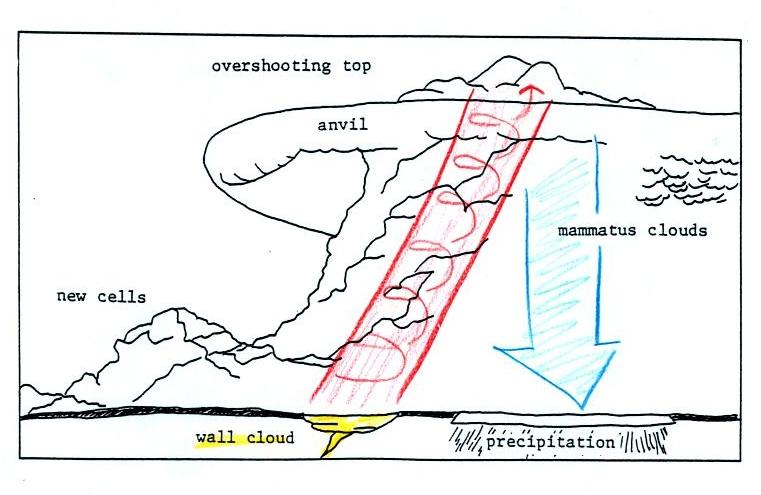
Here is a relatively simple
drawing showing some of the key features on a supercell thunderstorm (found
on p. 163 in the ClassNotes). In a supercell the rotating updraft
(shown in red above) is strong enough to penetrate a
little way into the stratosphere. This produces
the overshooting top or dome feature above. A
wall cloud and a tornado are shown at the bottom of
the mesocyclone. In
an ordinary thunderstorm the updraft is unable to
penetrate into the very stable air in the stratosphere
and the upward moving air just flattens out and forms
an anvil. The flanking line is a line of new
cells trying to form alongside the supercell thunderstorm
(similar to convergence between prexisting winds and
thunderstorm downdraft winds that can lead to new
storm development alongside a dissipating air mass
thunderstorm).
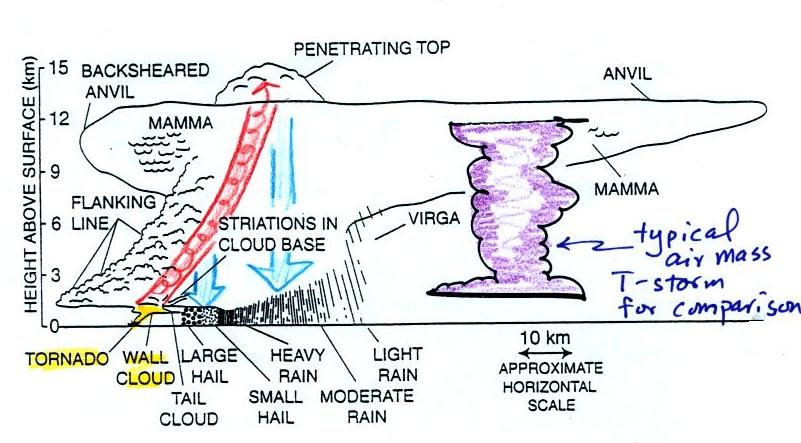
Here is a second slightly more complicated and
realistic drawing of a supercell
thunderstorm. A typical air mass thunderstorm
(purple) has been drawn in so that you can appreciated how
much larger supercell thunderstorms can be.
The video segment was shown at this point. It
showed a distant supercell thunderstorm and photographs of
the bases of nearby supercell thunderstorms. Here you
could see the spectacular wall cloud that often forms at the
base of these storms. Finally a computer simulation
showed some of the complex motions that form inside
supercell thunderstorms, particularly the tilted rotating
updraft.
I haven't been able to find the video that I showed in class
online. But the intent of the video was
just to illustrate the complex air motions inside supercell
thunderstorms. Here's an alternate
video that also shows development of a tornado. This
video wasn't shown in class.
Weather radar and "hook
echoes"
Thunderstorms with rotating updrafts and supercell thunderstorms
often have a distinctive radar signature called a hook echo.
This is one of the ways that scientists are now able to
better detect and warn of tornadic thunderstorms
We haven't discussed
weather radar in this class. In some ways a radar image of
a thunderstorm is like an X-ray photograph of a human body.
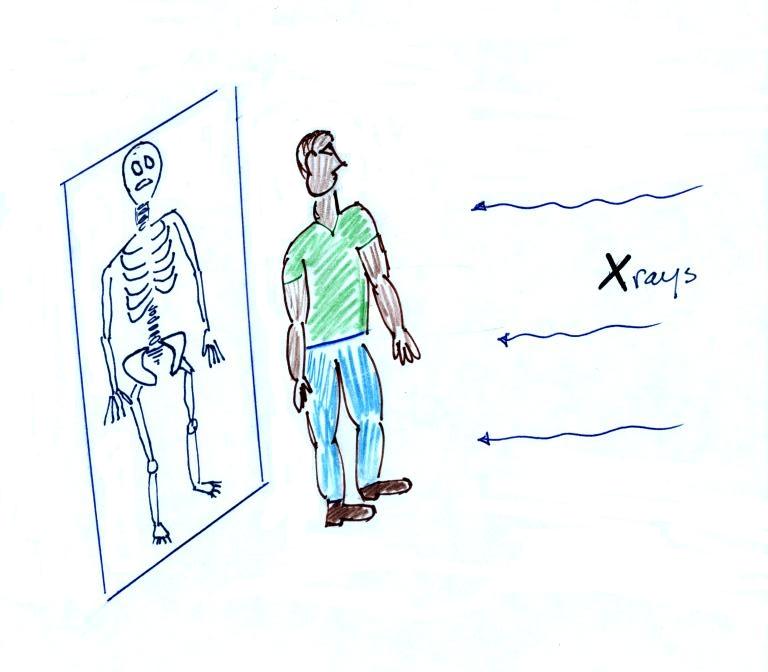
An X-ray image of a person doesn't usually
show the entire body, often just the bones and skeleton
inside.
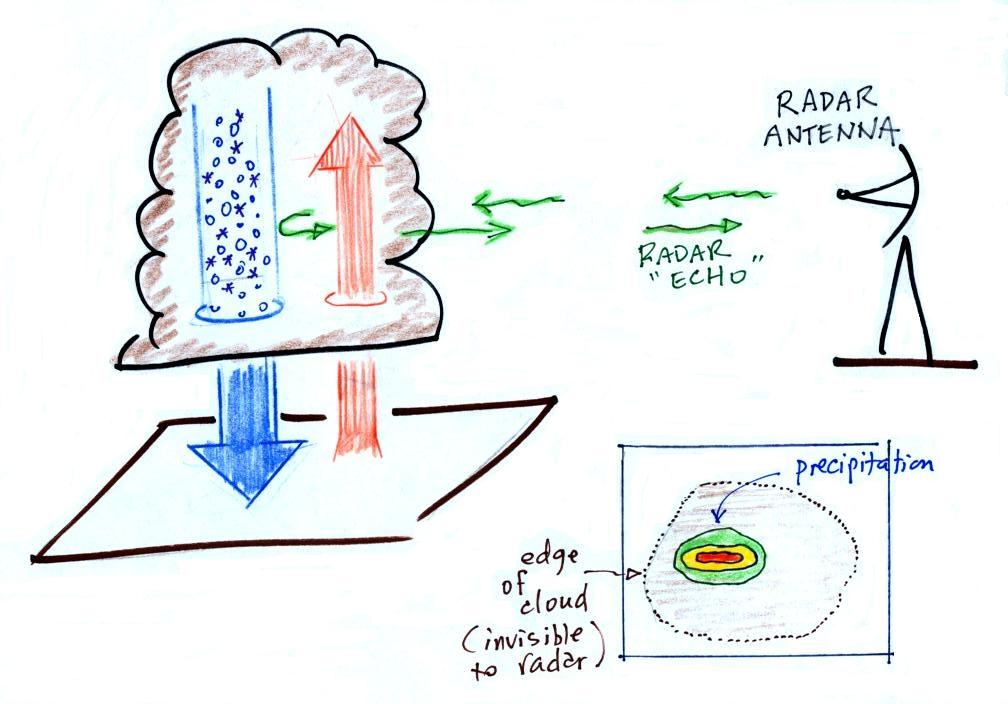
The
radio signals emitted by radar pass through the cloud itself
but are reflected by the much larger precipitation
particles. The radar keeps track of how long it takes for the
emitted signal to travel out to the cloud, be reflected, and
return to the radar antenna. The radar can use this to
determine the distance to the storm. It also knows the
direction to the storm and can locate the storm on a
map. The intensity of the reflected signal (the echo) is
often color coded. Red means an intense reflected signal
and lots of large precipitation particles. The edge of
the cloud isn't normally seen on the radar signal.
A Doppler radar (something we didn't
discuss in class) can detects small shifts in the
frequency of the reflected radar signal caused by precipitation
moving toward or away from the radar antenna. This can be
used to determine wind speeds inside the tornado.
Below is an actual radar image with a prominent hook
echo. The hook is evidence of large scale rotation inside
a thunderstorm and means the thunderstorm is capable of, and may
already be, producing tornadoes.
This is the radar image of a
thunderstorm that produced a very strong tornado that hit Oklahoma City in May 1999
. The hook echo is visible near the lower left
hand corner of the picture. Winds in the tornado
may have exceeded 300 MPH. You can read more about this
tornado here.
And here is some storm chase
video of the tornado.
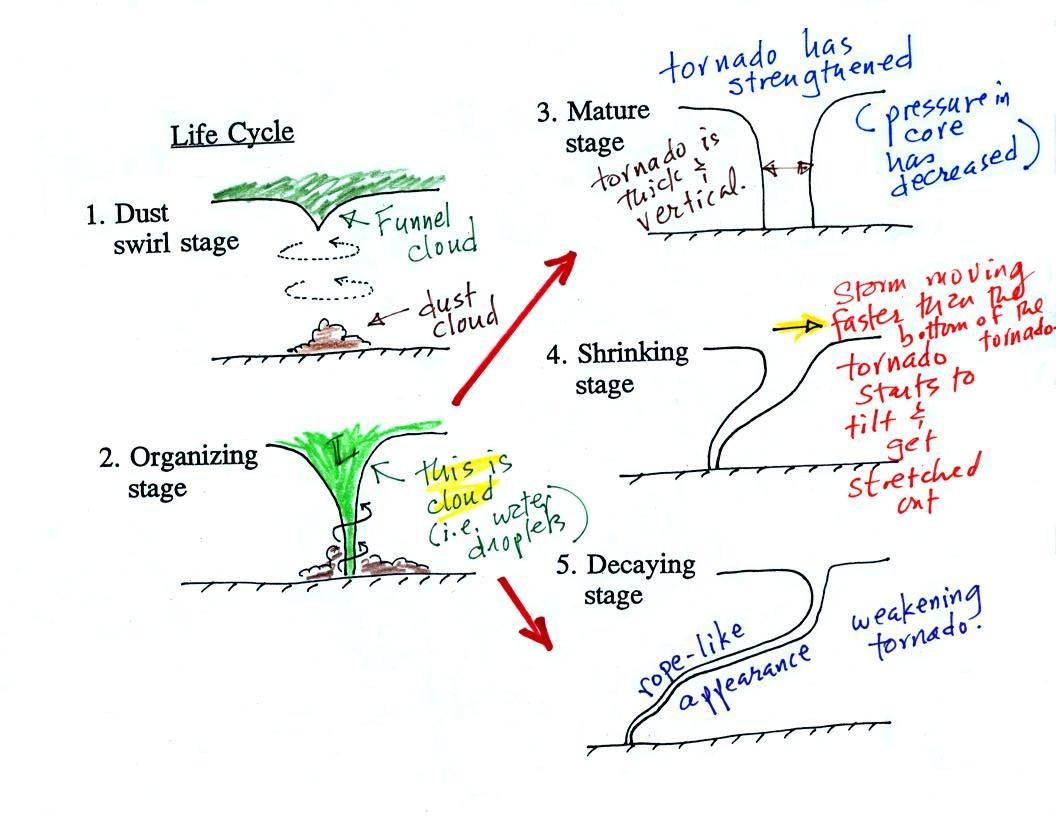
Tornado life cycle
The figure below (p. 162 in the ClassNotes) illustrates the life
cycle of a tornado. Hopefully the next time you see a
tornado either in person or on video you'll be able to say whether
it is early or late in its life cycle and whether it appears to be
a stronger or weaker than average tornado.
Tornadoes begin in and descend from a thunderstorm. You
would usually see a funnel cloud dropping from the base of the
thunderstorm. Spinning winds will probably be present
between the cloud and ground before the tornado cloud becomes
visible. The spinning winds can stir up dust at ground
level. The spinning winds might also be strong enough at
this point to produce some minor damage.
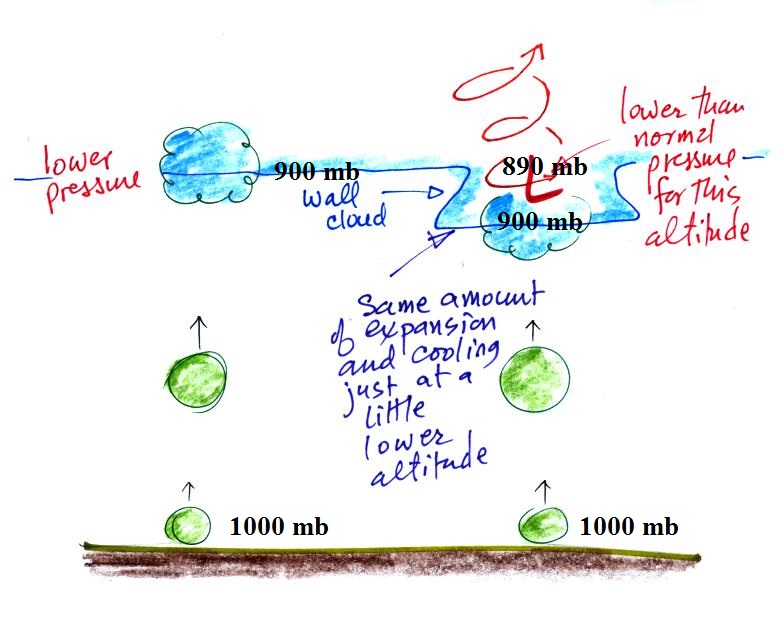
In Stage 2, moist air moves horizontally toward the low
pressure in the core of the tornado. This sideways moving
air will expand and cool just as rising air does (see figure
below). Once the air cools enough (to the dew point
temperature) a cloud will form.
Tornadoes can go from Stage 2 to Stage 3 (this is what the
strongest tornadoes do) or directly from stage 2 to stage 4 or
5. Note a strong tornado is usually vertical and thick as
shown in Stage 3. "Wedge tornadoes"
actually appear wider than they are tall.
Here is video of the Laverne
Oklahoma tornado that was shown in class and that shows
the initial dust swirl stage up to the mature stage very
well.
The thunderstorm and the top of the tornado will move faster
than the surface winds and the bottom of the tornado. This
will tilt and stretch the tornado. The rope like
appearance in Stage 5 is usually a sign of a weakening (though
still a dangerous) tornado.
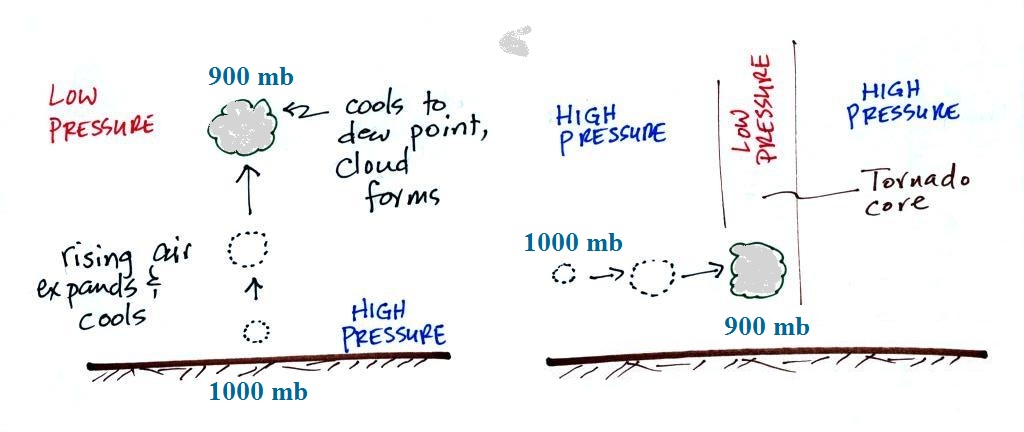
A tornado cloud forms is mostly the
same way that ordinary clouds do. In
an ordinary cloud (left figure above) rising air moves
into lower pressure surroundings and expands. Expansion
cools the air. If the air expands and cools enough (to the
dew point) a cloud forms. In a tornado air moves horizontally
into lower pressure at the core of the tornado. The air
expands and cools just like rising air does. If the air
cools enough a cloud appears.
The same kind of idea explains why the wall cloud extends a
little bit lower than the rest of a thunderstorm cloud.
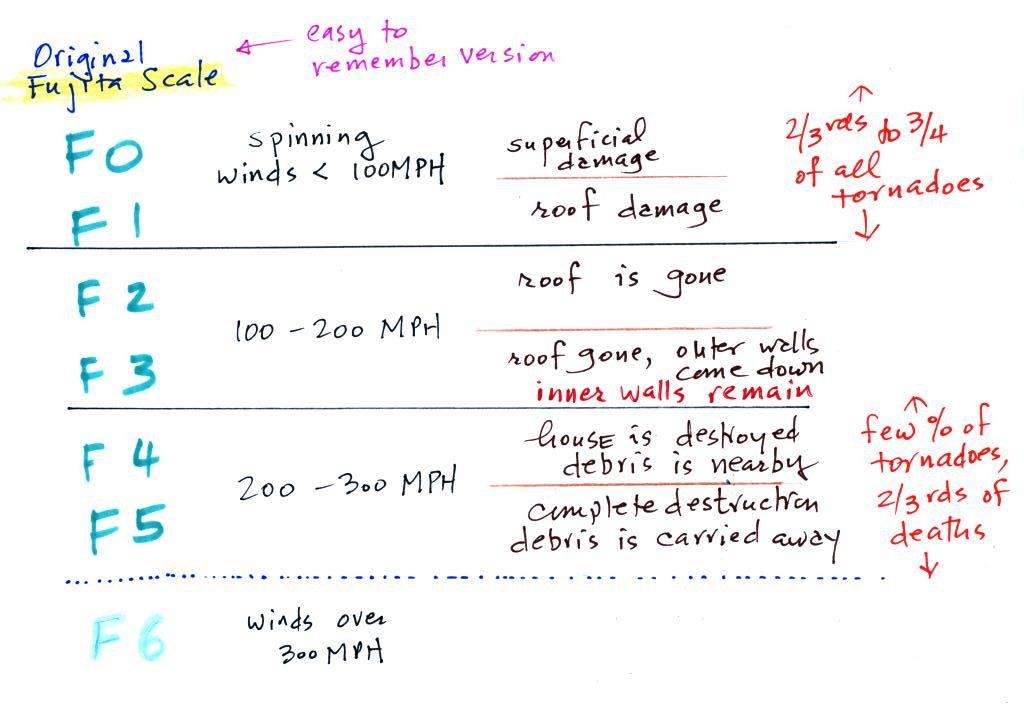
Tornado intensity
and the Fujita Scale
It is very hard to actually measure the speed of the
rotating winds in a tornado. Researchers usually
survey the damage caused by the tornado and assign a Fujita
Scale rating. The original scale,
introduced in 1971 by Tetsuya (Ted) Fujita. A
simplified, easy to remember version is shown
below. A very basic and grossly oversimplified
idea of the damage that each level can produce is
included. This is simple enough that I can
remember it and can use it to estimate tornado
intensity when I see damage on the television news.
The fact that the interior walls in a
home as the last to go in a tornado means this is probably
the best location to seek shelter from a tornado if a
better location (such as an underground storm cellar) is
not available.
This is as far as we got in
class today. I'll probably
move the following information to the Tuesday Apr.
28 notes page.