![]()
![]()
![]()
![]()
In the broad belt around the earth known as the tropics -- the region within 23½° latitude north and south of the equator -- the weather is much different from the middle latitudes. The noon sun is always high in the sky and seasonal changes in temperature are small compared with the more drastic seasonal changes at higher latitudes. The daily heating of the surface and high humidity favor the development of cumulus clouds and thunderstorms. Frequent showers and non-violent thunderstorms often accompanied with heavy rainfall are typical for tropical regions. Intense and well organized storm systems are relatively rare.
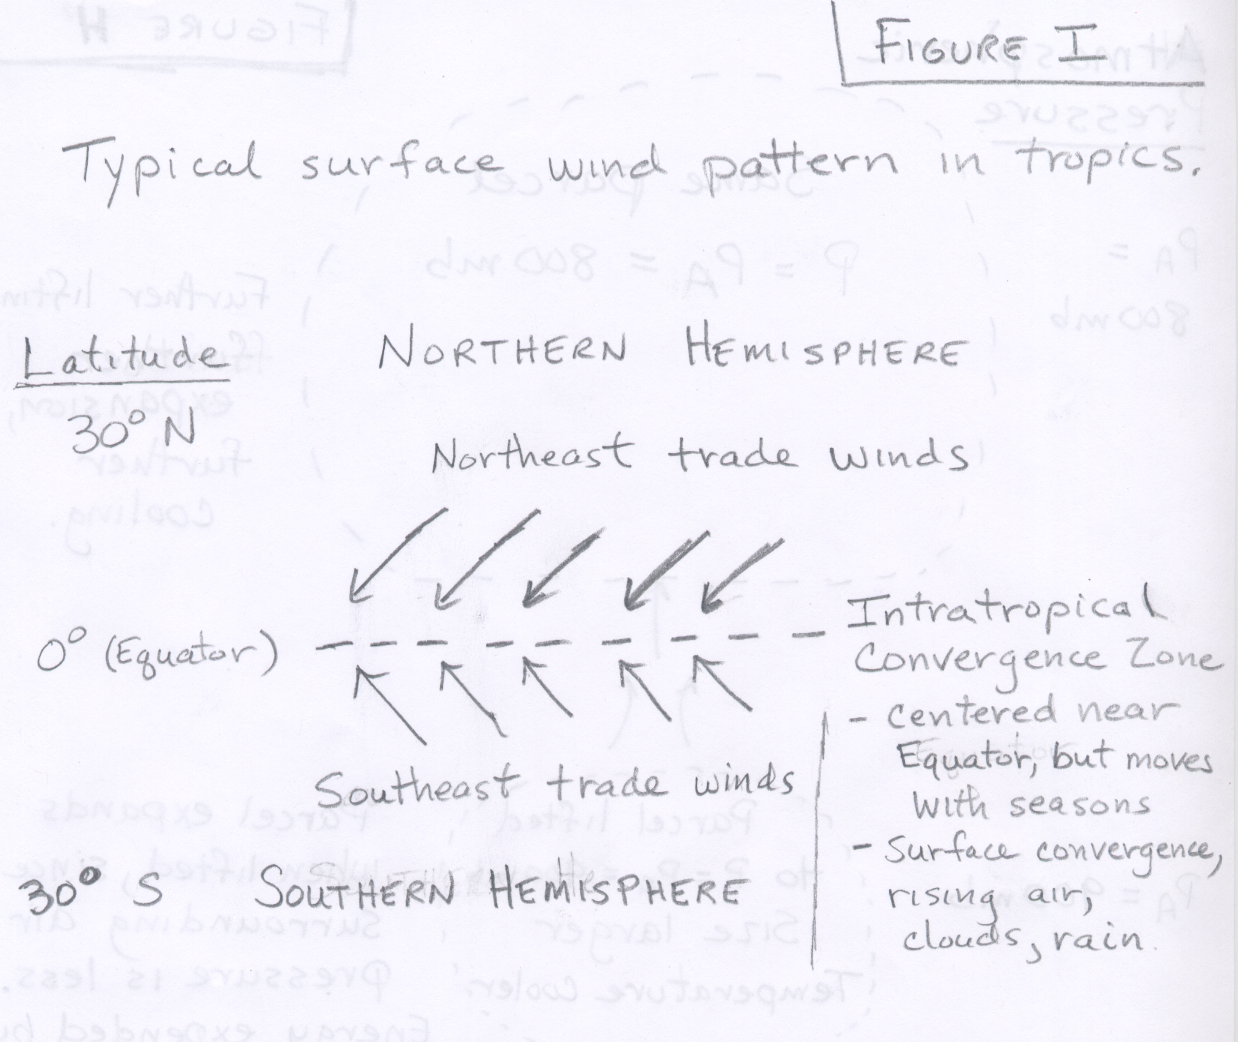
Surface winds in the tropics generally blow from the east -- northeast (in the northern hemisphere), or southeast (in the southern hemisphere) -- these reliable and steady winds are called the trade winds. Between these two winds flows is an area of convergence known as the intratropical convergence zone (See Figure I). This band of surface convergence, forced rising air, and clouds is easily seen on satellite imagery and is a prominent part of the climate of Earth. Let's take some time to try to look over a few satellite composite images and movies of the Earth to identify some of the major features of weather patterns around the globe. You may wish to open this link to satellite composite imagery in another browser window or tab so that you can read the instructions that follow. A composite image of the globe is done by stitching together (or compositing) simultaneous views from several satellites, since any one of them can only view a small portion of the Earth. There are many interesting images and movies available. For this discussion, take a look at either the "Global Montage" two week movie or the "Infrared Global Composite Quicktime Movie." After loading the movie, you can pause it and use the slider at the bottom of the image to move more slowly through the frames. The time each image was taken in GMT is given below the image. Notice the semi-continuous band of clouds that extends across the globe near the Equator. This is the Intratropical Convergence Zone. Also notice that cloud systems at low latitudes (close to the Equator) generally move from east toward west. There may even be some active tropical storms in the two week loop depending on when you look. Now look at the motion of cloud systems at higher latitudes in both the northern and southern hemisphere. These cloud systems generally move from west to east and commonly rotate or swirl. At higher latitudes the steering level winds (around 500 mb) are generally west toward east, while in the tropics these winds are generally east toward west.
Occasionally, a large undulation or ripple in the normal trade wind pattern will develop and move slowly from east toward west. These disturbances in the flow are called tropical waves, or easterly waves. Because variaions of surface air pressure in the tropics are so slight compared with the middle latitudes, tropical waves are best shown by plotting steamlines of the wind patterns (rather than isobars) as shown in this example. The example also indicates where areas of surface convergence (which forces rising motion resulting in the development of clouds and rain) and surface divergence (which forces sinking motion resulting in mainly clear skies) occur relative to the position of the easterly wave. The typical westward movement of a tropical easterly wave is shown in this animation. Although the majority of tropical waves die out before becoming major systems, if conditons are favorable, tropical waves can intensify, develop a central low pressure region around which the winds rotate, and grow into hurricanes. In fact, most severe hurricanes that affect the United States begin as easterly waves, which move of the continent of Africa. More information and a diagram can be found in this African Easterly Wave Link. Usually these easterly waves are relatively weak until they move into the warmer waters in the western Atlantic, Caribbean, and Gulf of Mexico.
Although most of the severe hurricanes that affect the United States begin as easterly waves that move off Africa and across the Atlantic, there have been many cases where hurricanes initially formed much closer to the United States -- in the Carribean and Gulf of Mexico. In those cases it often appears that a region of surface convergence or upper-level divergence with an associated area of disorganized thunderstorms eventually develops rotation and strengthens.
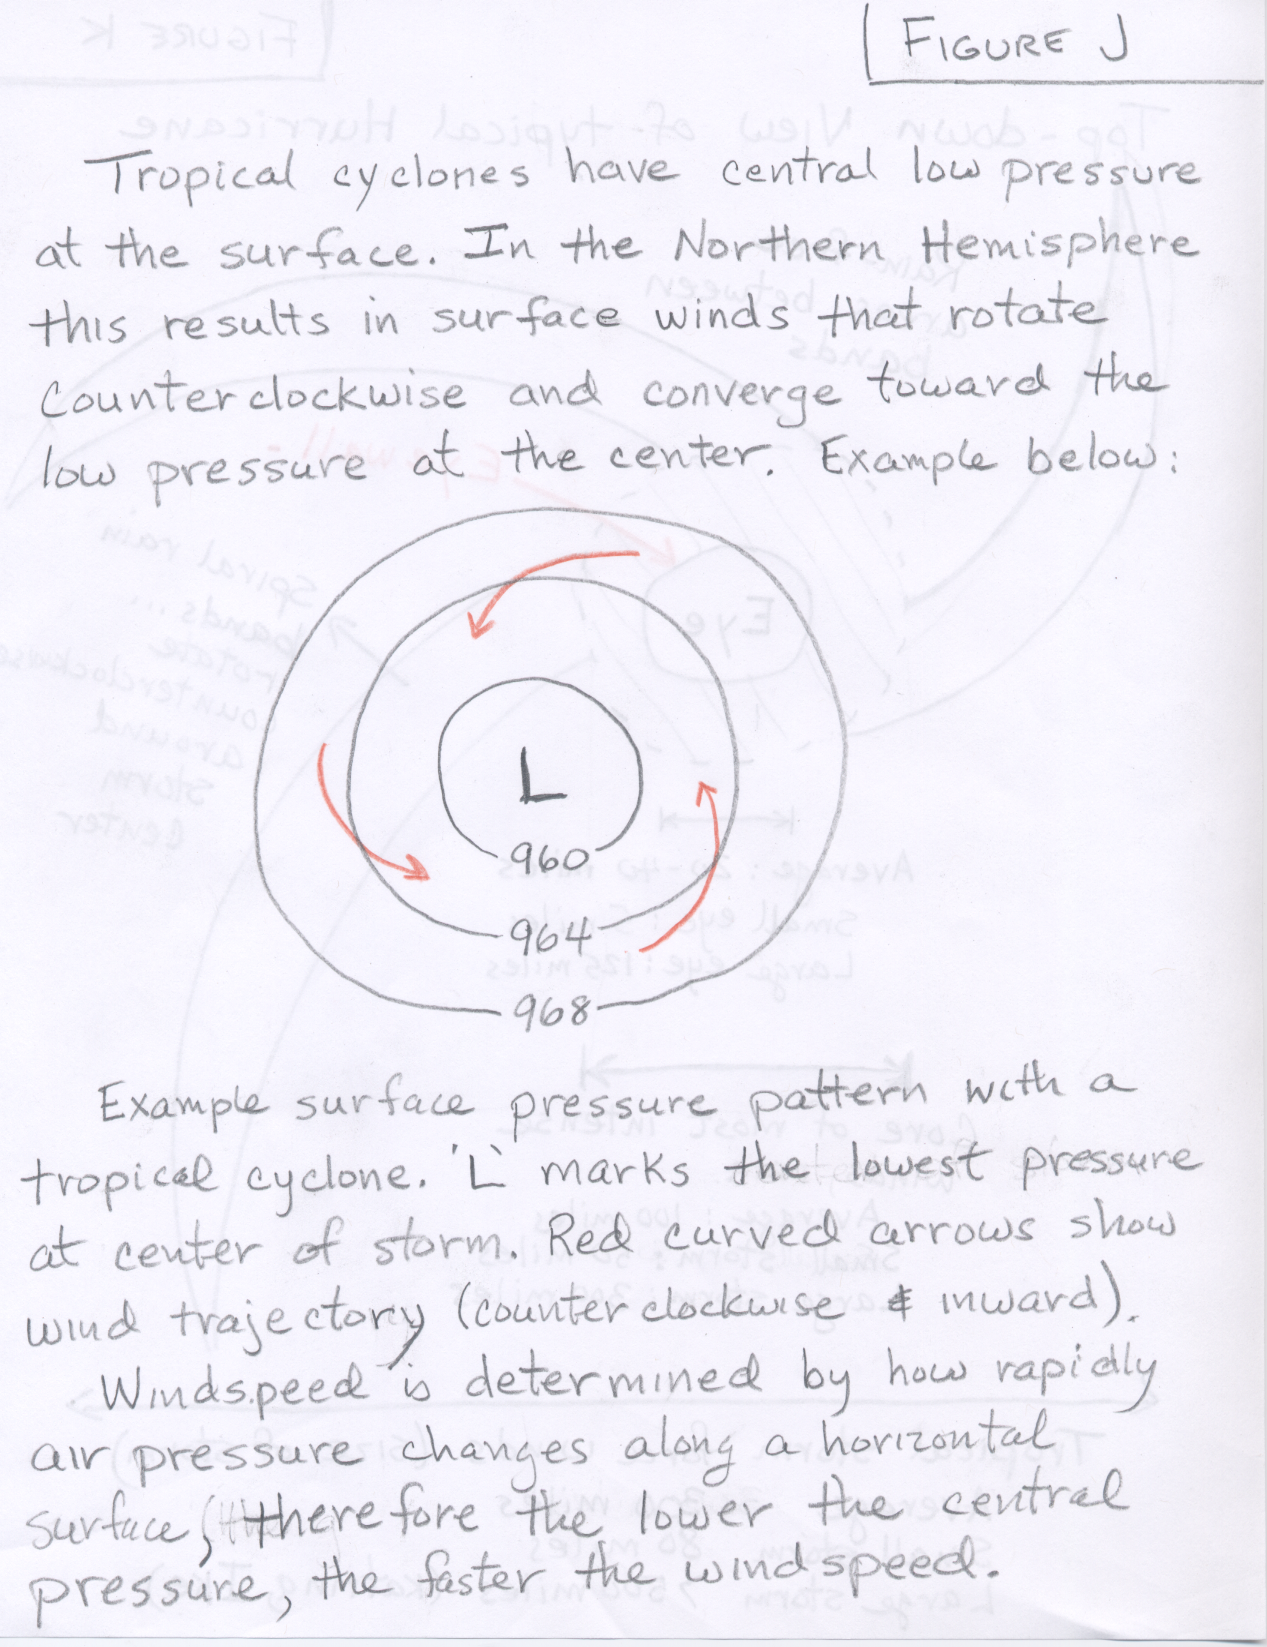
Tropical cyclone is the generic name given to a surface low pressure system over tropical waters, with organized convection (i.e., thunderstorm activity) and a definite cyclonic (or counter-clockwise) surface wind pattern (See Figure J). Recall from Module 1 material that the ground surface winds around a circular area of lower pressure (in the Northern Hemisphere) are mostly counterclockwise, but also inward. The speed of the winds depend on how rapidly air pressure increases in moving out from the low pressure center. As described in Figure J, the speed of the wind and strength of the storm depends on how low the central pressure gets. Remember that the average sea level pressure is about 1000 mb (1013.25 mb to be exact), and somewhere outside the storm, the pressure will have to return to average, thus the lower the central pressure of the storm, the stronger the pressure gradient, the stronger the winds and the stronger the storm. As a tropical cyclone intensifies, it is classified according to wind speed.
(*)Hurricane is the term used in the north Atlantic Ocean and the north and south Pacific oceans east of the dateline. These storms are given different names in other ocean basins:
Tropical storms and hurricanes are the only natural disasters which have their own names (e.g., Andrew, Camille, Hugo, the 2004 Florida hurricanes, Charles, Frances, Ivan, and Jeanne, the damaging 2005 hurricanes, Dennis, Katrina, Rita, and Wilma, in 2008 Gustov and Ike, and Sandy in 2012). Names seem appropriate because we commonly come to know hurricanes long before they strike land, often watching these storms move across the oceans for days or even weeks. By contrast isolated severe thunderstorms and tornadoes develop suddenly and last only hours. Hurricanes are much larger than an individual severe thunderstorm cell and are more correctly described as being composed of an organized clustering of thunderstorms. They are quite powerful and release great amounts of energy (mostly in the form of latent heat during condensation). In fact the energy released by a single, strong hurricane can be greater than the total annual energy consumption of the United States and Canada combined.
Surface atmospheric pressure in the center of a hurricane tends to be extremely low. The lowest pressure reading ever recorded for a hurricane (typhoon Tip, 1979) is 870 millibars (mb). However, most storms have an average pressure of 950 millibars. Wind speed in a hurricane is highly related to the surface pressure of the storm, since the windspeed is determined by the pressure gradient or the change in air pressure divided by the distance over which the pressure change happens. The average sea level air pressure on Earth is 1013.25 mb. The the pressure gradient (and hence windspeed) depends on the difference in pressure between the lowest pressure in the center of the storm and the pressure outside the storm (average 1013 mb) divided by the distance over which the pressure change happens. In general, the lower the central pressure, the higher the windspeeds generated. In fact hurricanes are classified by either windspeed or the central pressure (with lower pressure being more intense). See this link to Saffir-Simpson Hurricane Classification Table to see the criteria for Category 1 through Category 5 Hurricanes, which can be defined by either central pressure or windspeed. The graph below shows the relationship between surface pressure and sustained wind speed for a number of tropical low pressure systems. This is a rather old figure and does not contain data from hurricanes after 1990.
 |
| Relationship between surface pressure and wind speed for a number of tropical low pressure systems. Tropical low pressure systems are classified as hurricanes when their pressure is 980 millibars or lower, and sustained wind speeds are greater than 74 miles per hour. Hurricanes are further divided into categories 1-5 based on their central pressure and windspeed. |
For historical perspective, the table below shows that hurricane Katrina was the sixth strongest hurricane ever located in the north Atlantic Ocean and the third strongest to hit the United States at the time of landfall in terms of its central pressure (at least since reliable meterological measurements have been available).
| Top six most intense Atlantic hurricanes since measurements began Hurricane intensity is measured solely by central pressure, i source:NOAA |
|||||||
|---|---|---|---|---|---|---|---|
| North Atlantic | Landfall U.S. | ||||||
| Rank | Hurricane | Year | Pressure | Rank | Hurricane | Year | Pressure |
| 1 | Wilma | 2005 | 882 mbar | 1 | "Labor Day" | 1935 | 892 mbar |
| 2 | Gilbert | 1988 | 888 mbar | 2 | Camille | 1969 | 909 mbar |
| 3 | "Labor Day" | 1935 | 892 mbar | 3 | Katrina | 2005 | 920 mbar |
| 4 | Rita | 2005 | 897 mbar | 4 | Andrew | 1992 | 922 mbar |
| 5 | Allen | 1980 | 899 mbar | 5 | "Indianola" | 1886 | 925 mbar |
| 6 | Katrina | 2005 | 902 mbar | 6 | "Florida Keys" | 1919 | 927 mbar |
| Based on data from: The Weather Channel | Based on data from: National Hurricane Center | ||||||
Please see the following link for more information on historic Atlantic Hurricanes.
A hurricane is an intense storm of tropical origin, with sustained winds exceeding 64 knots (74 mi/hr). Below is a photo of Hurricane Elena. The storm is approximately 500 km (310 mi) in diameter, which is about average for hurricanes. The area of broken clouds in the center is its eye. Elena's eye is almost 40 km (25 mi) wide. Within the eye, winds are light and clouds are mostly broken. The surface pressure is very low, nearly 955 mb.
 |
| Hurricane Elena as photographed from the space shuttle Discovery during September, 1985. |
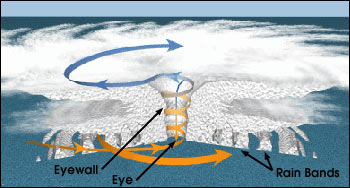 |
| Structure of a Hurricane |
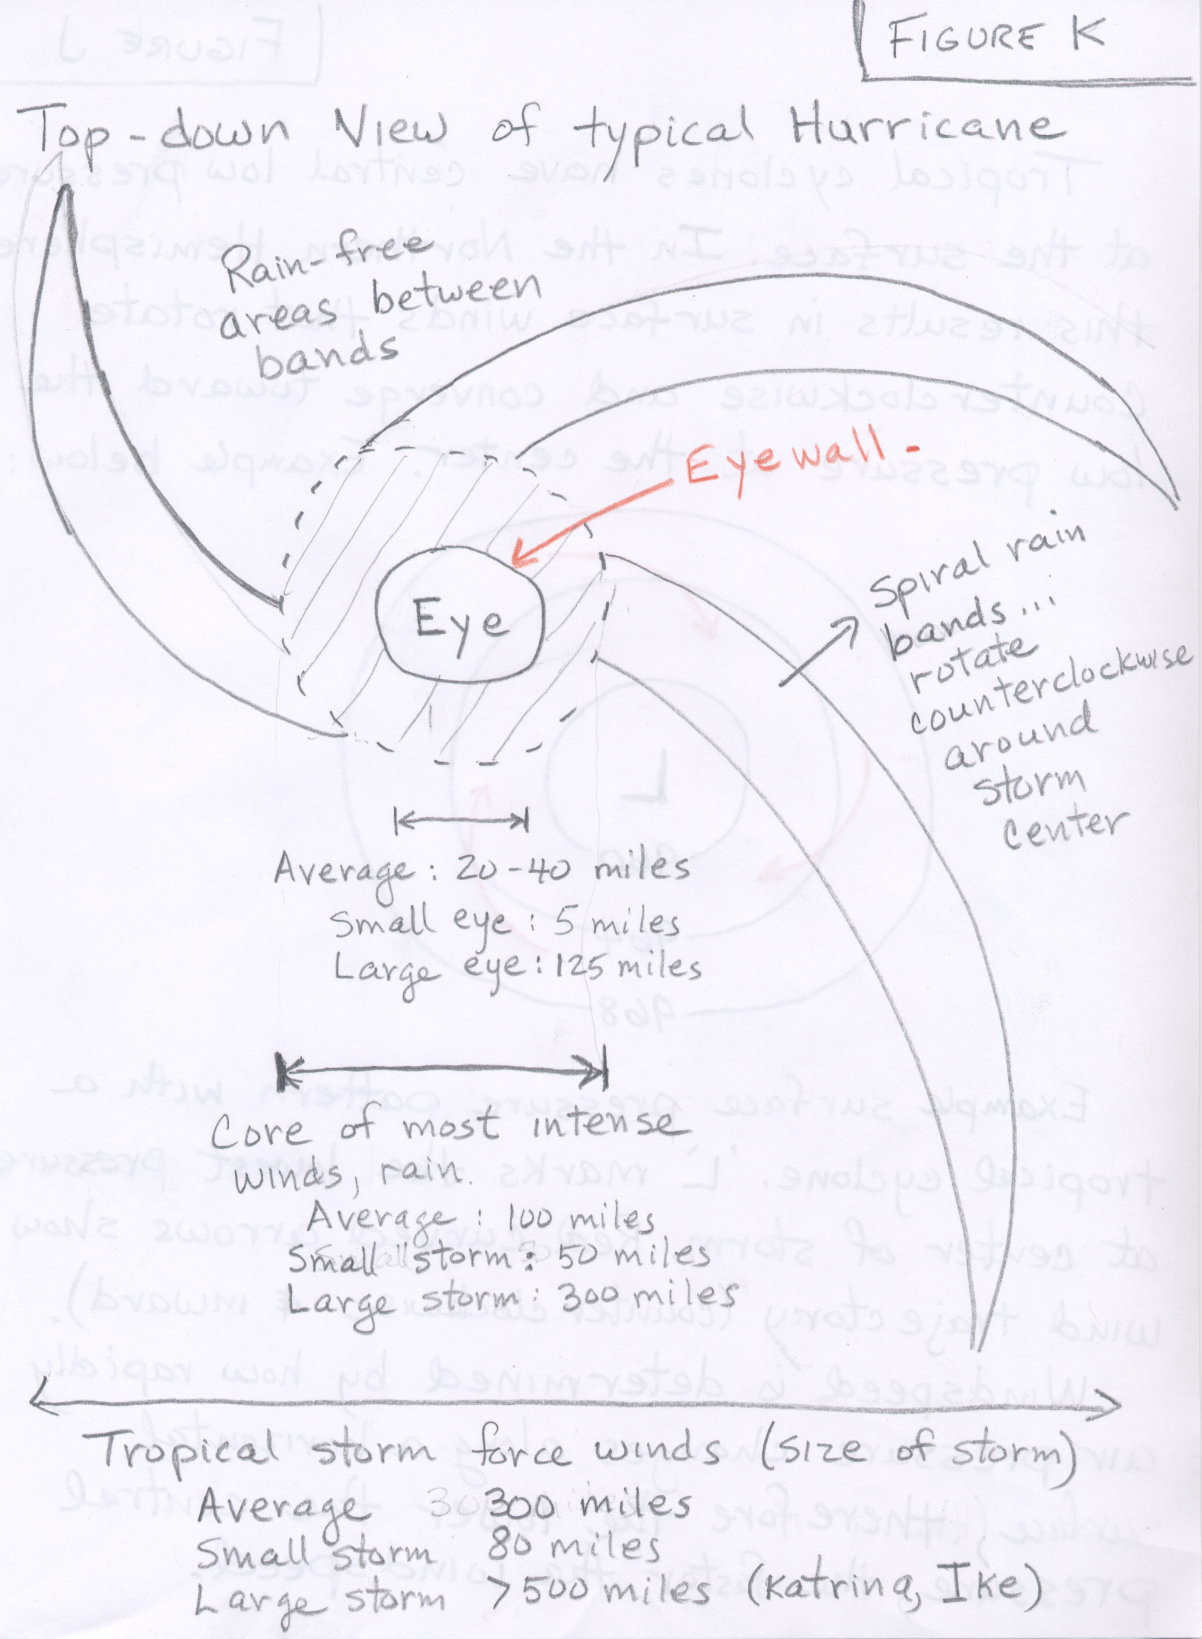
Notice that the clouds align themselves into spiraling bands (called spiral rain bands) that swirl in toward the storm's center, where they wrap themselves around the eye. Surface winds increase in speed as they blow counterclockwise and inward toward this center.
Adjacent to the eye is the eye wall, a ring of intense thunderstorms that whirl around the storm's center and extend upward to almost 15 km (49,000 ft) above sea level. Notice that the cloud tops in the eye wall region extend above the other clouds. Within the eye wall we find the heaviest precipitation and the strongest winds. Figure K shows a top-down view of a typical hurricane.
All strong tropical cyclones consist of the following components:
![]()
![]()
![]()