Friday Apr. 19, 2013
click here to download today's notes
in a more printer friendly format
Music to make you want to dance, Louis Prima "Sing Sing
Sing", before class today. I heard that song and saw
some pretty spectacular dancing at the School of Dance Student
Spotlight performance last night.
Several new 1S1P topics
are now available on what will be the last 1S1P Assignment of the
semester. Your report(s) are due by the start of class next
Friday (Apr. 26).
Revised Expt. #4, Book, and Scientific Paper reports are due next
Monday Apr. 22.
In today's first video you'll see
1. Some additional footage of the Andover KS tornado (the
one that tore through the parking lot and the one that caught up
the people driving on an interstate highway and forced them to
seek shelter under a bridge).
2. Pictures of new and distant supercell
thunderstorms and wall clouds.
3. A computer simulation of the growth and
development of a supercell thunderstorm.
But first we need to learn a little bit about supercell
thunderstorms.
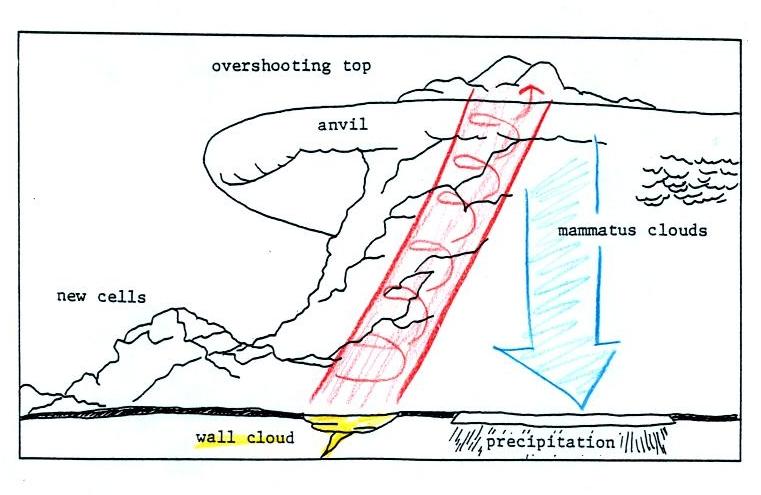
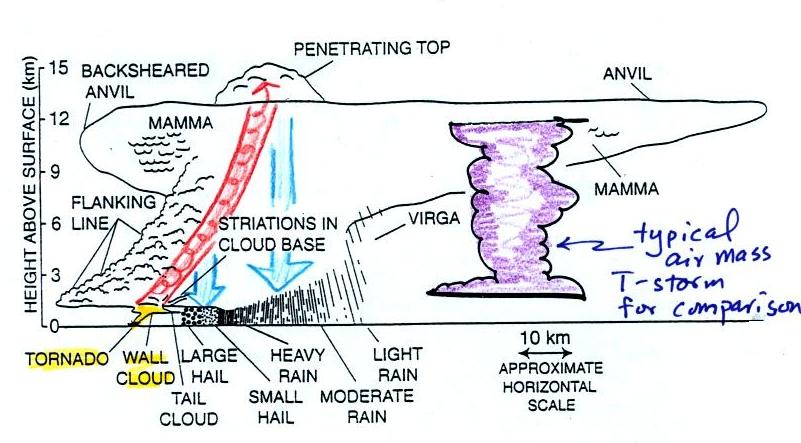
Here is a relatively simple drawing
showing some of the key features on a supercell
thunderstorm (found on p. 163 in the ClassNotes). In a supercell the rotating updraft (shown
in red above) is strong enough to penetrate a little way into
the stratosphere. This produces the overshooting top or
dome feature above. A wall cloud and a tornado are shown
at the bottom of the mesocyclone.
In an ordinary thunderstorm the updraft is unable to penetrate
into the very stable air in the stratosphere and the upward
moving air just flattens out and forms an anvil. The
flanking line is a line of new cells trying to form alongside
the supercell thunderstorm
(similar to convergence between prexisting winds and
thunderstorm downdraft winds that can lead to new storm
development alongside a dissipating air mass thunderstorm).
A short segment of video was shown at this point. It
showed a distant supercell thunderstorm and photographs of the
bases of nearby supercell thunderstorms. Here you could see
the spectacular wall cloud that often forms at the base of these
storms. Finally a computer simulation showed some of the
complex motions that form inside supercell thunderstorms,
particularly the tilted rotating updraft. I haven't been
able to find the video online.
Thunderstorms with rotating updrafts and
supercell thunderstorms often have a distinctive radar signature
called a hook echo.
We haven't discussed weather radar
in this class yet. In some ways a radar image of a
thunderstorm is like an X-ray photograph of a human body.
The Xrays pass through the flesh
but are partially absorbed by bone.
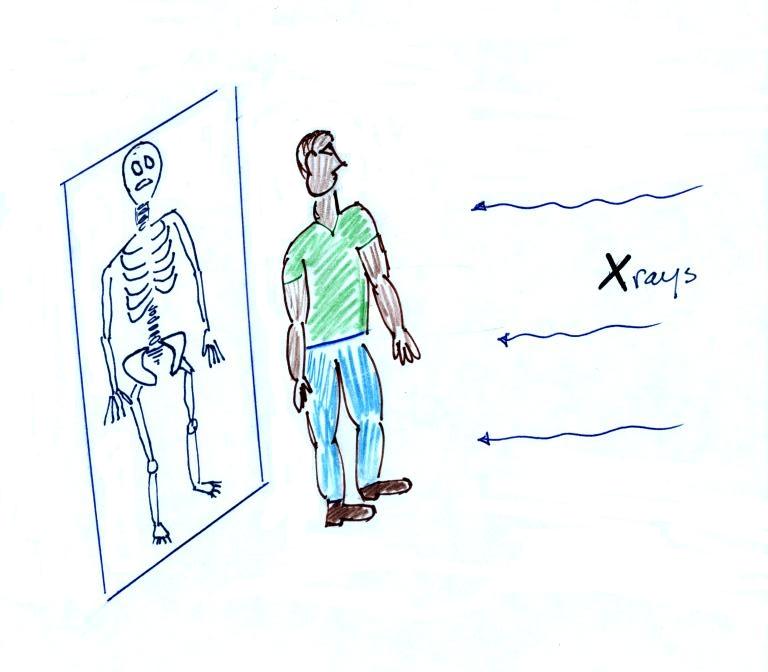
It is important to understand that the
X-ray doesn't photograph all the parts of the body, just the
skeleton.
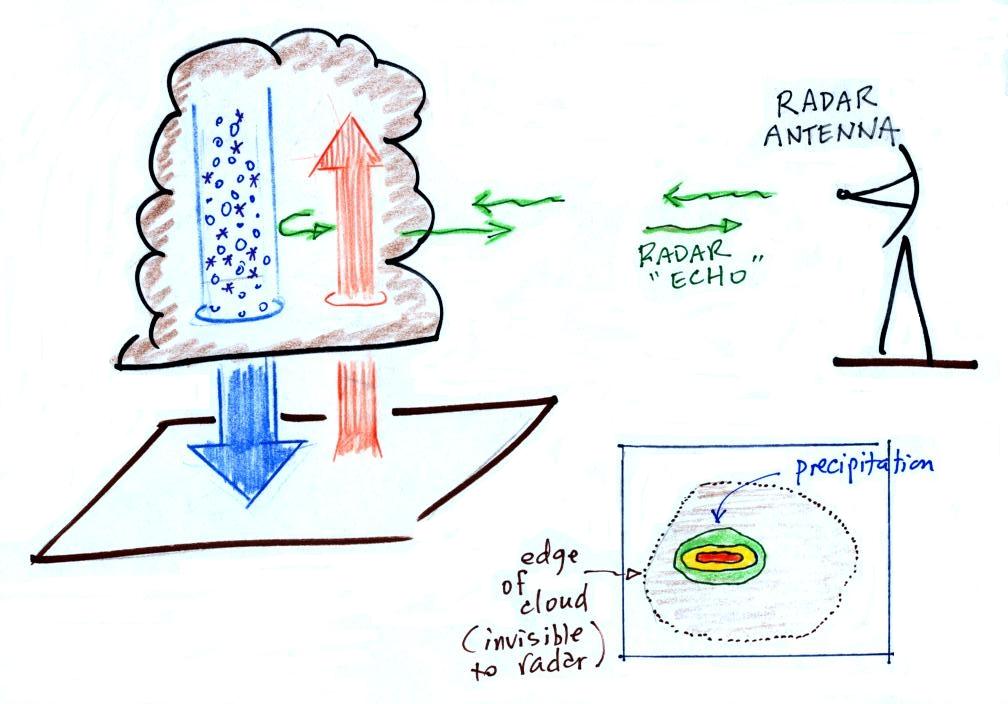
The
radio signals emitted by radar pass through the cloud itself
but are reflected by the much larger precipitation
particles. The radar keeps track of how long it takes for the
emitted signal to travel out to the cloud, be reflected, and
return to the radar antenna. The radar can use this to
determine the distance to the storm. It also knows the
direction to the storm and can locate the storm on a
map. The intensity of the reflected signal (the echo) is
often color coded. Red means an intense reflected signal
and lots of large precipitation particles. The edge of
the cloud isn't normally seen on the radar signal.
A Doppler radar (something we didn't
discuss in class) can detects small shifts in the
frequency of the reflected radar signal caused by precipitation
moving toward or away from the radar antenna. This can be
used to determine wind speeds inside the tornado.
Here is an actual radar image with a prominent hook
echo. The hook is evidence of large scale rotation inside
a thunderstorm and means the thunderstorm is capable of, and may
already be, producing tornadoes.
This is the radar image of a
thunderstorm that produced a very strong tornado that hit Oklahoma City in May 1999
. The hook echo is visible near the lower left
hand corner of the picture. Winds in the tornado
may have exceeded 300 MPH. You can read more about this
tornado here.
And here is some storm chase
video of the tornado.
The figure below (p. 162 in the ClassNotes) illustrates the
life cycle of a tornado. Have a close look at the next
tornado you see on video and see if you can determine whether it
is in one of the early or late stages of its development.
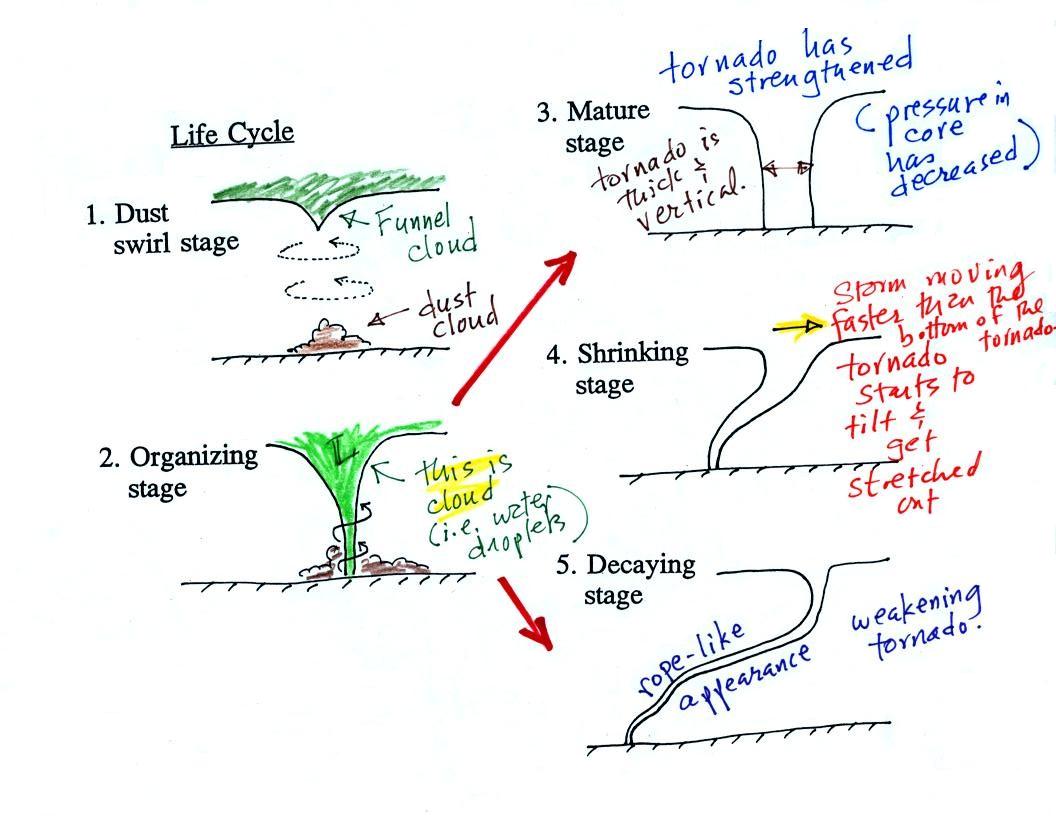
Tornadoes begin in and descend from a thunderstorm. You
would usually see a funnel cloud dropping from the base of the
thunderstorm. Spinning winds will probably be present
between the cloud and ground before the tornado cloud becomes
visible. The spinning winds can stir up dust at ground
level. The spinning winds might also be strong enough at
this point to produce some minor damage. Here is video of
the Laverne
Oklahoma tornado that was shown in class and that shows
the initial dust swirl stage very well.
In Stage 2, moist air moves horizontally toward the low
pressure in the core of the tornado. This sideways moving
air will expand and cool just as rising air does (see figure
below). Once the air cools enough (to the dew point
temperature) a cloud will form.
Tornadoes can go from Stage 2 to Stage 3 (this is what the
strongest tornadoes do) or directly from stage 2 to stage
5. Note a strong tornado is usually vertical and thick as
shown in Stage 3. "Wedge tornadoes"
actually appear wider than they are tall.
The thunderstorm and the top of the tornado will move faster
than the surface winds and the bottom of the tornado. This
will tilt and stretch the tornado. The rope like
appearance in Stage 5 is usually a sign of a weakening (though
still a dangerous) tornado.
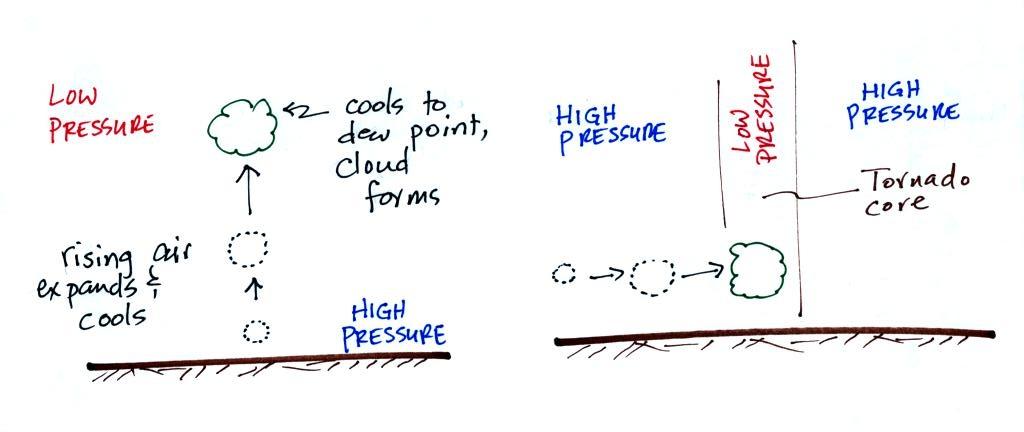
A tornado cloud forms is mostly the same way
that ordinary clouds do. In
an ordinary cloud (left figure above) rising air moves into lower
pressure surroundings and expands. Expansion cools the
air. If the air expands and cools enough (to the dew point)
a cloud forms. In a tornado air moves horizontally into
lower pressure at the core of the tornado. The air expands
and cools just like rising air does. If the air cools enough
a true cloud appears.
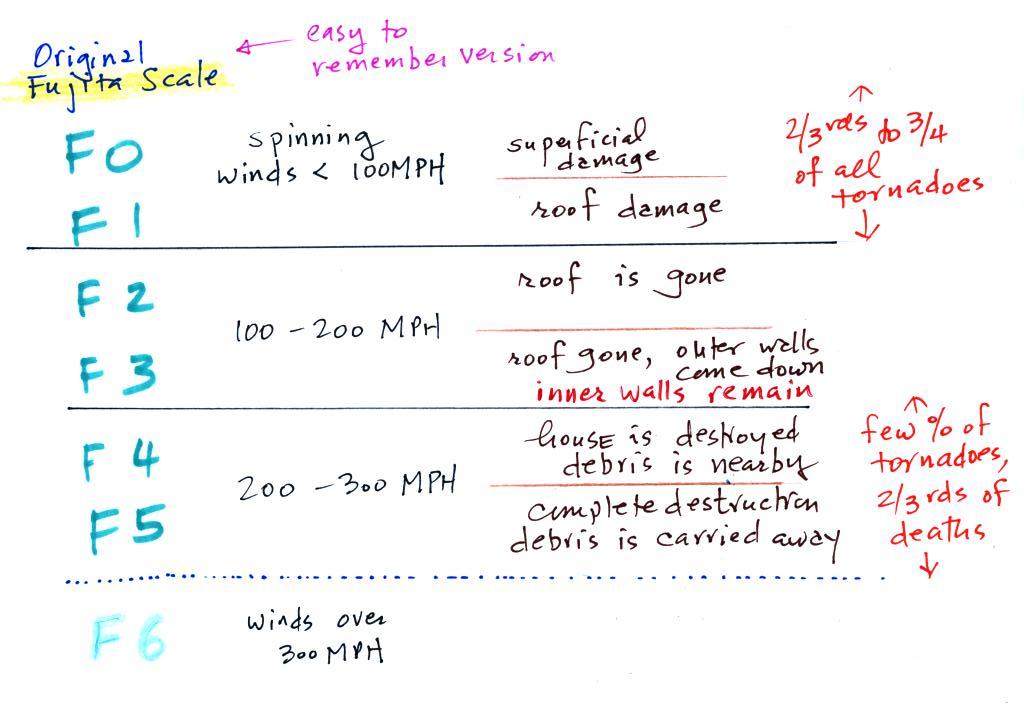
It is very hard to actually measure the speed of the rotating
winds in a tornado. Researchers usually survey the
damage caused by the tornado and assign a Fujita
Scale rating. The original scale, introduced in
1971 by Tetsuya (Ted) Fujita. A simplified, easy to
remember version is shown below. A
very basic and grossly oversimplified damage scale is
included. This is simple enough that I can remember it and
can use it to estimate tornado intensity when I see damage on the
television news.
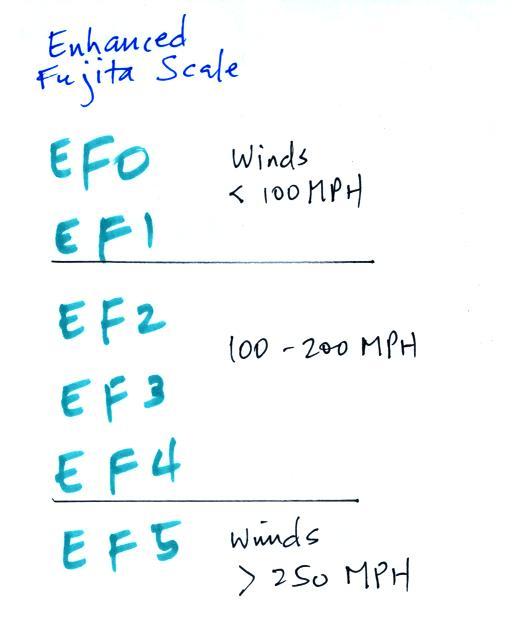
The original scale has been revised because the estimated wind
speeds were probably too high. The newer scale is called
the Enhanced
Fujita
Scale and became operational in 2007. Here's a
simplfied version of the EF scale
Now EF2, EF3 and EF4 levels have winds between 100
and 200 MPH and only EF5 tornadoes have winds over 200 MPH.
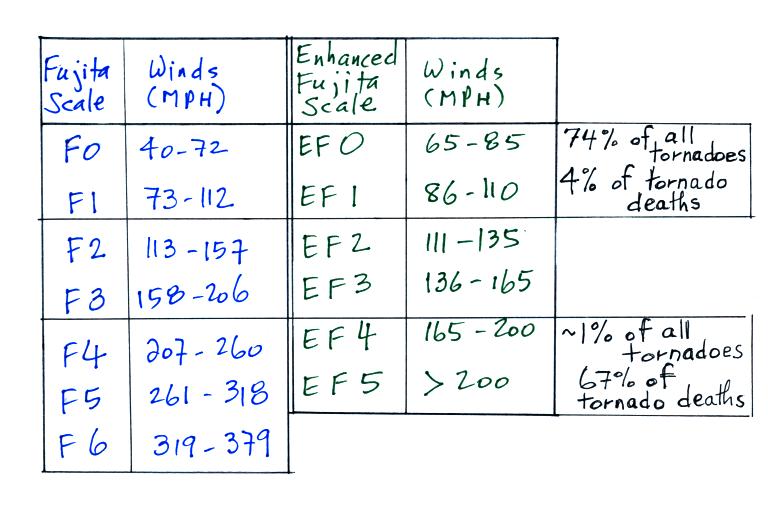
More accurate versions of both scales are compared below.
The original Fujita Scale actually goes up to F12.
An F12 tornado would have winds of about 740 MPH, the speed of
sound. Roughly 3/4 of all tornadoes are EF0 or EF1 tornadoes
and have winds that are less than 100 MPH. EF4 and EF5
tornadoes are rare but cause the majority of tornado deaths.
The EF scale considers 28 different "damage
indicators," that is, types of structures or vegetation that
could be damaged by a tornado. Examples include:
Damage Indicator
|
Description
|
2
|
1 or 2 family
residential home
|
3
|
Mobile home (single
wide)
|
10
|
Strip mall
|
13
|
Automobile showroom
|
22
|
Service station canopy
|
26
|
Free standing light pole
|
27
|
Tree (softwood)
|
Then for each indicator is a standardized list of
"degrees of damage" that an investigator can look at to
estimate the intensity of the tornado. For a 1 or 2
family home for example
degree
of
damage
|
description
|
approximate
wind speed (MPH)
|
1
|
visible damage
|
65
|
2
|
loss of roof covering
material
|
80
|
3
|
broken glass in doors
& windows
|
95
|
4
|
lifting of roof deck,
loss of more than 20% of roof material, collapse of
chimney, garage doors collapse inward, destruction of
porch roof or carport
|
100
|
5
|
house slides off
foundation
|
120
|
6
|
large sections of roof
removed, most walls still standing
|
120
|
7
|
exterior walls collapse
(top story)
|
130
|
8
|
most interior walls
collapse (top story)
|
150
|
9
|
most walls in bottom
floor collapse except small interior rooms
|
150
|
10
|
total destruction of
entire building
|
170
|
You'll find the entire set of damage indicators and lists of
degrees of damage here.
Here's some recent
video, not shown in class, of damage being caused by a
tornado as it happened (caught on surveillance video). The
tornado struck West Liberty, Kentucky on March 2 this year.
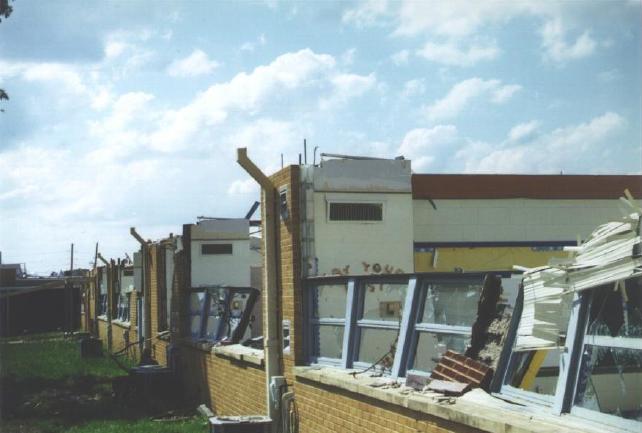
The photos below show examples of damage caused by EF2,
EF4, and EF5 tornadoes.
EF2 Damage
roof is gone, but all walls still standing
|
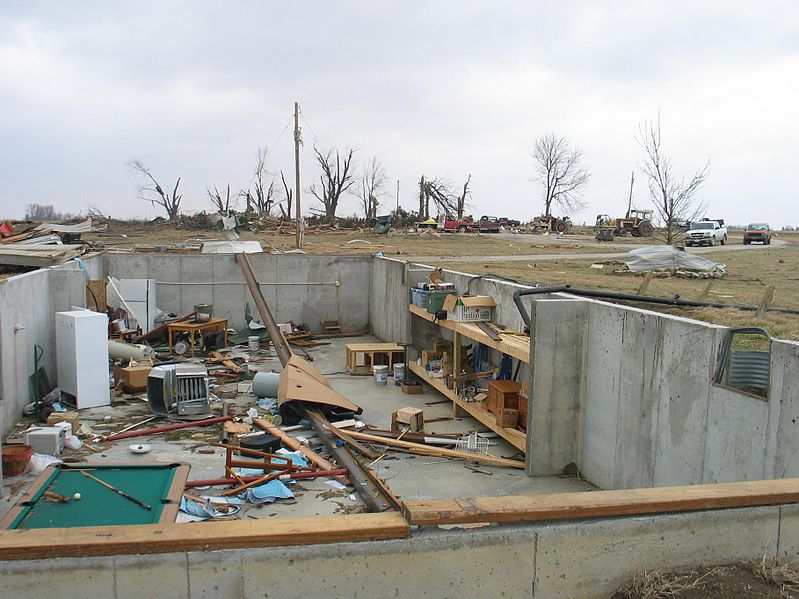
EF4 Damage
only the strong reinforced concrete basement walls
are left standing. It doesn't look like there
would have been anywhere in this building that would
have provided protection from a tornado this strong.
|
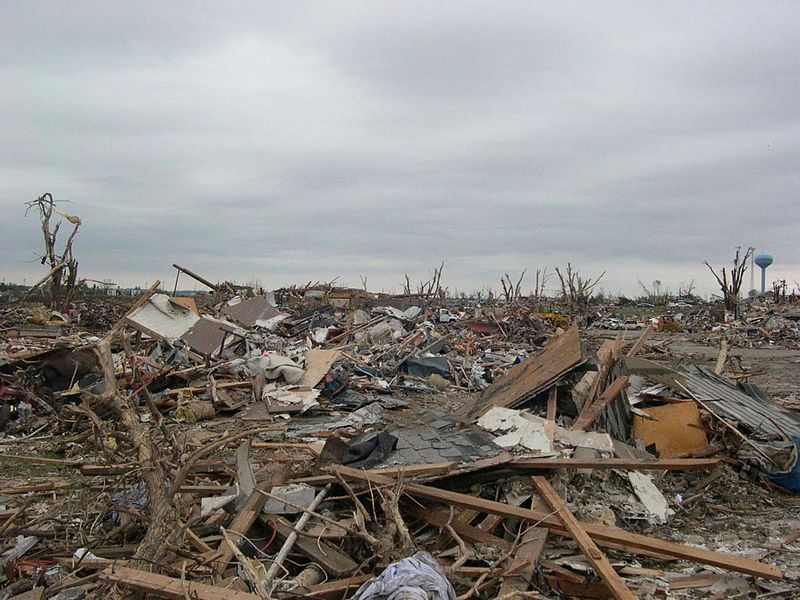
EF5 Damage
complete destruction of the structure
|
|
|
|
Here are
some additional, older, photographs of typical damage associated
with all the levels on the Fujita Scale. None of these
photographs was shown in class.
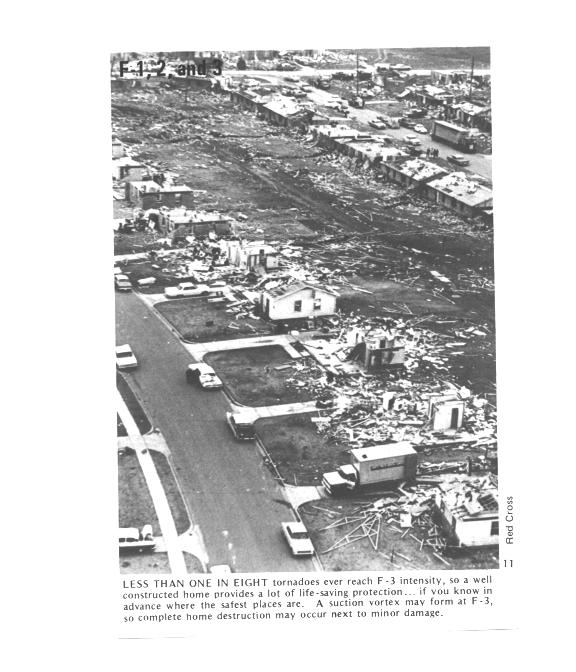
And finally, something that was initially a puzzle.
Several levels of
damage (EF1 to about EF3) are visible in the photograph
above. It was puzzling initially how some homes could
be nearly destroyed while a home nearby or in between was
left with only light damage. One possible explanation
is shown below.
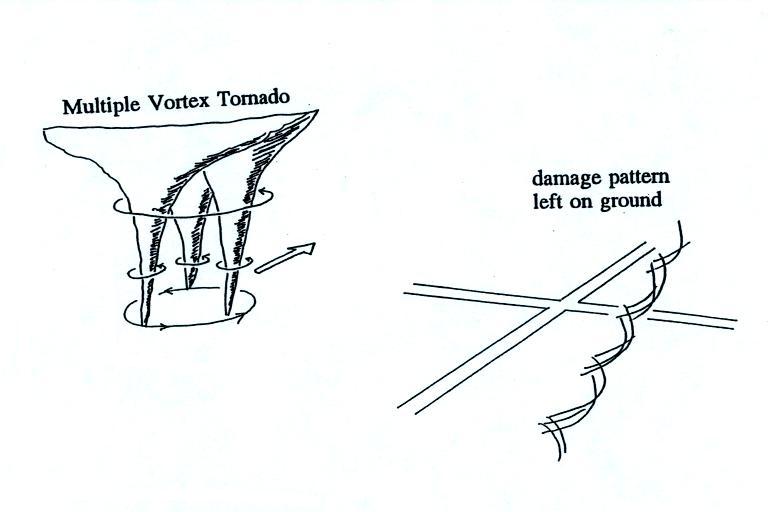
Some
big
strong
tornadoes
may
have
smaller
more
intense
"suction
vortices"
that
spin
around
the
center
of
the tornado (they would be hard to see because of
all the dust in the tornado cloud. Tornado
researchers have actually seen the pattern shown at
right scratched into the ground by the
multiple vortices in a strong tornado.
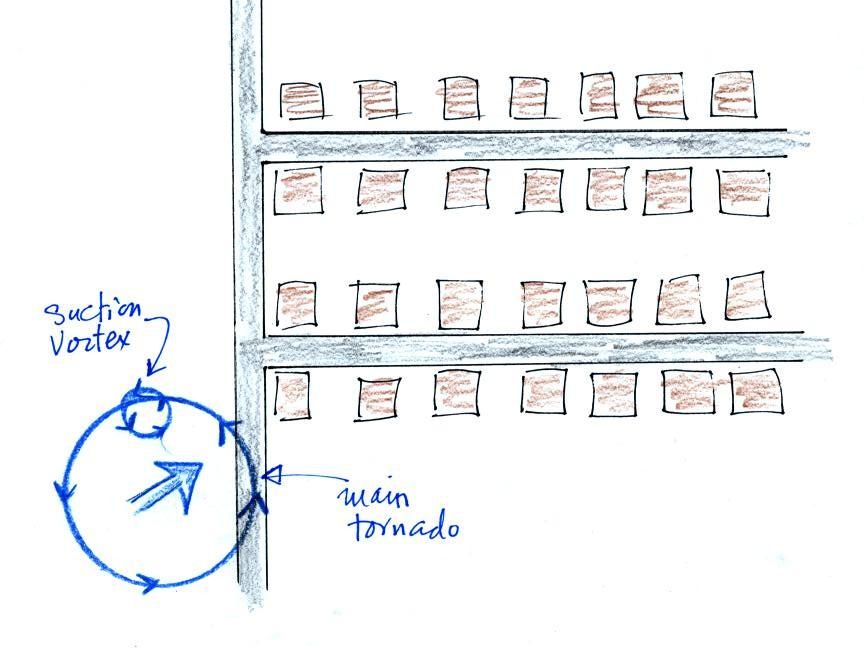
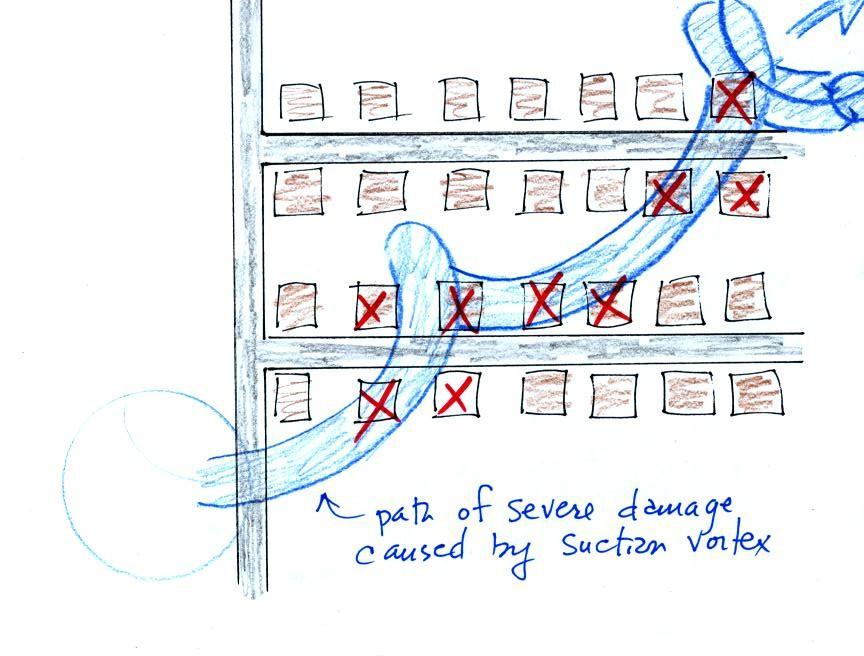
The sketch above shows a
tornado located SW of a neighborhood.
As the tornado sweeps through the neighborhood, the
suction vortex will rotate around the core of the tornado.
The
homes marked in red would be damaged
severely. The others would receive less
damage. Remember that there are multiple
suction vortices in the tornado, but the
tornado diameter is probably larger than shown
here.
At
this
point
we
watched
the last of the tornado video tapes. It showed a
tornado that occurred in Pampa, Texas (here are a couple
of videos that I found on YouTube: video
1, video
2, they're missing the commentary that was on the
video shown in class). Near the end of the segment,
video photography showed several vehicles (pick up trucks
and a van) that had been lifted 100 feet or so off the
ground and were being thrown around at 80 or 90 MPH by the
tornado winds. Winds speeds of about 250 MPH were
estimated from the video photography (though the wind
speeds were measured above the ground and might not have
extended all the way to the ground).
Here's a little more information
about wind motions inside tornadoes in response to a question
after class. None of this was
discussed in class on Friday.
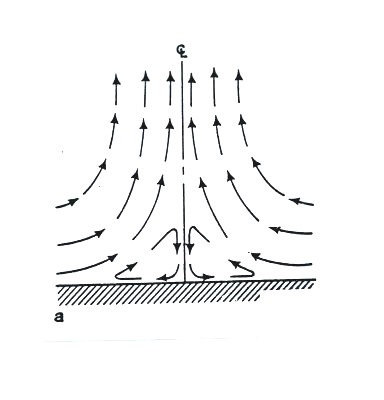
Air motions inside tornadoes are complex and difficult to study
directly. Researchers resort to laboratory simulations and
computer models. The figures below show some of the air
motions thought to occur in tornadoes.
Wind motions in a fairly weak
tornado. The winds would also be spinning in
addition moving upward as shown here.
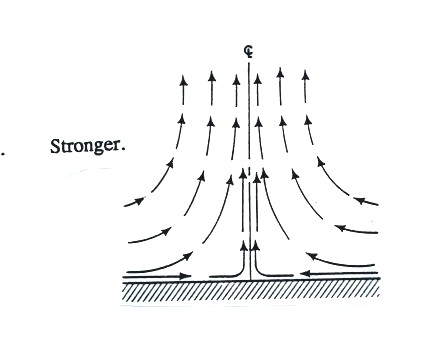
This tornado is a little
stronger.
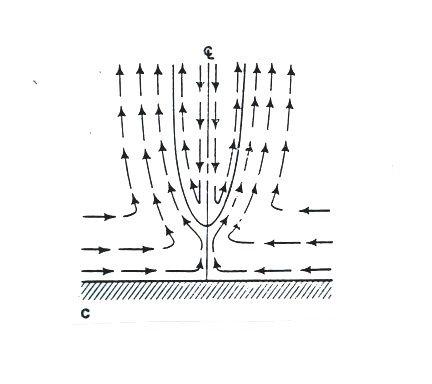
This tornado is even
stronger. The air in the center has started to sink
(this is called vortex breakdown), but the sinking air
doesn't reach the ground. The diameter of the tornado
has also grown.
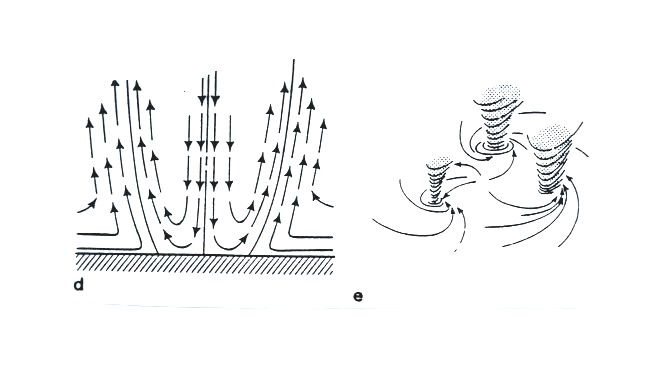
It is when the sinking air in the middle reaches the ground
that multiple vortices may form.