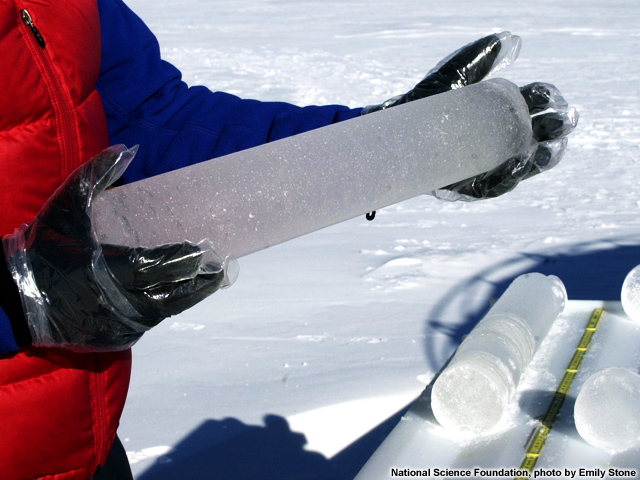
(source
of this image)
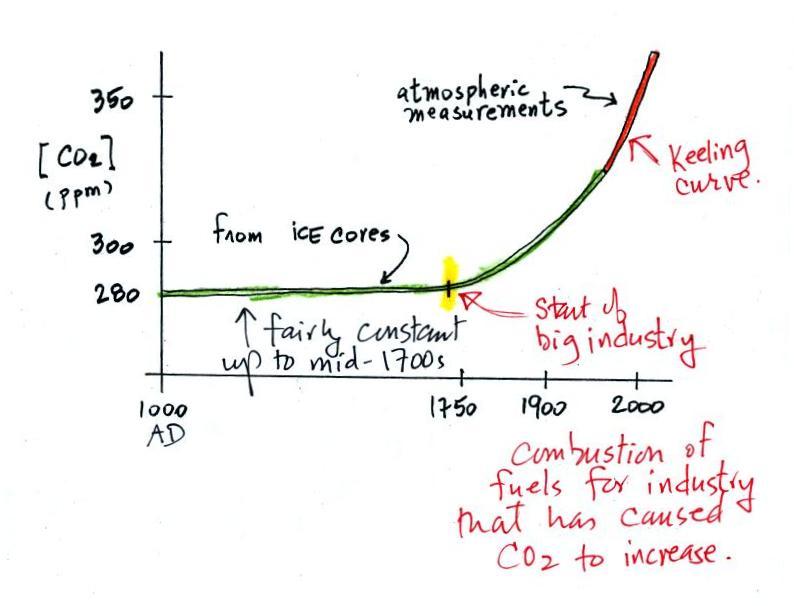
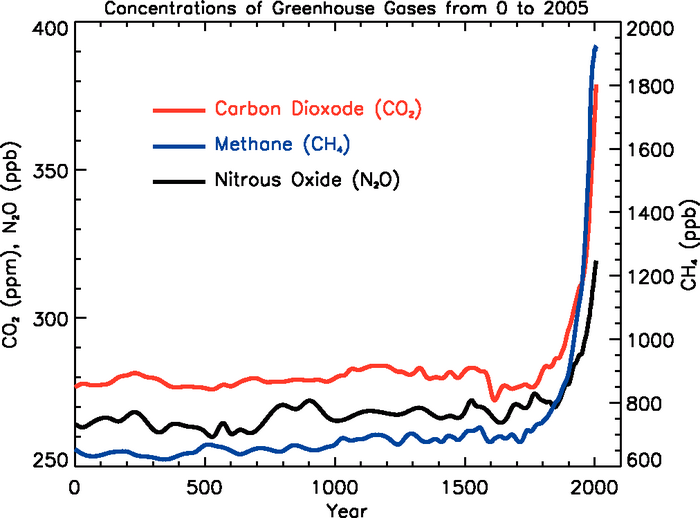
Using the ice core measurements scientists
have determined that atmospheric CO2 concentration was fairly constant at about
280 ppm between 0 AD and the mid-1700s when it started to
increase. The start of rising CO2 coincides with the beginning of the
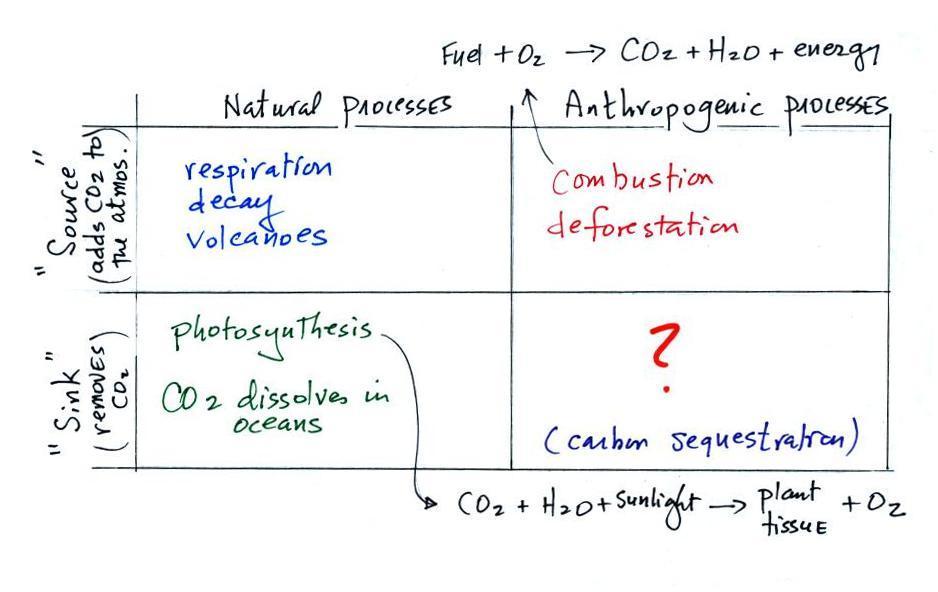
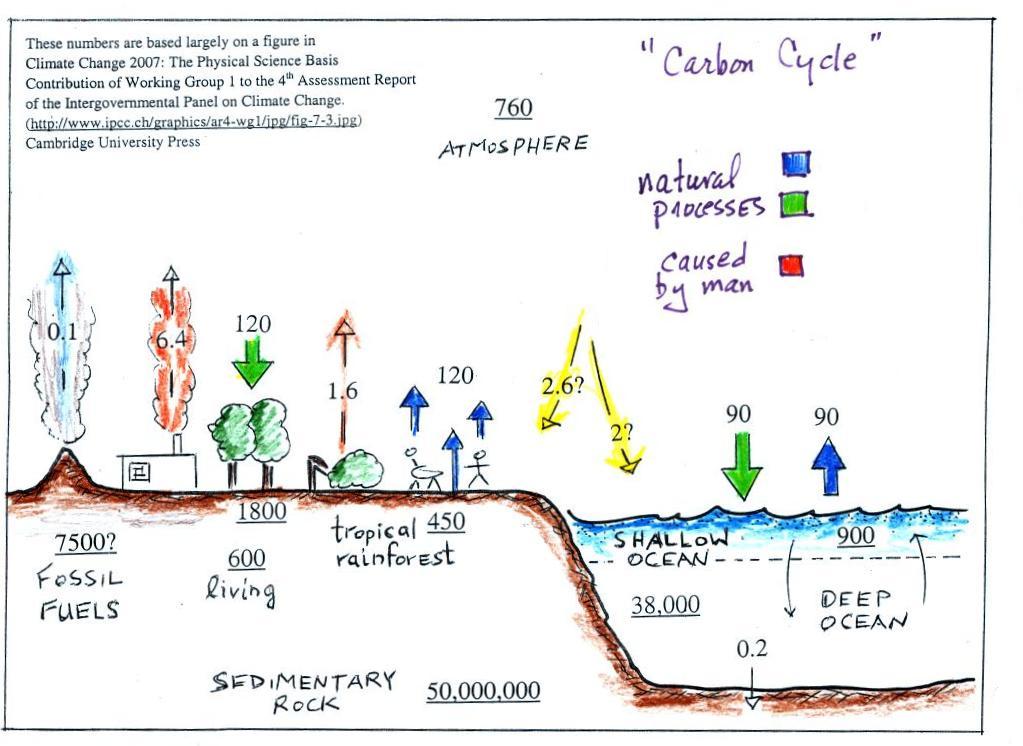
"Industrial Revolution." Combustion of
fossil fuels needed to power factories began to add
significant amounts of CO2
to the atmosphere.