![]()
![]()
![]()
![]()
In the broad belt around the earth known as the tropics -- the region within 23½° latitude north and south of the equator -- the weather is much different from the middle latitudes. The noon sun is always high in the sky and seasonal changes in temperature are small compared with the more drastic seasonal changes at higher latitudes. The daily heating of the surface and high humidity favor the development of cumulus clouds and thunderstorms. Frequent showers and non-violent thunderstorms often accompanied with heavy rainfall are typical for tropical regions. Intense and well organized storm systems are relatively rare.
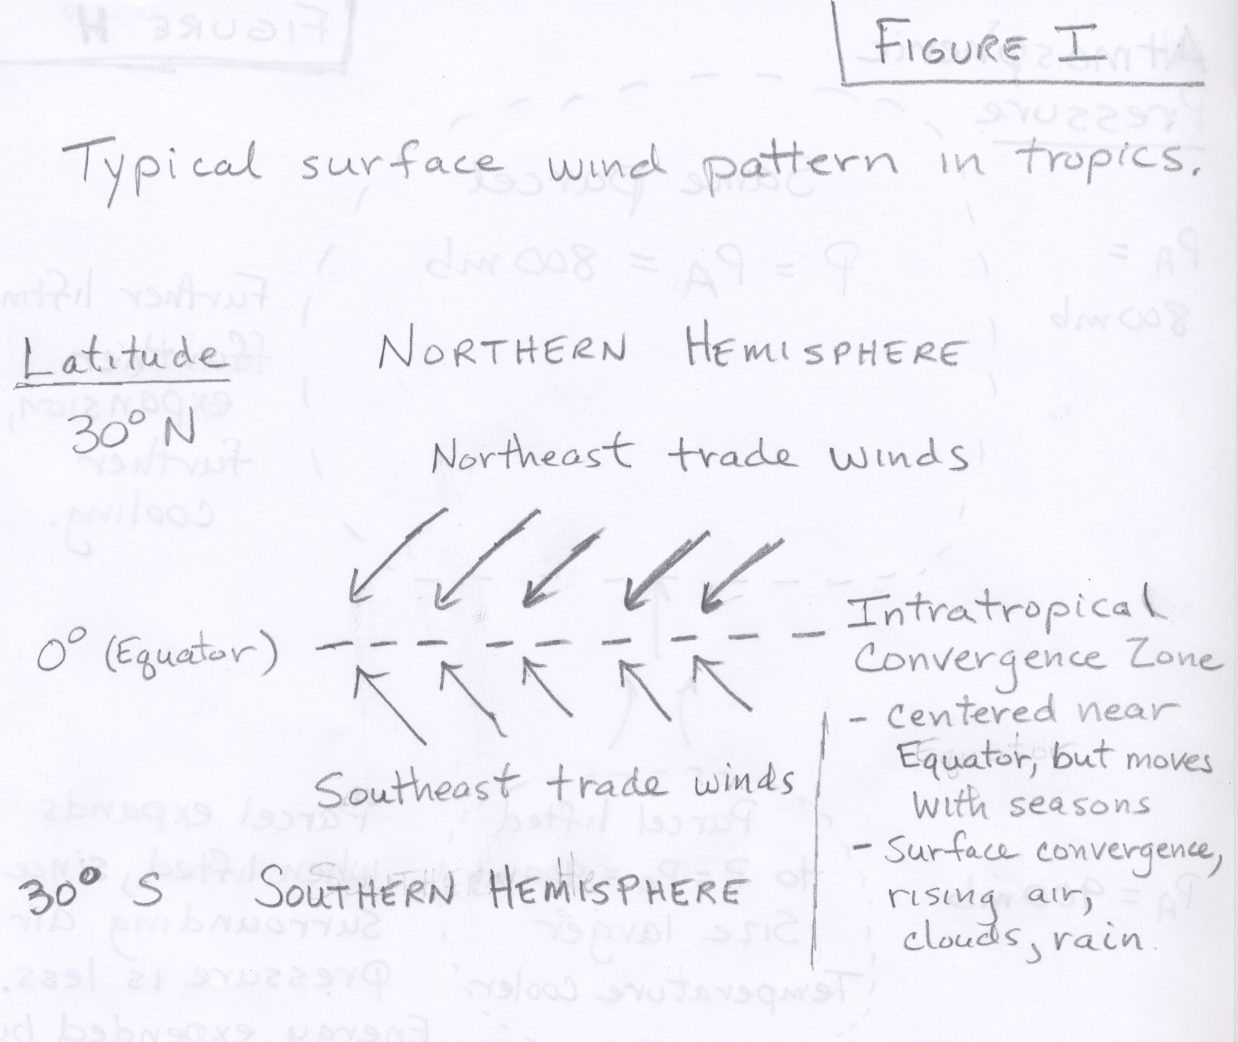
Surface winds in the tropics generally blow from the east -- northeast (in the northern hemisphere), or southeast (in the southern hemisphere) -- these reliable and steady winds are called the trade winds. Between these two winds flows is an area of convergence known as the intratropical convergence zone (See Figure I). This band of surface convergence, forced rising air, and clouds is easily seen on satellite imagery and is a prominent part of the climate of Earth.
Occasionally, a large undulation or ripple in the normal trade wind pattern will develop and move slowly from east toward west. These disturbances in the flow are called tropical waves, or easterly waves. Because variaions of surface air pressure in the tropics are so slight compared with the middle latitudes, tropical waves are best shown by plotting steamlines of the wind patterns as shown in this example. The example also indicates where areas of surface convergence (which forces rising motion resulting in the development of clouds and rain) and surface divergence (which forces sinking motion resulting in mainly clear skies) occur relative to the position of the easterly wave. The typical westward movement of a tropical easterly wave is shown in this animation. Although the majority of tropical waves die out before becoming major systems, if conditons are favorable, tropical waves can intensify, develop a central low pressure region around which the winds rotate, and grow into hurricanes. In fact, most severe hurricanes that affect the United States begin as easterly waves, which move of the continent of Africa. More information and a diagram can be found in this African Easterly Wave Link. Usually these easterly waves are relatively weak until they move into the warmer waters in the western Atlantic, Caribbean, and Gulf of Mexico.
Although most of the severe hurricanes that affect the United States begin as easterly waves that move off Africa and across the Atlantic, there have been many cases where hurricanes initially formed much closer to the United States -- in the Carribean and Gulf of Mexico. In those cases it often appears that a region of surface convergence or upper-level divergence with an associated area of disorganized thunderstorms eventually develops rotation and strengthens.
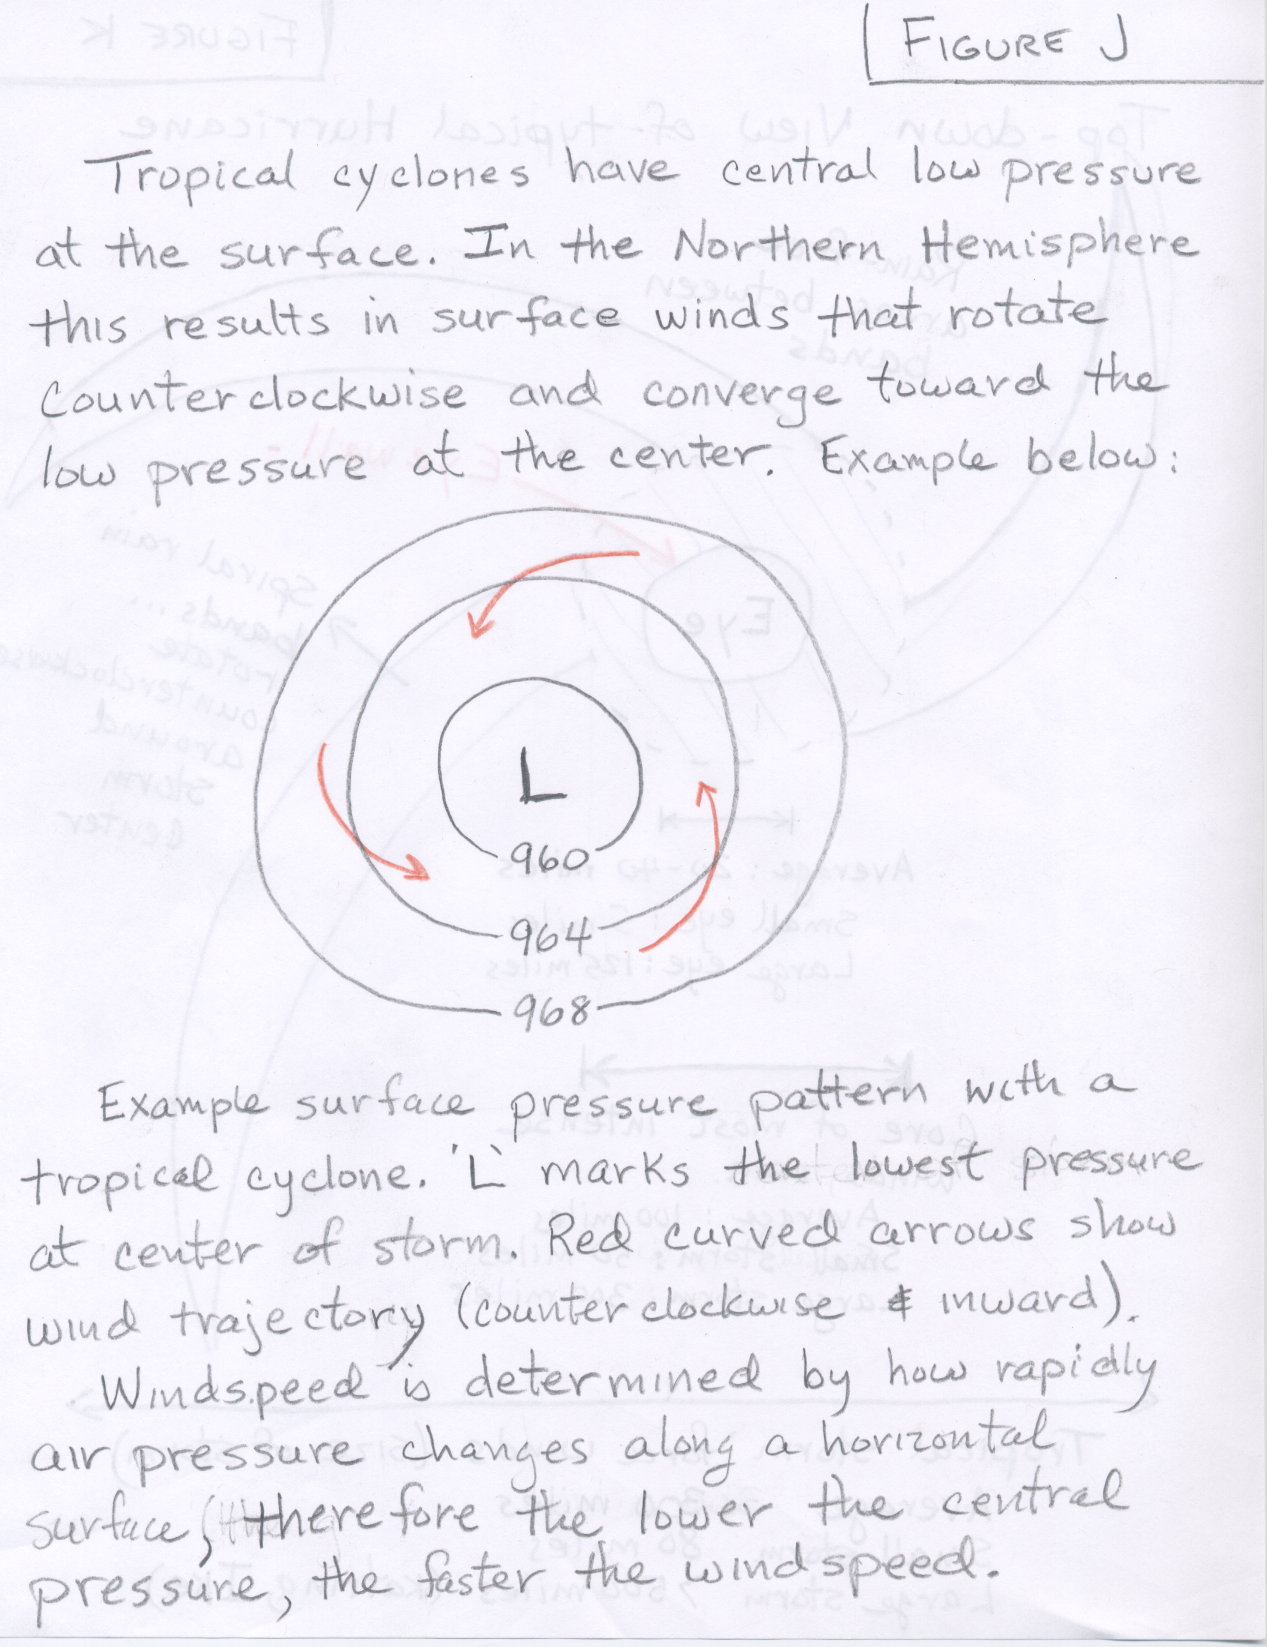
Tropical cyclone is the generic name given to a surface low pressure system over tropical waters, with organized convection (i.e., thunderstorm activity) and a definite cyclonic (or counter-clockwise) surface wind pattern (See Figure J). Recall from Module 1 material that the ground surface winds around a circular area of lower pressure (in the Northern Hemisphere) are mostly counterclockwise, but also inward. The speed of the winds depend on how rapidly air pressure increases in moving out from the low pressure center. As described in Figure J, the speed of the wind and strength of the storm depends on how low the central pressure gets. Remember that the average sea level pressure is about 1000 mb (1013.25 mb to be exact), and somewhere outside the storm, the pressure will have to return to average, thus the lower the central pressure of the storm, the stronger the pressure gradient, the stronger the winds and the stronger the storm. As a tropical cyclone intensifies, it is classified according to wind speed.
(*)Hurricane is the term used in the north Atlantic Ocean and the north and south Pacific oceans east of the dateline. These storms are given different names in other ocean basins:
Tropical storms and hurricanes are the only natural disasters which have their own names (e.g., Andrew, Camille, Hugo, the 2004 Florida hurricanes, Charles, Frances, Ivan, and Jeanne, the damaging 2005 hurricanes, Dennis, Katrina, Rita, and Wilma, and in 2008 Gustov and Ike). Names seem appropriate because we commonly come to know hurricanes long before they strike land, often watching these storms move across the oceans for days or even weeks. By contrast isolated severe thunderstorms and tornadoes develop suddenly and last only hours. Hurricanes are much larger than an individual severe thunderstorm cell and are more correctly described as being composed of an organized clustering of thunderstorms. They are quite powerful and release great amounts of energy (mostly in the form of latent heat during condensation). In fact the energy released by a single, strong hurricane can be greater than the total annual energy consumption of the United States and Canada combined.
Surface atmospheric pressure in the center of a hurricane tends to be extremely low. The lowest pressure reading ever recorded for a hurricane (typhoon Tip, 1979) is 870 millibars (mb). However, most storms have an average pressure of 950 millibars. Wind speed in a hurricane is highly related to the surface pressure of the storm, since the windspeed is determined by the pressure gradient or the change in air pressure divided by the distance over which the pressure change happens. The average sea level air pressure on Earth is 1013.25 mb. The the pressure gradient (and hence windspeed) depends on the difference in pressure between the lowest pressure in the center of the storm and the pressure outside the storm (average 1013 mb) divided by the distance over which the pressure change happens. In general, the lower the central pressure, the higher the windspeeds generated. In fact hurricanes are classified by either windspeed or the central pressure (with low pressure being more intense). The graph below shows the relationship between surface pressure and sustained wind speed for a number of tropical low pressure systems. This is a rather old figure and does not contain data from hurricanes after 1990.
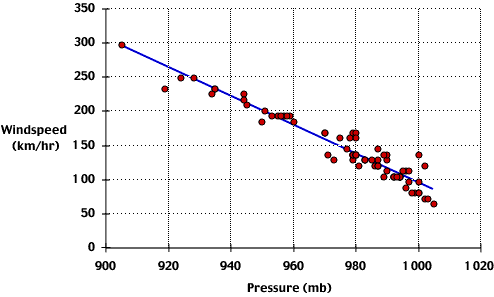 |
| Relationship between surface pressure and wind speed for a number of tropical low pressure systems. Tropical low pressure systems are classified as hurricanes when their pressure is 980 millibars or lower, and sustained wind speeds are greater than 118 kilometers per hour. |
For historical perspective, the table below shows that hurricane Katrina was the sixth strongest hurricane ever located in the north Atlantic Ocean and the third strongest to hit the United States at the time of landfall in terms of its central pressure (at least since reliable meterological measurements have been available).
| Top six most intense Atlantic hurricanes since measurements began Hurricane intensity is measured solely by central pressure, i source:NOAA |
|||||||
|---|---|---|---|---|---|---|---|
| North Atlantic | Landfall U.S. | ||||||
| Rank | Hurricane | Year | Pressure | Rank | Hurricane | Year | Pressure |
| 1 | Wilma | 2005 | 882 mbar | 1 | "Labor Day" | 1935 | 892 mbar |
| 2 | Gilbert | 1988 | 888 mbar | 2 | Camille | 1969 | 909 mbar |
| 3 | "Labor Day" | 1935 | 892 mbar | 3 | Katrina | 2005 | 920 mbar |
| 4 | Rita | 2005 | 897 mbar | 4 | Andrew | 1992 | 922 mbar |
| 5 | Allen | 1980 | 899 mbar | 5 | "Indianola" | 1886 | 925 mbar |
| 6 | Katrina | 2005 | 902 mbar | 6 | "Florida Keys" | 1919 | 927 mbar |
| Based on data from: The Weather Channel | Based on data from: National Hurricane Center | ||||||
Please see the following link for more information on historic Atlantic Hurricanes.
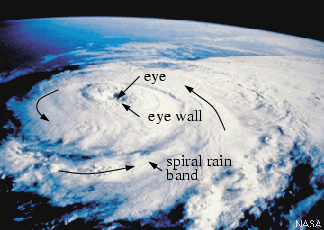
A hurricane is an intense storm of tropical origin, with sustained winds exceeding 64 knots (74 mi/hr). Below is a photo of Hurricane Elena. The storm is approximately 500 km (310 mi) in diameter, which is about average for hurricanes. The area of broken clouds in the center is its eye. Elena's eye is almost 40 km (25 mi) wide. Within the eye, winds are light and clouds are mostly broken. The surface pressure is very low, nearly 955 mb.
 |
| Hurricane Elena as photographed from the space shuttle Discovery during September, 1985. |
 |
| Structure of a Hurricane |
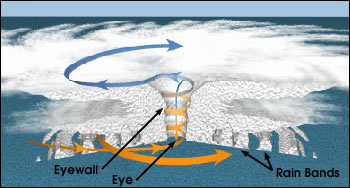
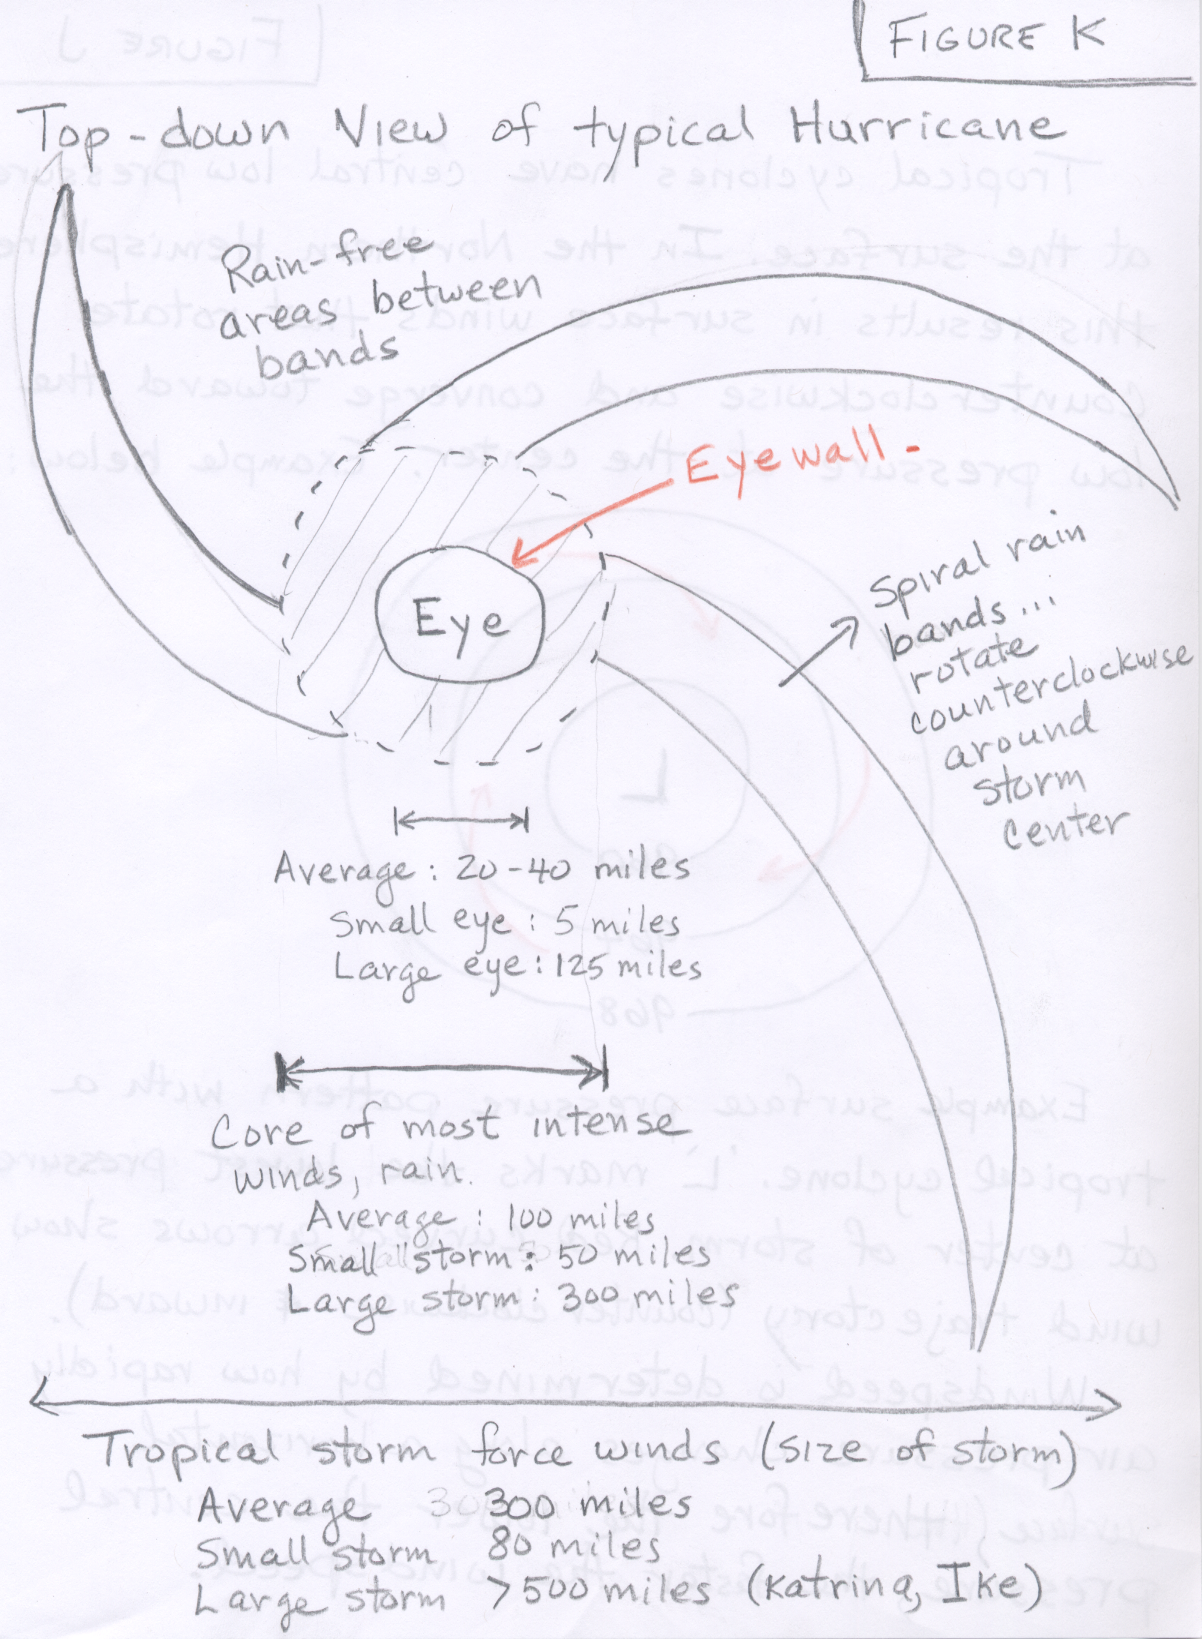
Notice that the clouds align themselves into spiraling bands (called spiral rain bands) that swirl in toward the storm's center, where they wrap themselves around the eye. Surface winds increase in speed as they blow counterclockwise and inward toward this center.
Adjacent to the eye is the eye wall, a ring of intense thunderstorms that whirl around the storm's center and extend upward to almost 15 km (49,000 ft) above sea level. Notice that the cloud tops in the eye wall region extend above the other clouds. Within the eye wall we find the heaviest precipitation and the strongest winds. Figure K shows a top-down view of a typical hurricane.
All strong tropical cyclones consist of the following components:
The formation of tropical cyclones is still a topic of intense research and is not fully understood, although research has shown that certain factors must be present for cyclones to intensify to hurricane strength.
Hurricanes form over tropical waters where the winds are light, the humidity is high in a deep layer, and the surface water temperature is warm, typically 26.5°C (80°F) or greater, over a vast area. Moreover, the warm surface water must extend downward to a depth about 200 m (600 ft) before hurricane formation is possible.
Hurricanes are powered by the latent heat energy released from condensation. To form and develop they must be supplied with a constant supply of warm humid air for this process. Surface air with enough energy to generate a hurricane only exists over oceans with a temperature greater than 26.5°C. Moreover, the atmosphere above a developing storm must be unstable, i.e., the temperature must decrease rapidly with increasing altitude. This is condusive to thunderstorm formation in general.
Hurricanes cannot develop on or very near the Equator. In fact they do not form in the region within 4° latitude either side of the equator. Within this region Coriolis force is negligible. Coriolis force is required for the initiation of rotation. In fact it is relatively rare for hurricanes to form within 10° of latitude from the Equator.
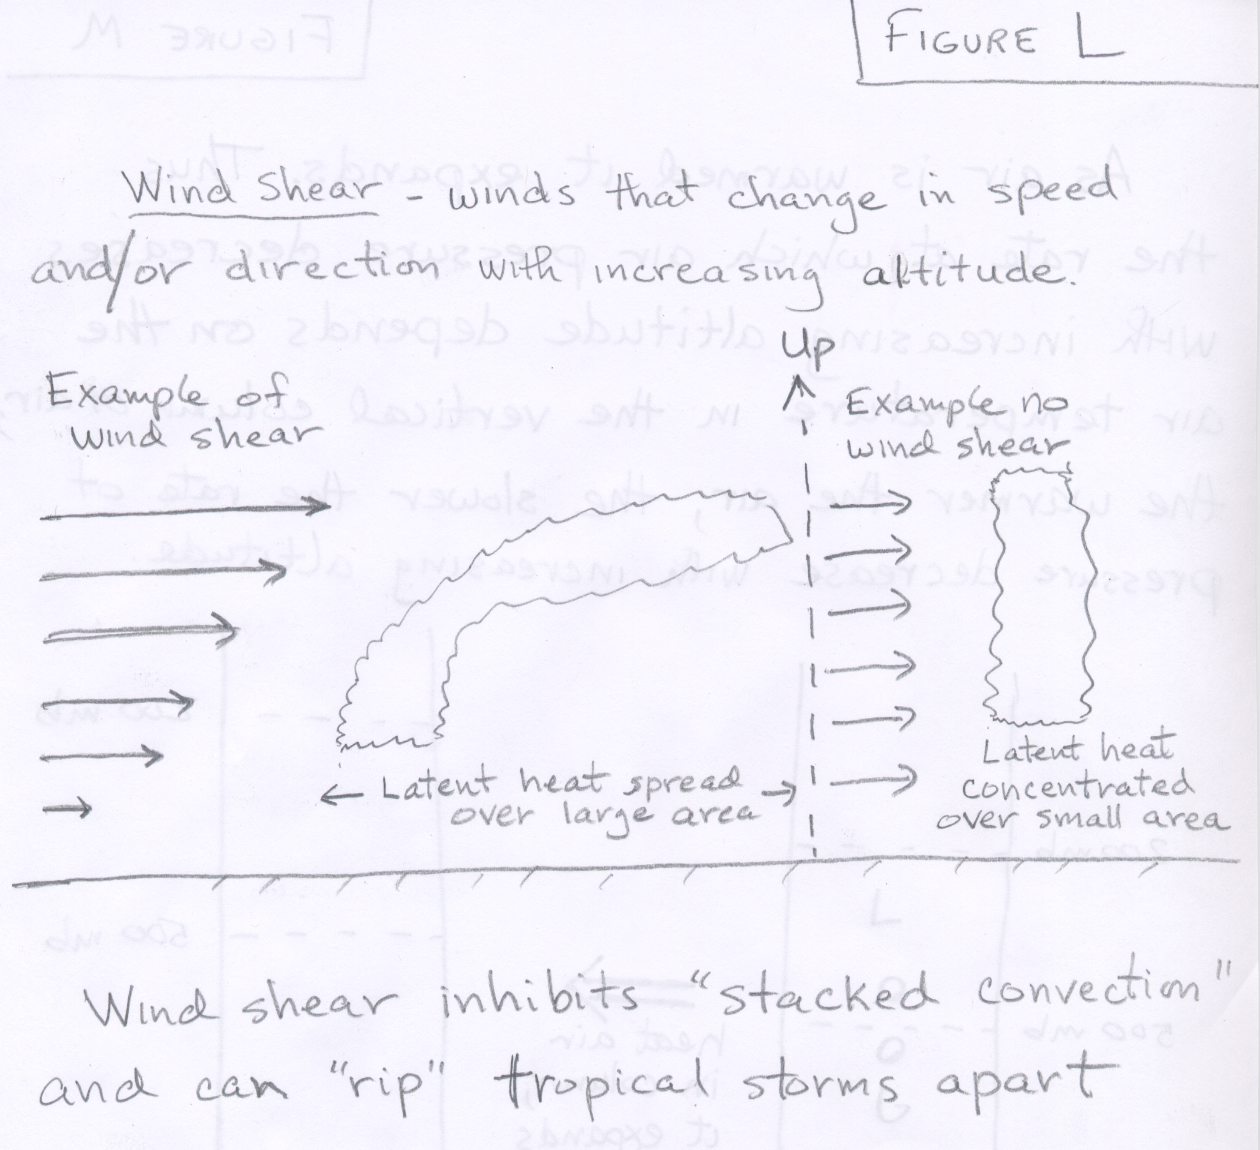
Finally, hurricanes will not form if there is significant wind shear, which is a change in wind velocity and/or direction with increasing altitude
Hurricanes grow stronger as long as the air aloft moves outward away from the storm center more quickly than the surface air moves in toward the center. They dissipate rapidly when they move over colder water or over a large landmass as these conditions cut-off the supply of warm, humid air. Hurricanes will also weaken if they move into an area that has strong vertical wind shear.
Below is a summary list of five requirements for tropical storm development and intensification.
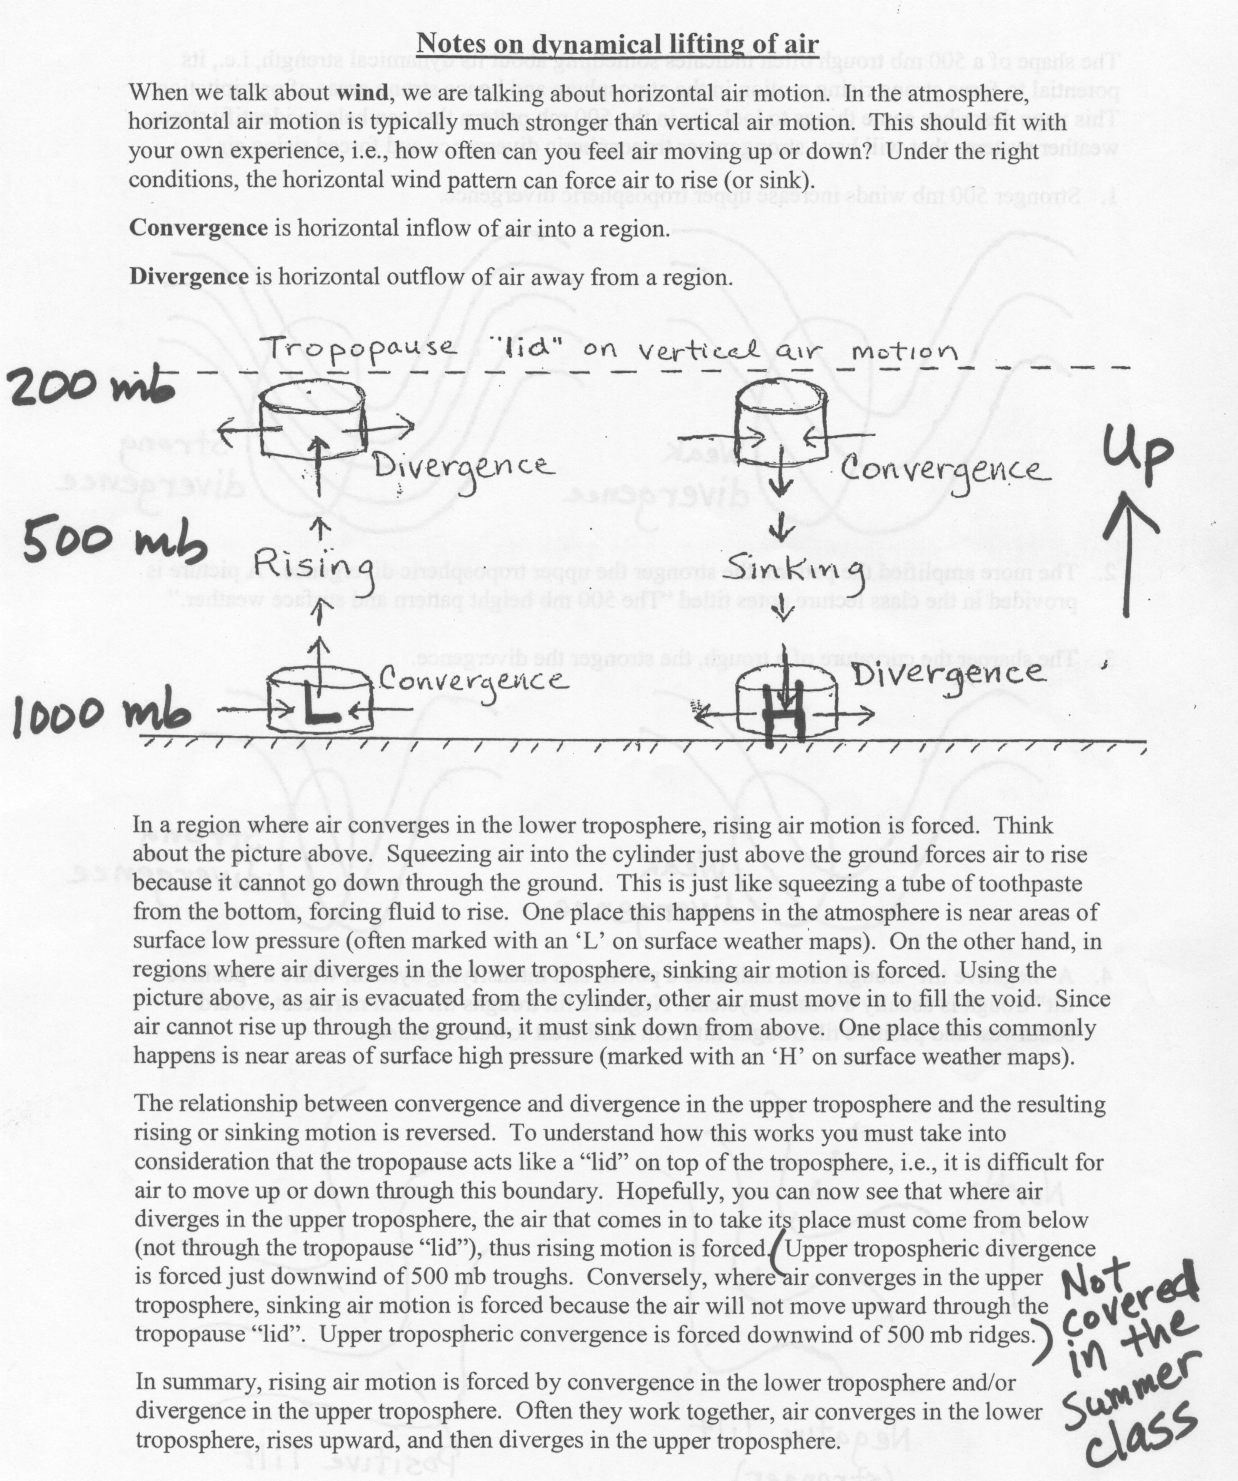
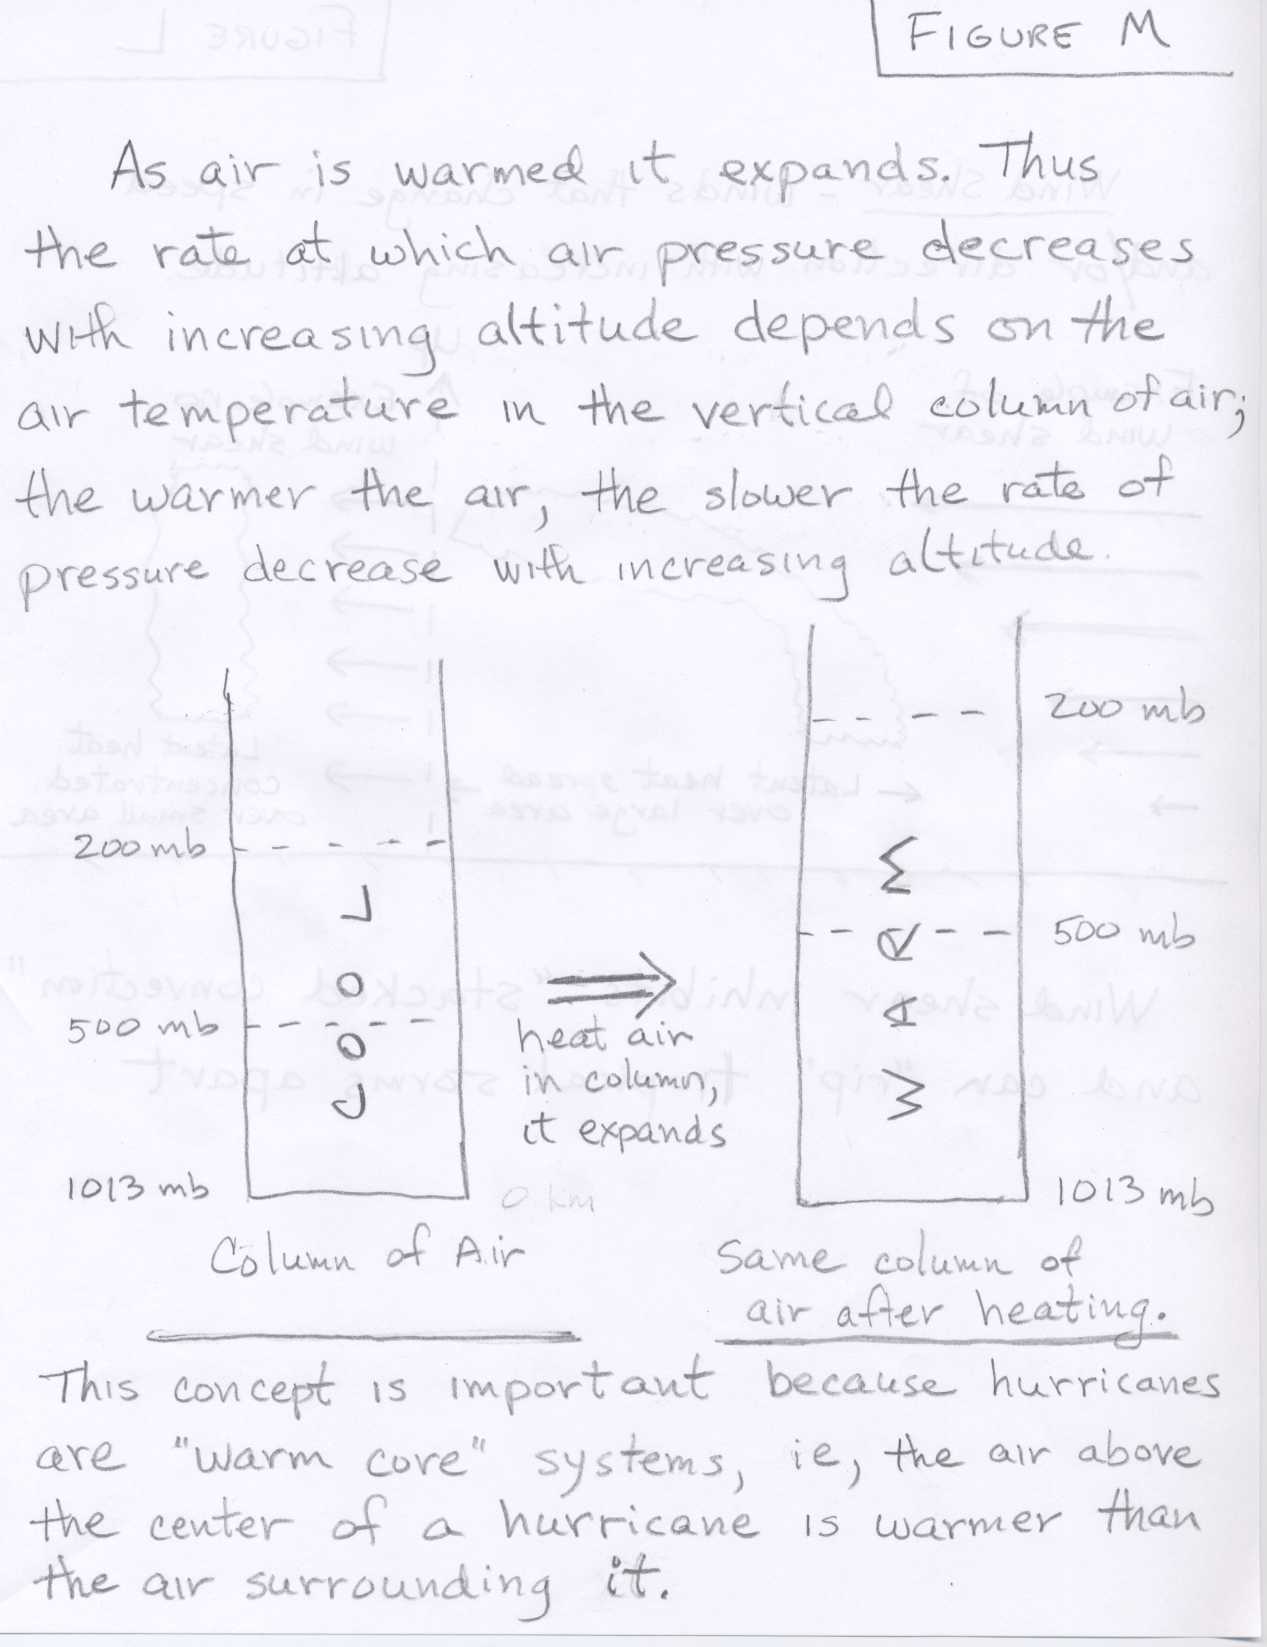
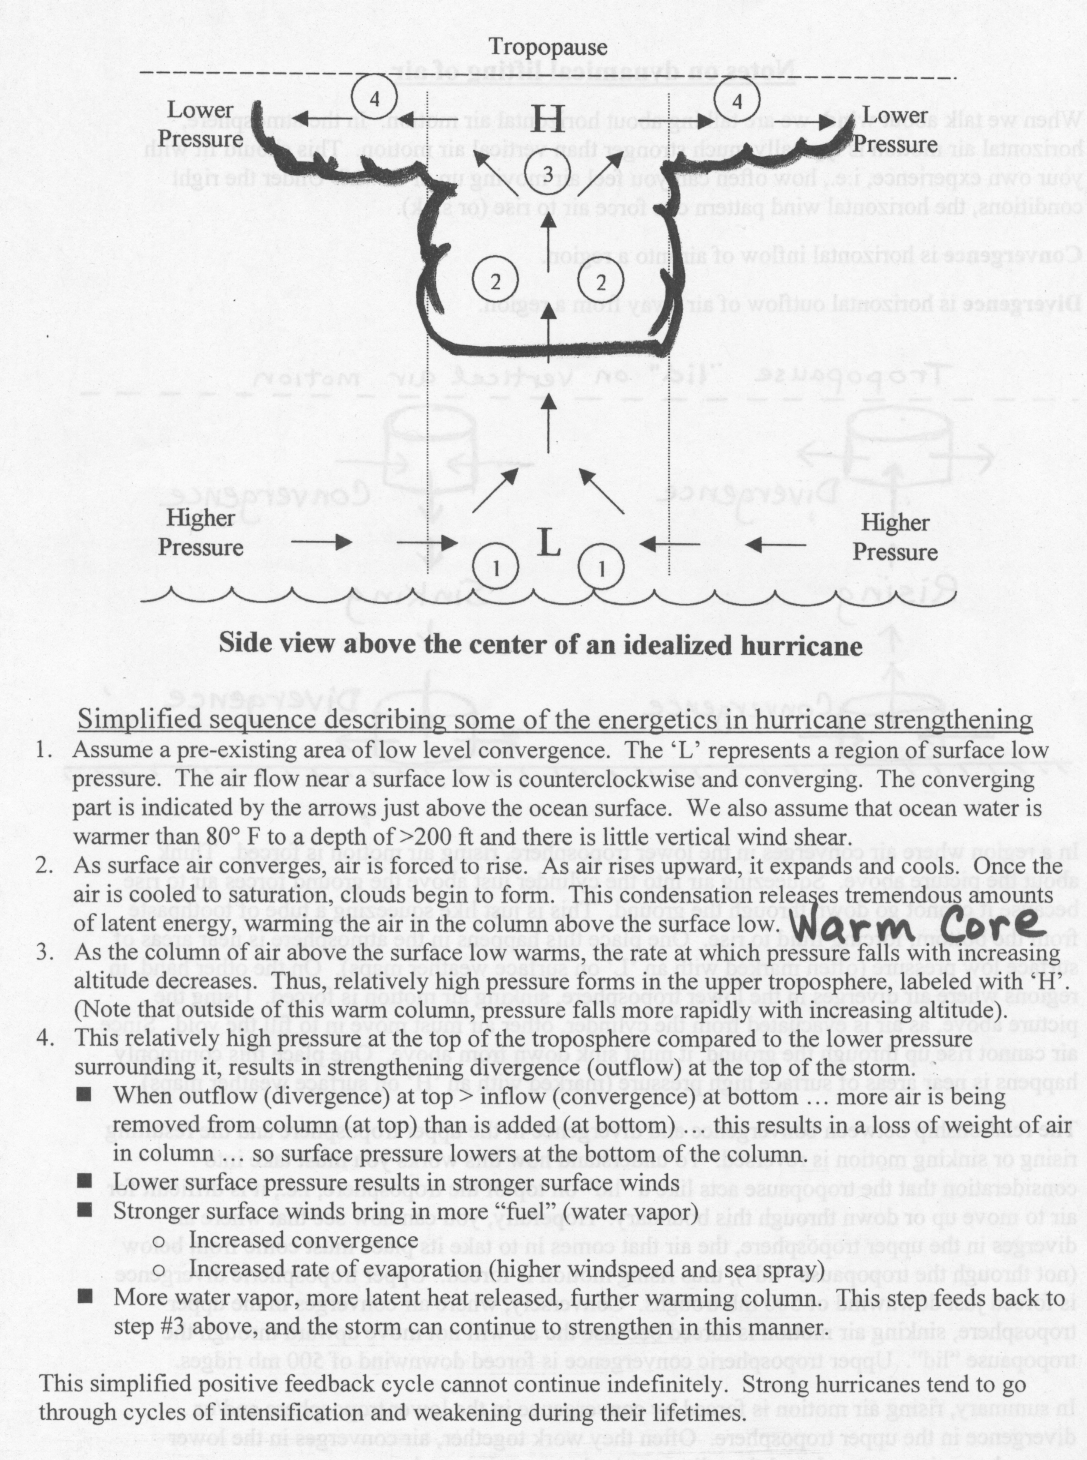
I will explain to you how tropical cyclones intensify to become hurricanes using a simple process diagram. When conditions are just right, tropical storms intensify via a positive feedback loop. Before looking at the process diagram, there are a couple of pieces of background material to review. One concerns the relationship between horizontal convergence and divergence of air flow and forced rising and sinking motion, which is described in this scanned version of dynamical forcing handout. Additionally, let's review the relationship between the air temperature in a vertical column of air the rate of pressure decrease with height in that column (See Figure M).
Finally, we should now have enough background knowledge to follow the Simplified sequence describing the energetics of hurricane strengthening via a positive feedback loop.
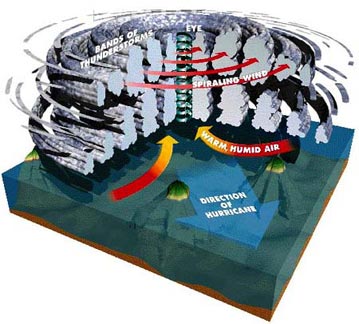
The figure below shows a more realistic look at anatomy of a hurricane. As opposed to the simple explanation for intensification which only showed a central updraft, real hurricanes have banded structures of rising and sinking motion.
 |
Follow the link below to a site where you can create your own hurricane and graphically see the influence of water temperature, windshear, and humidity on hurricane formation. After clicking the link, select "Hurricane Maker".
![]()
![]()
![]()
![]()