The concentration of lead in air
has decreased
significantly since lead was removed from gasoline (the
following quote is from
a
Wikipedia
article
on
gasoline: "In the US,standards to phase out
leaded gasoline were first implemented in 1973 ..... In 1995, leaded
fuel accounted for only 0.6% of total gasoline sales ...... From 1
January 1996, the
Clean Air Act banned the sale of leaded fuel
for use in on-road vehicles. Possession and use of leaded gasoline in a
regular on-road vehicle now carries a maximum $10,000 fine in the US."
)
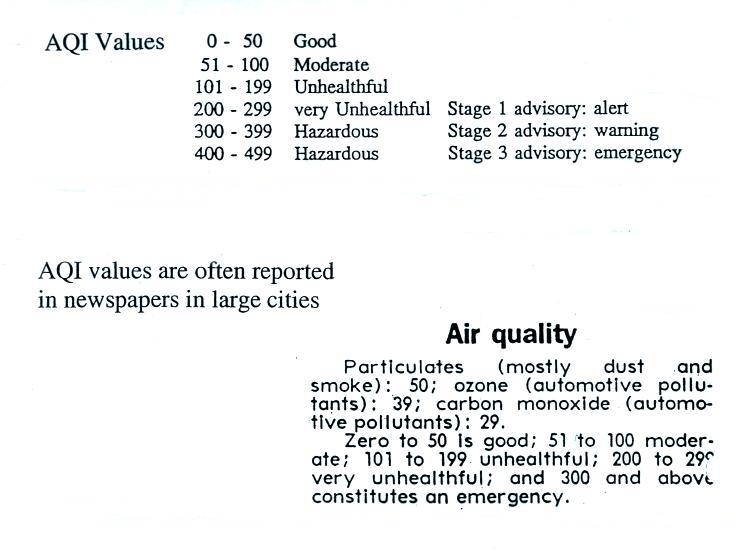
In Tucson,
carbon monoxide, ozone, and particulate matter are of primary concern
and daily measurements are reported in the city newspaper. Let
suppose a CO concentration of 4.5 ppm (8 hour average) was measured
yesterday in Tucson. Would this be an acceptable or hazardous
value? Most people wouldn't be able to answer that
question. So rather
than report the actual measured values, an Air Quality Index value is
reported instead. The AQI is the ratio of the
measured to accepted
concentrations multiplied by 100%.