This
seemed like a good place to briefly discuss supercell thunderstorms
(see p. 163 in the ClassNotes)
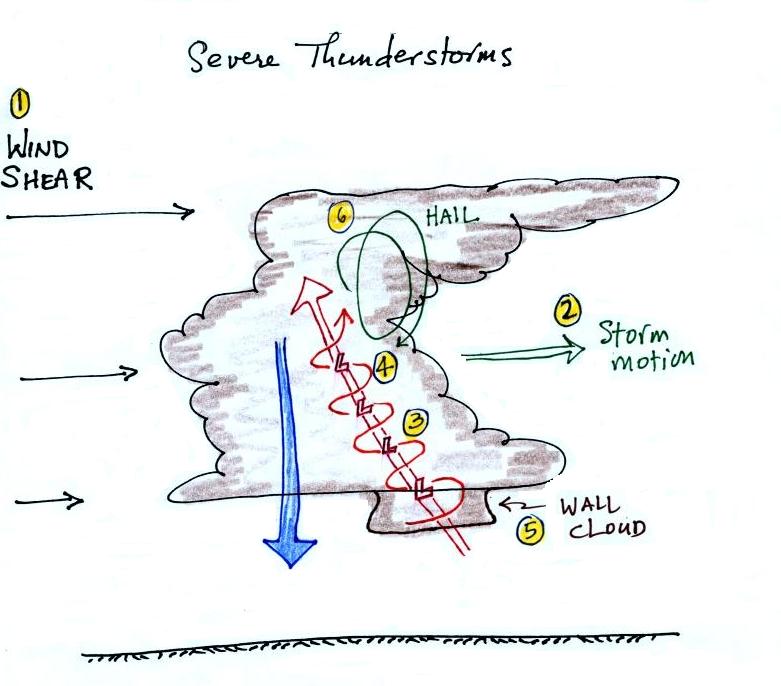
Here is a
relatively simple
drawing showing some of the key features on a supercell
thunderstorm. In a supercell the
rotating
updraft (shown in red above) is strong enough to penetrate a little
ways into the
stratosphere. This produces the overshooting top or dome feature
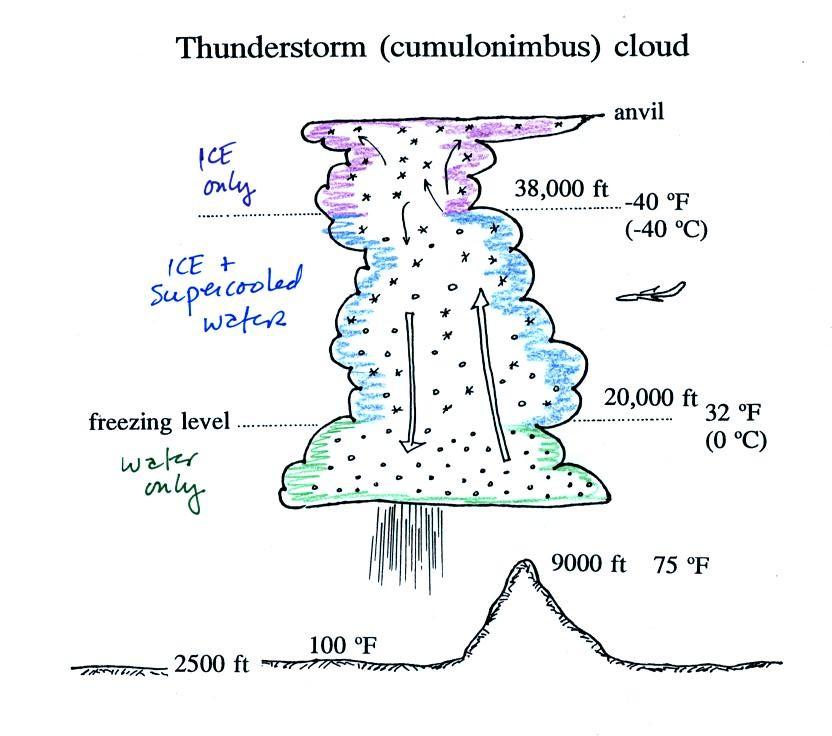
above. A wall cloud and a tornado are shown at the bottom of the mesocyclone. In an ordinary thunderstorm
the updraft
is unable to penetrate into the very stable air in the stratosphere and
the
upward moving air just flattens out and forms an anvil. The
flanking line
is a line of new cells trying to form alongside the supercell
thunderstorm (similar to convergence between prexisting winds and
thunderstorm downdraft winds that can lead to new storm development
alongside a dissipating air mass thunderstorm).
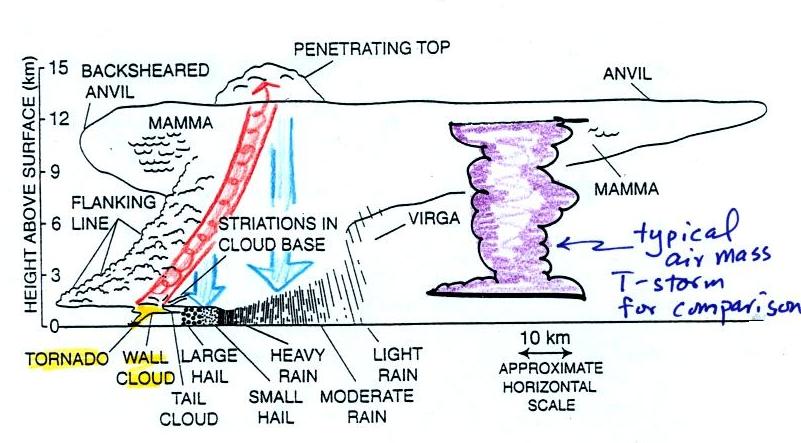
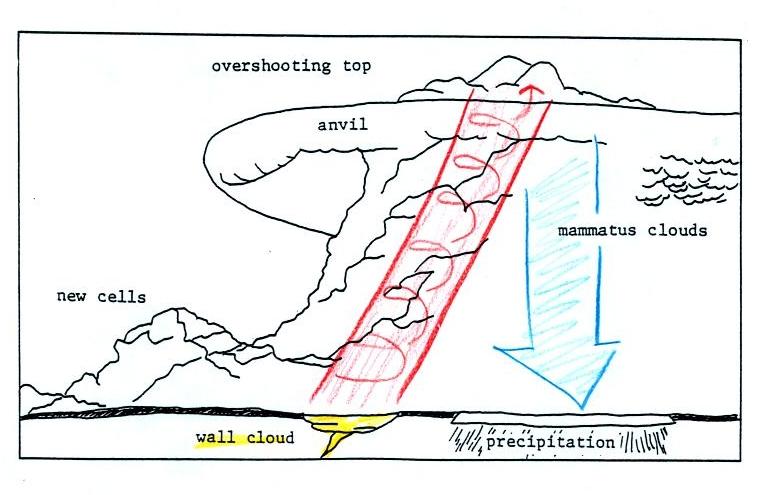
Here
is a second slightly more complicated drawing of a supercell
thunderstorm. A typical air mass thunderstorm (purple) has been
drawn in so that you can appreciated how much larger supercell
thunderstorms can be.
Thunderstorms
with rotating updrafts and supercell thunderstorms often have a
distinctive radar signature called
a hook echo.
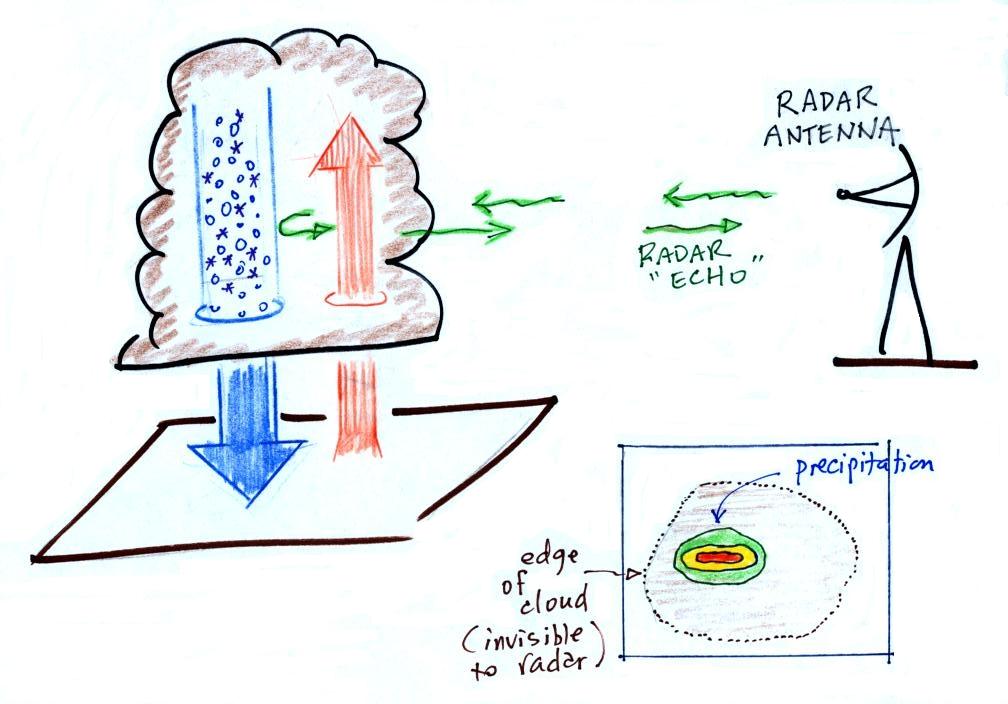
We haven't
discussed weather radar
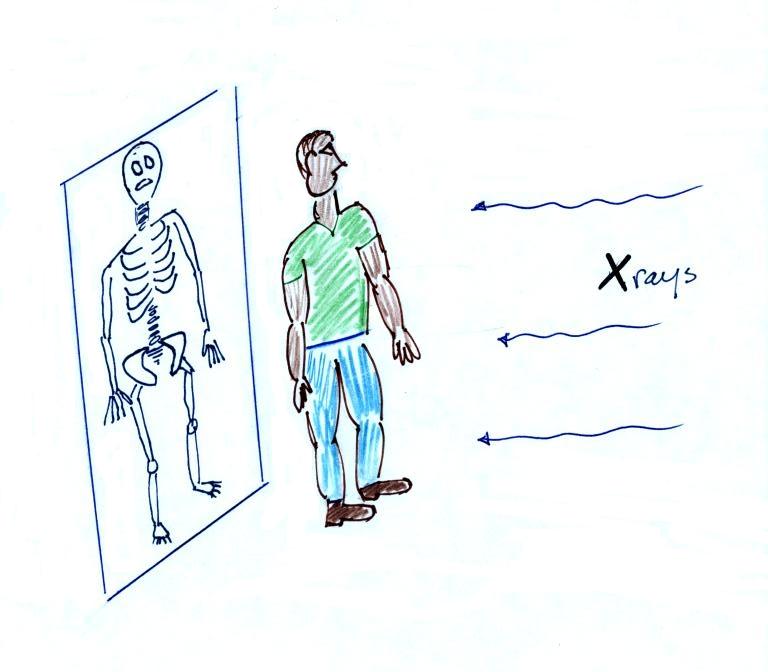
in this class yet. In some ways a radar image of a thunderstorm
is
like an
X-ray photograph of a human body. The Xrays
pass through the flesh but are partially absorbed by bone.
Xrays pass through tissue but get
absorbed by bone.
They reveal the skeletonal structure inside a body. In some
respects radar is similar.
The
radio signals
emitted by radar
pass through the cloud itself but are reflected by the much larger
precipitation particles. The intensity of the reflected signal
(the echo) is color coded. Red means an intense reflected signal
and lots of large precipitation particles. The edge of the cloud
isn't normally seen on the radar signal.
Here is an actual radar image
with a prominent
hook echo. The hook is evidence of large scale rotation inside a
thunderstorm and means the thunderstorm is capable of, and may already
be, producing tornadoes.
This is
the radar image of a thunderstorm that produced a very strong tornado
that hit Oklahoma
City in May
1999
. The hook echo is visible near the lower left hand
corner of the picture. Winds in the tornado may have
exceeded 300 MPH. You can read more about this tornado here.
And
here
is
some
storm
chase
video of the tornado.
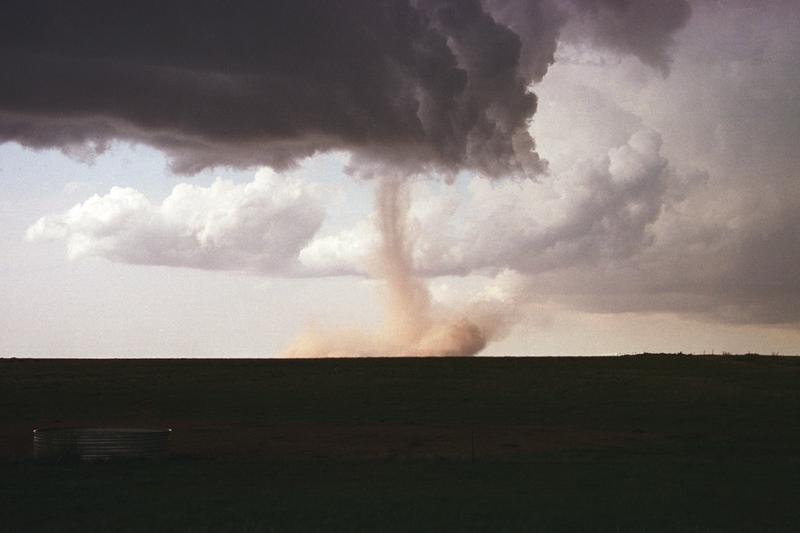
A short segment
of video was shown at this point. It showed a distant supercell
thunderstorm and photographs of the bases of nearby
supercell thunderstorms. Here you could see the spectacular wall
cloud that often forms at the base of these storms. Finally a
computer simluation showed some of the complex motions that form inside
supercell thunderstorms, particularly the tilted rotating
updraft. I haven't been able to find the video online.
Tornado season this spring has already been
particularly
destructive and deadly. Next we'll look at some of the
kinds of damage tornadoes can do and we'll introduce the Fujita Scale
used to rate tornado strength or
intensity.
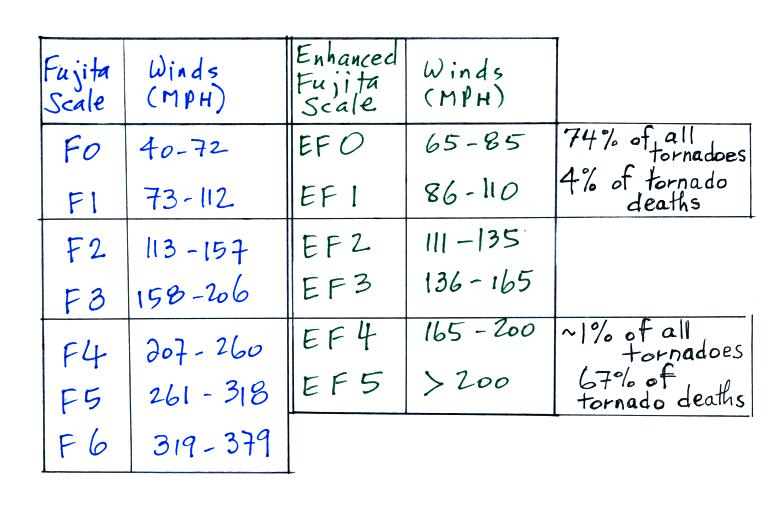
It is very hard to actually measure the speed of the
rotating winds in a tornado. Researchers usually survey the
damage caused by the tornado and assign a Fujita Scale
rating. The original scale, introduced in 1971, has recently been
revised because the estimated wind speeds were probably too high.
The
newer scale is called the Enhanced
Fujita Scale and became operational in 2007. The chart below
compares the two scales.
The original Fujita Scale actually goes up to F12. An
F12
tornado would have winds of about 740 MPH, the speed of sound.
Roughly 3/4 of all tornadoes are EF0 or EF1 tornadoes and have winds
that are less than 100 MPH. EF4 and EF5 tornadoes are rare but
cause the majority of tornado deaths.
The EF scale considers 28 different "damage indicators,"
that is,
types
of structures or vegetation that could be damaged by a tornado.
Examples include:
Damage Indicator
|
Description
|
2
|
1 or 2 family residential
home
|
3
|
Mobile home (single wide)
|
10
|
Strip mall
|
13
|
Automobile showroom
|
22
|
Service station canopy
|
26
|
Free standing light pole
|
27
|
Tree (softwood)
|
Then for each indicator is a standardized list of "degrees
of
damage"
that an investigator can look at to estimate the intensity of the
tornado. For a 1 or 2 family home for
example
degree
of damage
|
description
|
approximate
wind speed (MPH)
|
1
|
visible damage
|
65
|
2
|
loss of roof covering
material
|
80
|
3
|
broken glass in doors &
windows
|
95
|
4
|
lifting of roof deck, loss
of more than 20% of roof material, collapse of chimney, garage doors
collapse inward, destruction of porch roof or carport
|
100
|
5
|
house slides off foundation
|
120
|
6
|
large sections of roof
removed, most walls still standing
|
120
|
7
|
exterior walls collapse
(top story)
|
130
|
8
|
most interior walls
collapse (top story)
|
150
|
9
|
most walls in bottom floor
collapse except small interior rooms
|
150
|
10
|
total destruction of entire
building
|
170
|
You'll find the entire set of damage indicators and lists of
degrees of damage here.
Here's some recent
video of damage being caused by a tornado as it happened (caught on
surveillance video). The tornado struck West Liberty, Kentucky on
March 2 this year.
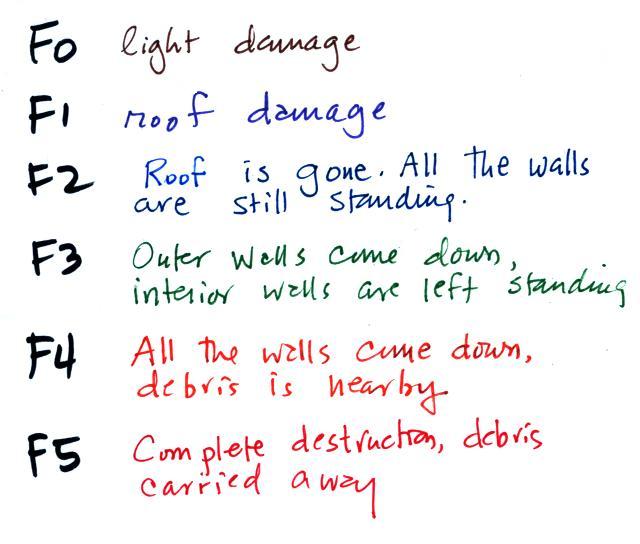
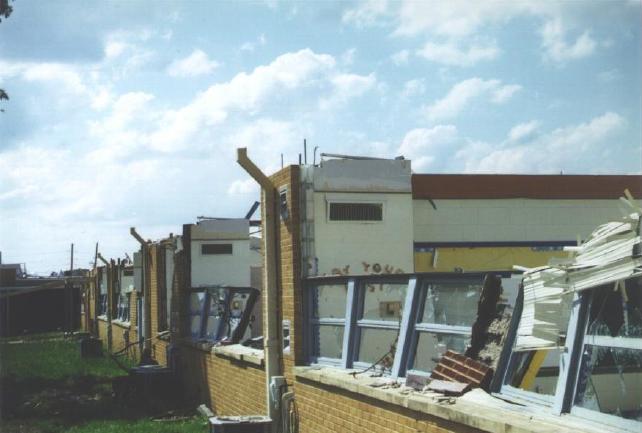
I like to keep a very basic damage scale in mind so that I
can estimate tornado intensity when I see video on the television news.
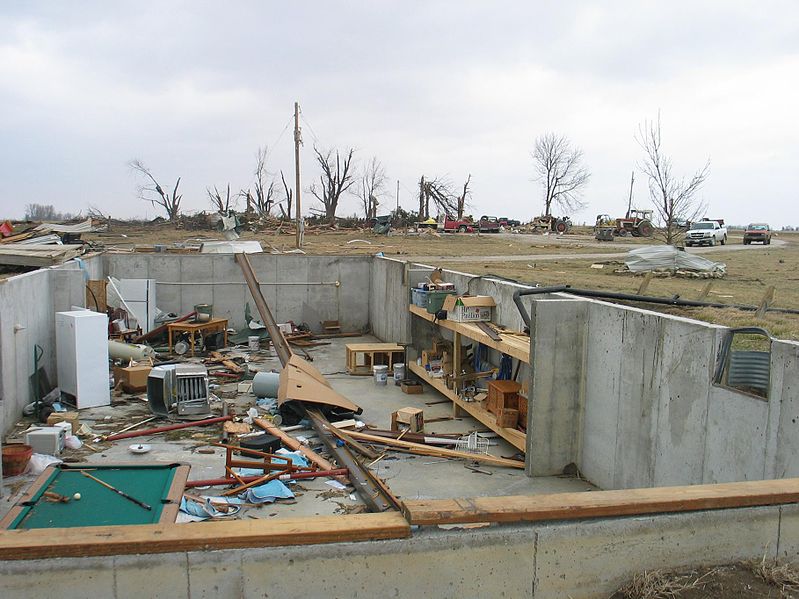
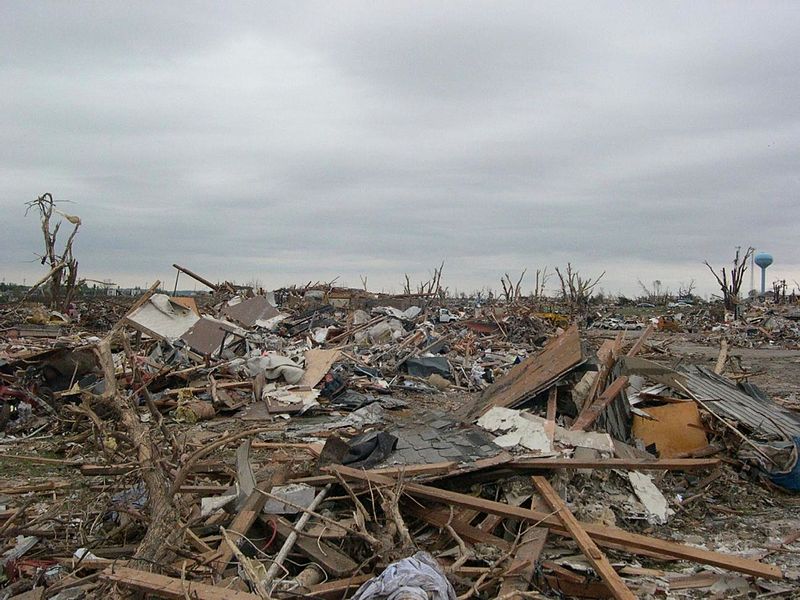
The photos above show examples of damage caused by EF2, EF4,
and EF5
tornadoes.
EF2 Damage
roof is gone, but all walls still standing
|
EF4 Damage
only the strong reinforced concrete basement walls are
left standing. It doesn't look like there would have been
anywhere in this building that would have provided protection
from a tornado this strong.
|
EF5 Damage
complete destruction of the structure
|
|
|
|
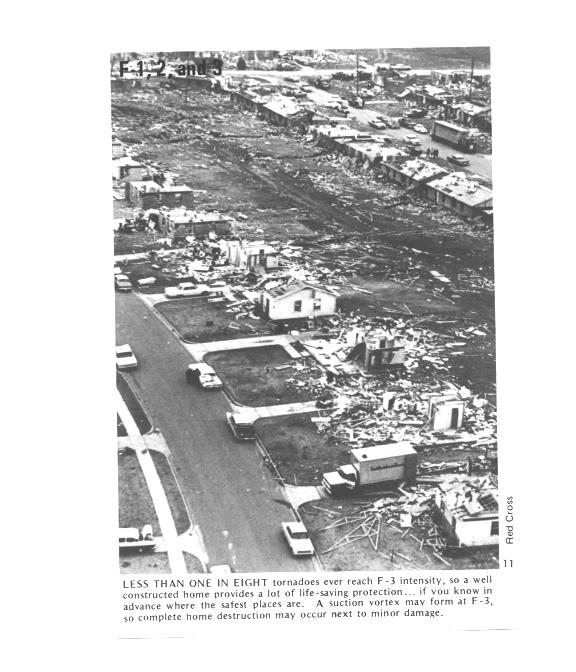
Here
are some additional, older, photographs of typical damage associated
with all the levels on the Fujita Scale.
Several levels of
damage (EF1 to about EF3)
are visible in the
photograph
above. It
was
puzzling initially how some homes could be nearly destroyed while a
home nearby or in between was left with only light damage. One
possible explanation is shown below.
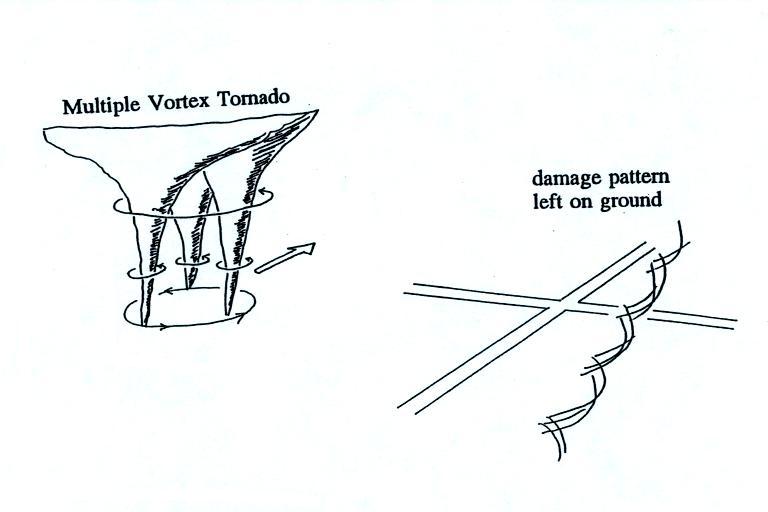
Some
big
strong
tornadoes
may
have
smaller
more
intense
"suction
vortices"
that
spin
around
the center of the tornado (they would be hard to see because of all the
dust in the tornado cloud. Tornado
researchers have actually seen the pattern shown at right
scratched into the ground by the multiple vortices in a strong tornado.
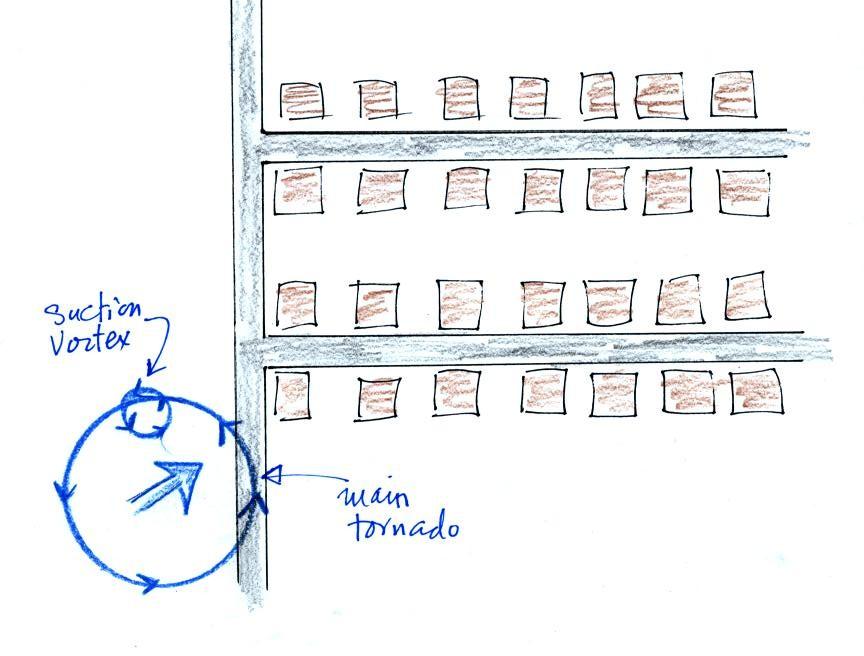
The
sketch above shows a tornado located SW of a neighborhood.
As
the
tornado
sweeps
through
the
neighborhood,
the
suction
vortex
will
rotate
around
the
core
of
the
tornado.
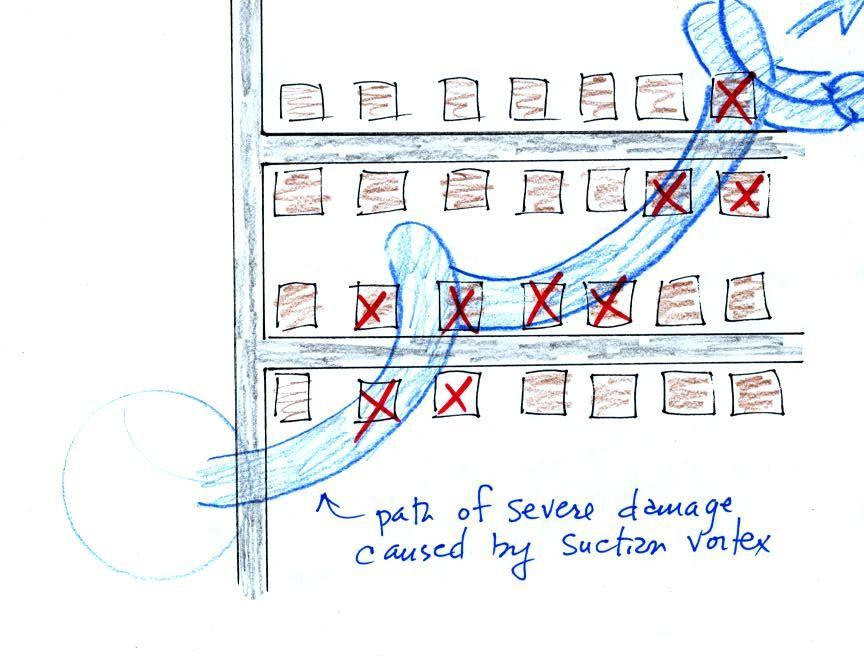
The
homes
marked
in
red
would
be
damaged severely. The others
would receive less damage. Remember that there are multiple
suction vortices in the tornado, but the tornado diameter is probably
larger than shown here.
At
this
point we watched the last of the tornado video tapes. It
showed a tornado that occurred in Pampa, Texas (here are a couple of
videos that I found on YouTube: video 1, video 2, they're
missing the commentary that was on the video shown in class).
Near the end of
the segment, video photography showed several vehicles (pick up trucks
and a van) that had been lifted 100 feet or so off the ground and were
being thrown around at 80 or 90 MPH by the tornado
winds. Winds speeds of about 250 MPH were estimated from the
video photography (the wind speeds were measured above the ground and
might not have extended all the way to the ground).
Lightning
kills just under 100 people every year in the United
States (more than tornadoes or hurricanes but less than flooding,
summer heat and winter cold) and is the cause of about 30% of all power
outages. In
the western United States, lightning starts about half of all forest
fires. Lightning
caused
fires
are
a
particular
problem
at
the
beginning
of
the thunderstorm season in Arizona. At
this time the
air underneath thunderstorms is still relatively dry. Rain
falling from a thunderstorm will often evaporate before reaching the
ground. Lightning then strikes dry ground, starts a fire, and
there isn't any rain to put out or at least slow the spread of the
fire. This is so called dry lightning.
Lighning is most commonly produced by thunderstorms (it has
also
be observed in dust storms and volcanic eruptions such as the 2010
eruption of Eyjafjallajokull
in
Iceland).