Tuesday Jan 22, 2008
As promised, experiment report signup sheets were passed
around
in class. The sheets will be back on Thursday if you didn't get a
chance to signup today. The experiment #1 materials were also
distributed. If you checked out some materials in class
your name should be on this list.
You can also click here to learn more
about Expt. #1.
Last Thursday, students were given the opportunity to decide which
of four topics
should be covered first in NATS 101 this semester. Here are the
somewhat surprising results of the survey (I would have predicted CO2
& climate change or surface weather maps would have been the first
choice).
air
pollutants
|
50%
|
CO2
&
climate
change
|
39%
|
pressure
|
8%
|
surface
weather maps
|
3%
|
Now that we know which topic we will be covering first, here is a
new reading assignment
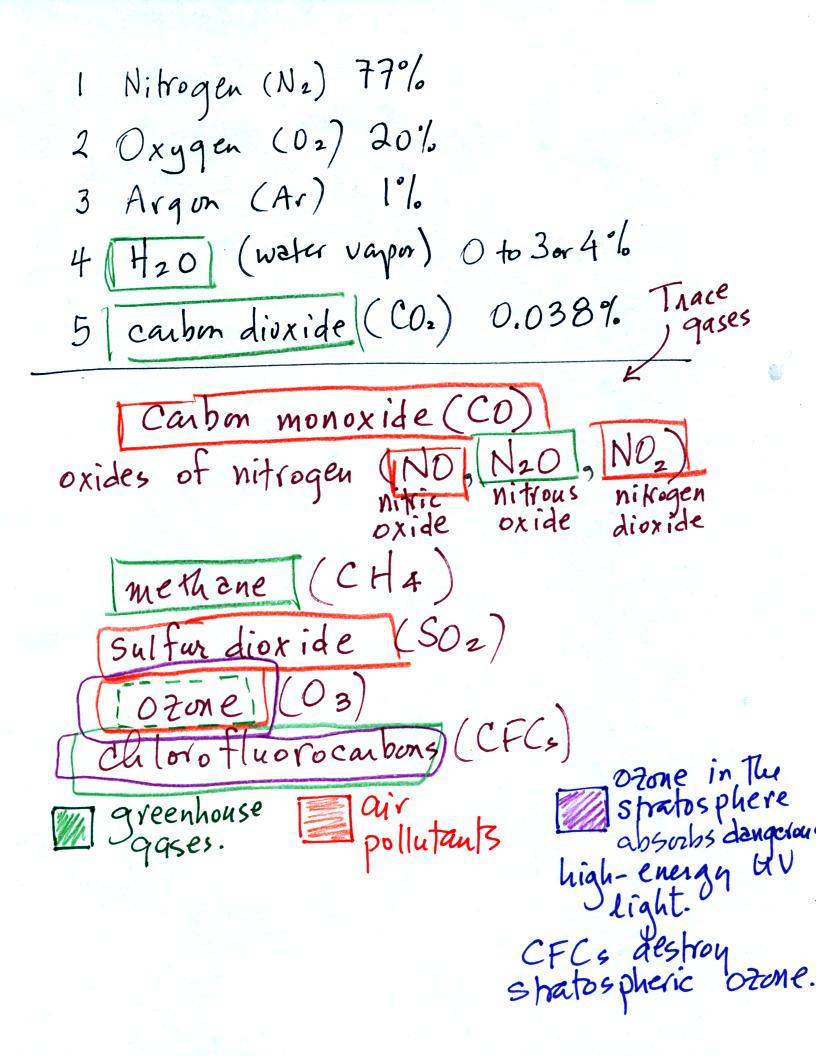
We listed
the 5 most abundant gases in the atmosphere in class on
Wednesday. Several more important trace gases were added to the
list in
class today. Trace gases are gases found in low
concentrations. Low concentrations doesn't mean they aren't
important.
The air the past few days in Tucson has been a little colder
than average and also very
dry. Dewpoint temperatures have been in the teens and single
digits. There is very little water vapor in the air in Tucson at
the present time, that is why it was put in 4th place on the list.
Water vapor, carbon dioxide, methane, nitrous oxide (N2O
=
laughing gas),
chlorofluorocarbons, and ozone are all greenhouse gases.
Increasing atmospheric concentrations of these gases are responsible
for the current concern over climate change and global warming.
We'll
discuss this topic more next week and learn more about how the
greenhouse effect actually works when we get to Chapter
2.
Carbon monoxide, nitric oxide, nitrogen dioxide, ozone, and sulfur
dioxide are some of the major air pollutants. We'll cover carbon
monoxide today and talk about sulfur dioxide and ozone next week.
Be careful with ozone:
(i) Ozone in the
stratosphere (a layer of the atmosphere between 10 and 50
km altitude) is beneficial because it absorbs dangerous high energy
ultraviolet
(UV) light coming from the sun. Without the protection of the
ozone layer, life as we know it would not exist on the surface of the
earth. Chlorofluorocarbons are of concern in the atmosphere
because they destroy stratospheric ozone.
(ii) In the
troposphere (the bottom 10 kilometers of the atmosphere) ozone is a
pollutant and is one of the main ingredients in photochemical smog.
Some basic
information about carbon monoxide is shown below (p. 7 in
the photocopied Class Notes). You'll find
additional information at the Pima
County Department of
Environmental Quality website and also at the US Environmental Protection Agency
website.
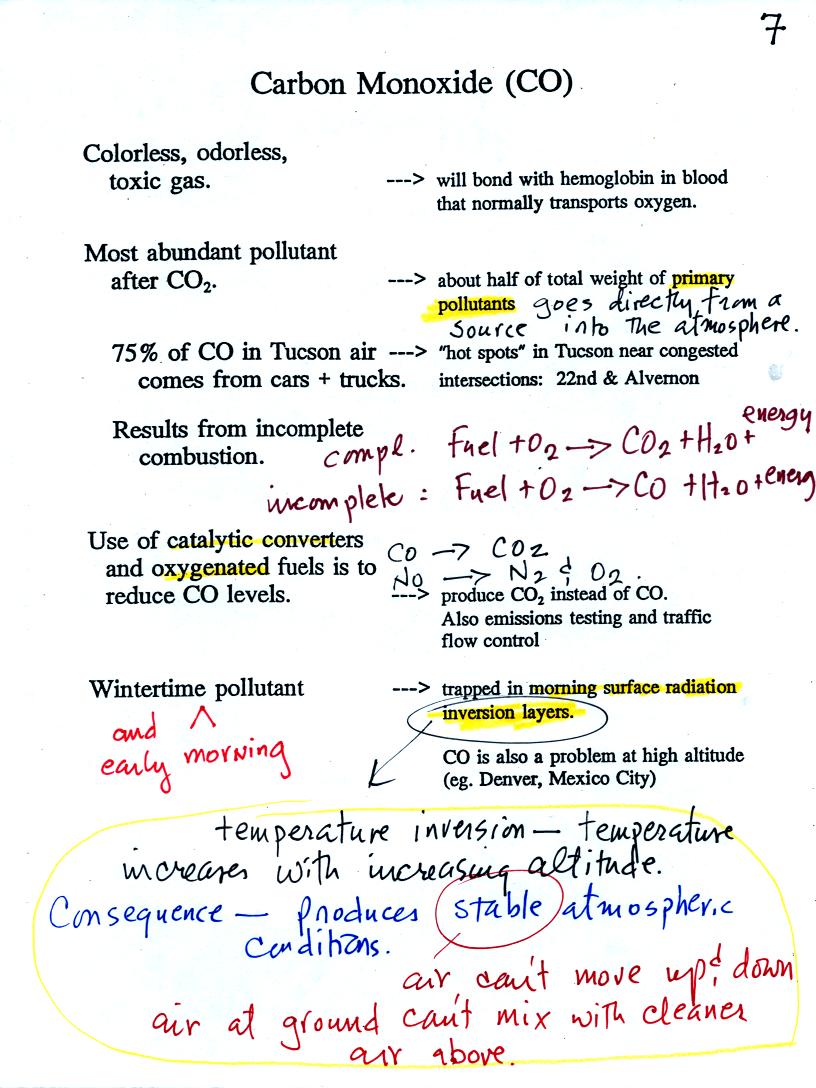
Once inhaled, carbon monoxide molecules bond strongly
to the hemoglobin
molecules in
blood and interferes with the transport of oxygen throughout your
body.
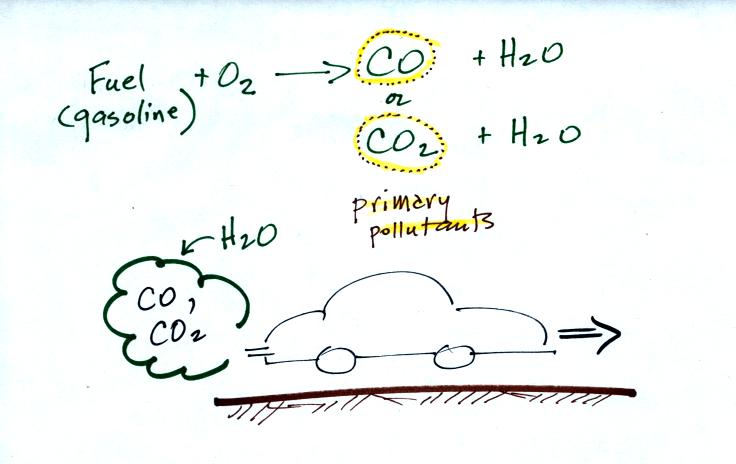
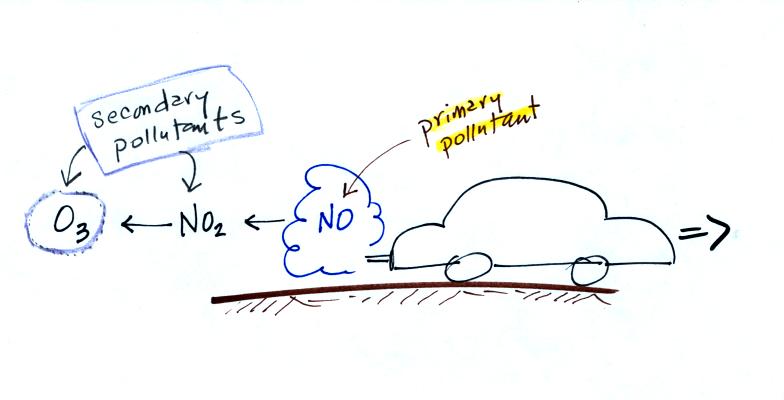
CO is a primary pollutant. That means it goes
directly from a source into the air, CO is
emitted directly from an automobile tailpipe into the atmosphere for
example. This is illustrated in the
figure below.
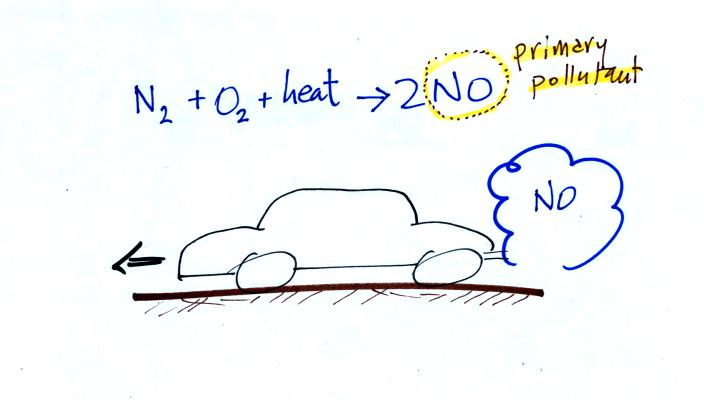
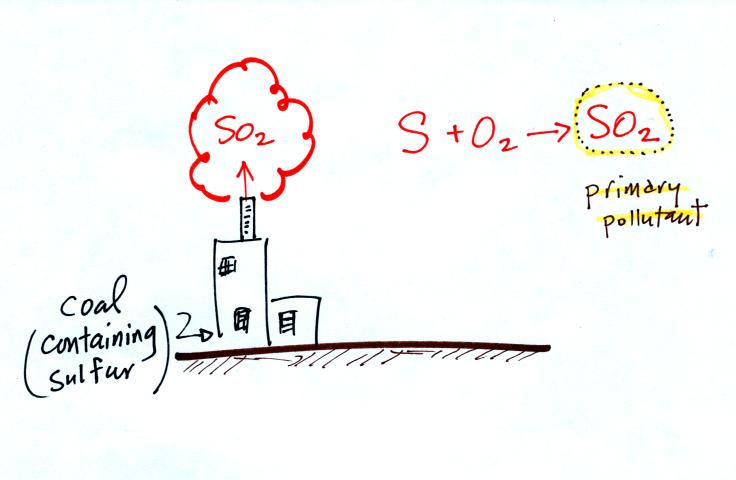
Nitric oxide, NO, and sulfur
dioxide, SO2, are also primary pollutants. Ozone is a
secondary pollutant. It shows up in the atmosphere only after a
primary pollutant has undergone a series of reactions.
CO is produced by incomplete combustion of fossil
fuel (insufficient oxygen). Complete combustion would produce
carbon dioxide,
CO2. Cars and trucks produce much of the CO in
the
atmosphere. Vehicles must now be fitted with a catalytic
converter that will change CO into CO2 (and also NO into N2
and
O2). In Pima County vehicles must also pass an
emissions
test every
year and special formulations of gasoline (oxygenated fuels) are used
during the winter months to try to reduce CO emissions.
In the atmosphere CO concentrations peak on winter
mornings.
Surface temperature inversion layers form on long winter nights when
the sky is clear and winds are calm. The ground cools quickly and
becomes colder than the air above. Air in contact with the
cold ground ends up colder than air above. Air
temperature increases with increasing altitude in a temperature
inversion and this produces a very stable layer of air at ground
level. A typical wintertime temperature profile in Tucson is
shown at the top of p. 9 in the photocopied Classnotes.
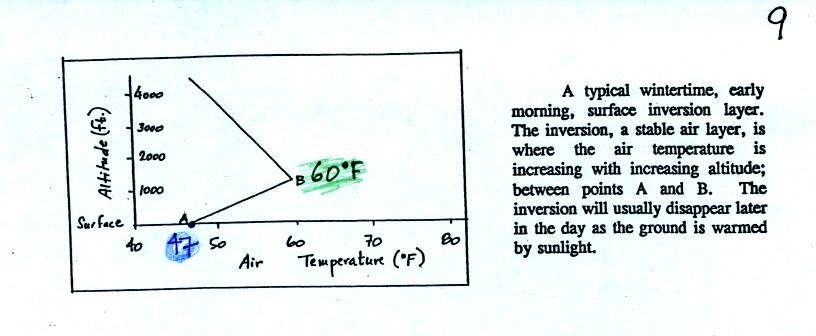
The inversion extends from Point A at the ground to Point B
about 1000
feet above the ground. Temperature increases from 47o
F at the
ground to about 60o F at 1000 feet altitude.
There is very little vertical mixing in a stable air
layer.
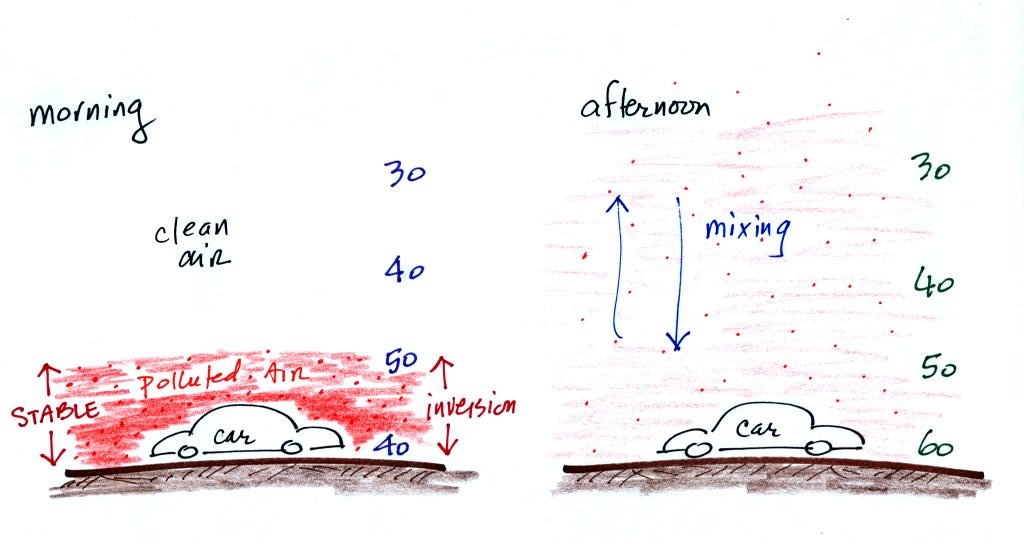
When CO is emitted into a thin stable layer (left
figure
above), the CO
remains in the layer and doesn't mix with cleaner air above. CO
concentrations build.
In the afternoon, the ground warms, and the atmosphere becomes more
unstable. CO emitted
into air at the surface mixes with cleaner air above. The CO
concentrations are effectively diluted.
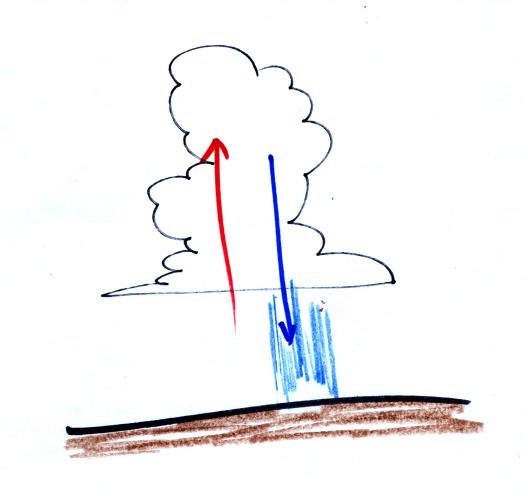
Thunderstorms occur when the atmosphere is unstable. Strong
up
and down air motions are found in thunderstorms.
The
downdraft can sometimes produce damaging, surface winds.
Six main air pollutants are listed at the top of this page.
Concentrations of some or all of these pollutants are monitored daily
in
many
cities. The atmospheric concentration of lead has decreased
significantly since the introduction of unleaded gasoline. PM
stands for particulate matter. These small particles are
invisible, remain suspended in the air, and may be made of harmful
materials.
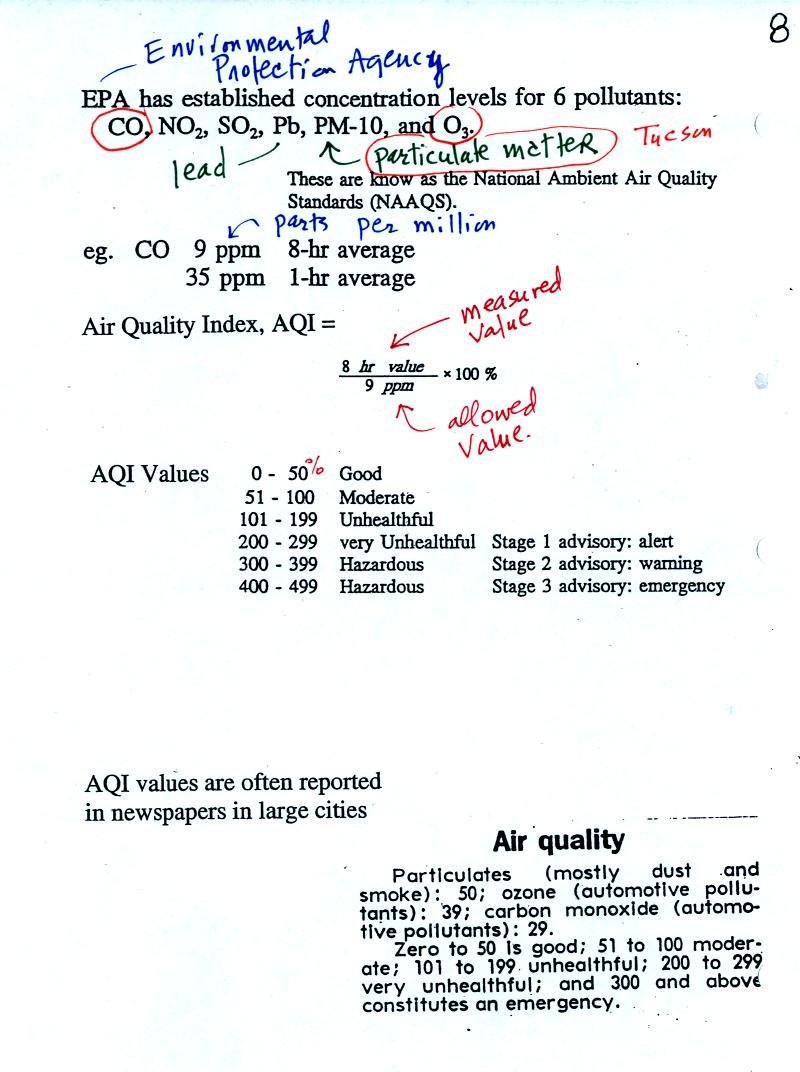
CO, O3 and particulate matter are the pollutants of most
concern in
Tucson and pollutant concentrations are reported in the newspaper or on
television using the Air Quality Index (formerly the pollutant
standards index). This is basically the measured value divided by
the allowed value multiplied by 100%. For carbon monoxide
concentrations up to 35 ppm (parts per million) for a 1 hour period and
9 ppm for an 8 hour period are allowed. Current Air Quality Index values for
Tucson are available online.
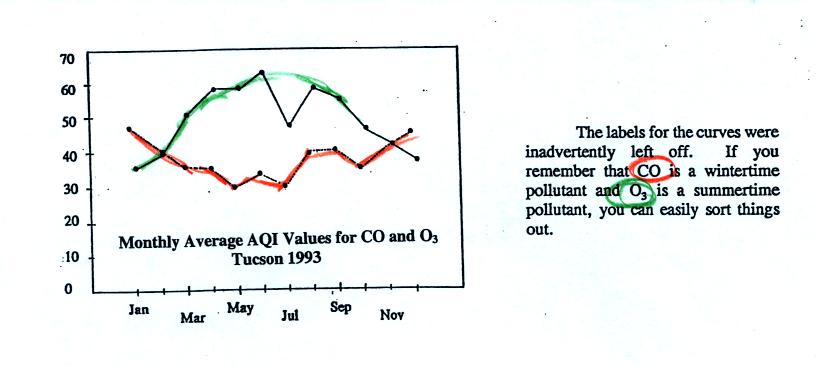
Yearly changes in the AQI values for ozone and carbon monoxide in 1993
are plotted at the bottom of p.9 in the photocopied Classnotes.
So are we
have been talking about carbon monoxide found in
the atmosphere. Carbon monoxide is also a serious
hazard indoors where is can build to much higher levels than would ever
be found outdoors. You may remember having heard
about an incident earlier near the beginning of the school year last
August. Carbon
monoxide
from a malfunctioning hot water heater sickened 23 Virginia Tech
students in an apartment complex. The CO concentration is
thought to have reached 400 ppm. You can get an idea of what
kinds of health effects concentrations this high could cause from the
figure below (from p. 9 in the photocopied Classnotes)
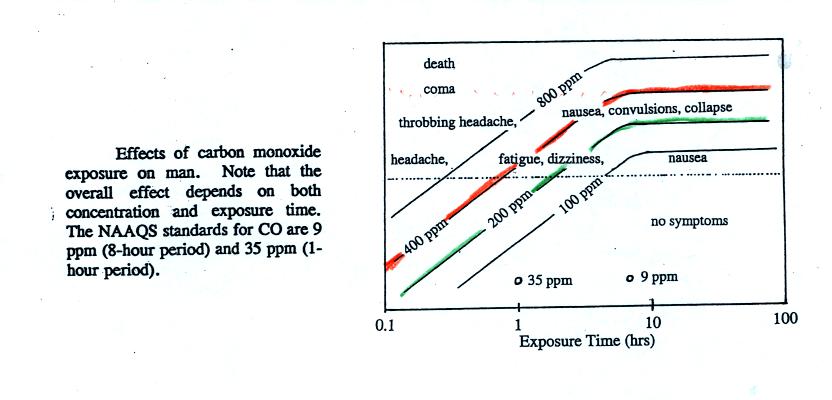
Follow the 400 ppm line (shaded orange) from left to
right. At
exposure times less than 1 hour you should experience no
symptoms. Beginning at 1 hour you might experience headache,
fatique, and dizziness. Exposures of a few hours will produce
throbbing headache, nausea, convulsions, and collapse. The 400
ppm trace level approaches the level where CO would cause coma and
death. At Virginia Tech several students were found unconscious
and one or two had stopped breathing.
Carbon monoxide
alarms are relatively inexpensive and readily available at any hardware
store. They will monitor CO concentrations indoors and warn you
when
concentrations reach hazardous levels. Indoors CO can
be
produced by gas furnaces and water heaters (and other things) that are
either operating improperly or aren't being adequately vented
outdoors. A few hundred people are killed indoors by carbon
monoxide every
year in the United States. You can learn
more about carbon monoxide hazards and risk prevention at the Consumer Product
Safety Commission web page.
The following figure
wasn't covered in
class
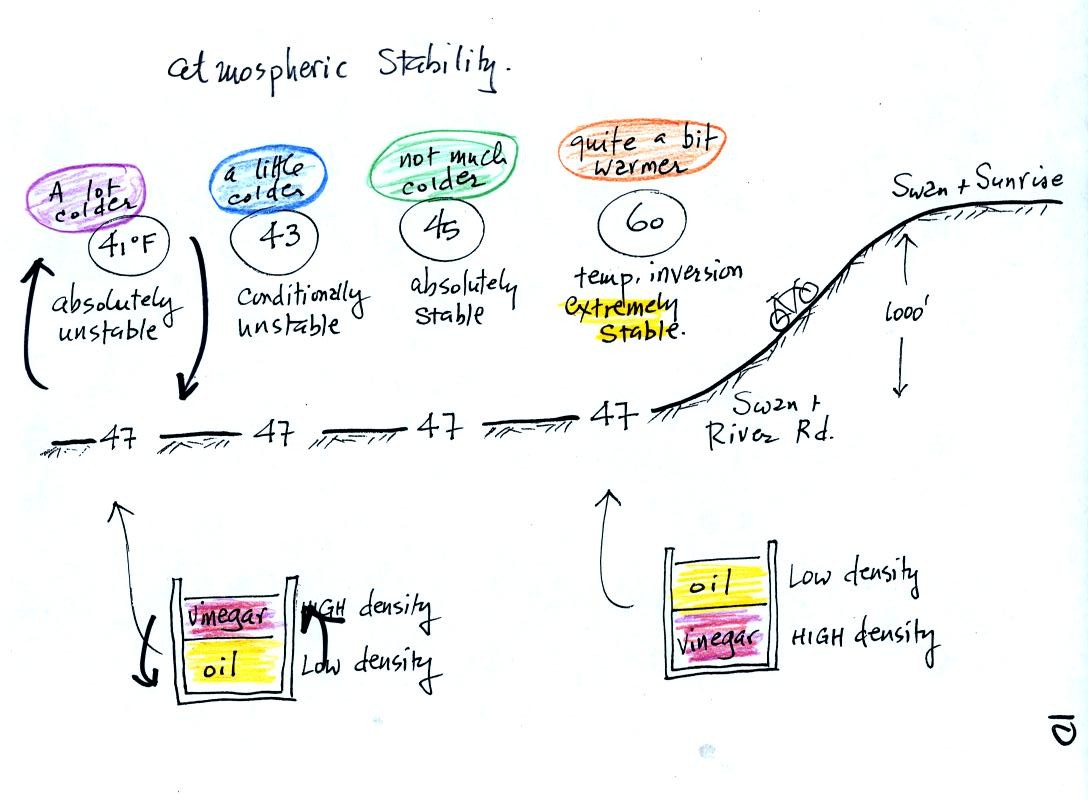
This rather
busy and confusing picture just illustrates how small changes in how
air temperature changes with increasing altitude can determine whether
the atmosphere will be stable or unstable. Just for the
purposes of illustration imagine riding a bicycle north from Swan and
River Rd up the hill to Swan and Sunrise (fhe figure shows an elevation
change of 1000 ft, it is actually quite a bit less than that)
At far left the air temperature goes from 47o F to 41o
F, a drop of 6o
F. This is a
fairly
rapid rate of decrease with increasing altitude and would make the
atmosphere
absolutely unstable. The atmosphere wouldn't remain this
way. Air at the ground would rise, air above would sink, and the
temperature profile would change. In some ways it would be like
trying to pour vinegar on top of oil in a glass. The lower
density oil would rise because it would "want" to float on top of the
higher density vinegar.
The next picture shows air temperature decreasing a little more slowly
with increasing altitude. This small change makes the atmosphere
conditionally unstable (we won't go into the conditions). The
atmosphere is frequently in this state.
The atmosphere cools only 2o F in the next picture.
This creates
an absolutely stable atmosphere. Air at the ground will remain at
the ground and won't rise and mix with air higher up. Compare
this with the glass containing vinegar and a layer of oil on top.
The two layers won't mix.
Air temperature in the last figure actually increases with increasing
altitude. This is a temperature inversion and is very common on
winter mornings. If you ever find yourself heading north on Swan
Rd. early in the morning you will pass through some pretty cold air as
you cross the Rillito River. By the time you get to Sunrise, the
air can be 10 degrees warmer and will seem balmy compared to the cold
air at the bottom of the hill. If you're up for a real challenge
continue north on Swan past Skyline. You'll find a short but very
steep section of road at the far north end of Swan.
Next we turned our attention to another of the main air pollutants -
ozone.
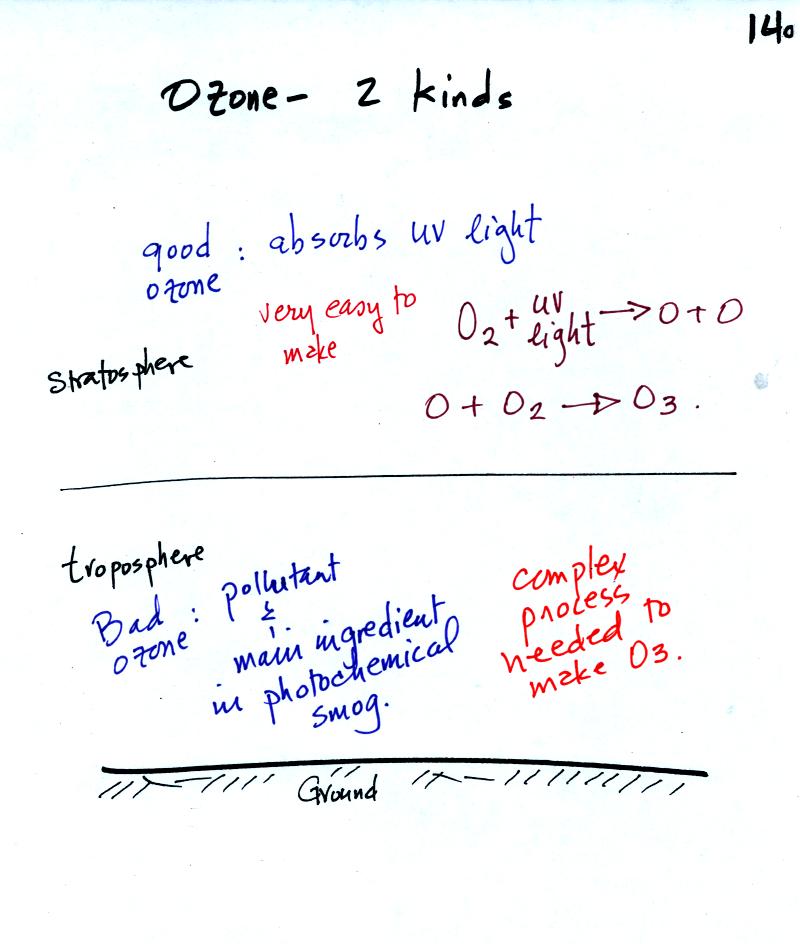
Ozone has a Dr. Jekyll and Mr. Hyde personality.
Ozone in the stratosphere is beneficial, it absorbs dangerous high
energy ultraviolet light (which would otherwise reach the ground and
cause skin cancer, cataracts, and many other problems).
Ozone in the troposphere is bad, it is a pollutant.
Tropospheric
ozone is also a key component of photochemical smog (also known as Los
Angeles-type smog)
We'll be making some photochemical smog as a
class
demonstration. This will require ozone (and a hydrocarbon of some
kind). We'll use the simple stratospheric recipe for making
ozone in the demonstration rather than the more complex tropospheric
process.
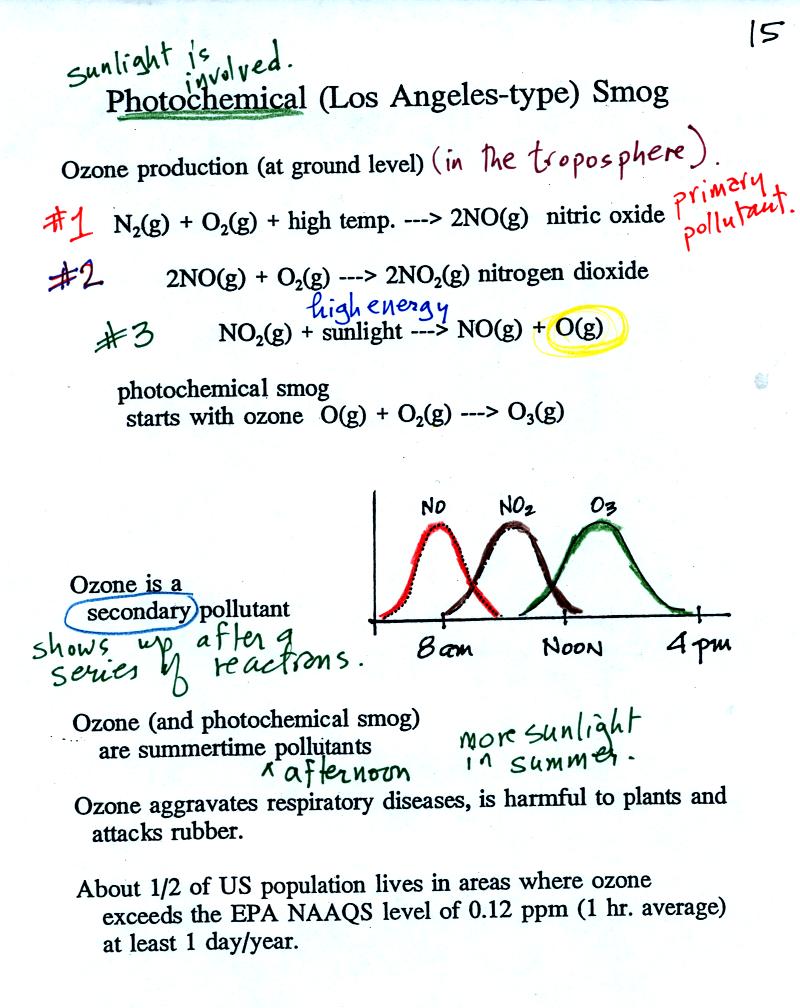
At the top of this figure you see that a more complex
series
of
reactions is responsible for the production of tropospheric
ozone. The production of tropospheric
ozone begins with nitric
oxide
(NO). NO is produced when nitrogen and oxygen are heated (in an
automobile engine for example) and react. The NO can then react
with oxygen to make nitrogen dioxide, a poisonous brown-colored
gas. Sunlight can dissociate (split) the nitrogen dioxide
molecule producing atomic oxygen (O) and NO. O and O2
react (just
as they do in the stratosphere) to make ozone (O3).
Because ozone
does not come directly from an automobile tailpipe or factory chimney,
but only shows up after a series of reactions, it is a secondary
pollutant. Nitric oxide would be the primary pollutant in
this example.
NO is produced early in the day (during the morning rush hour).
The concentration of NO2
peaks
somewhat later. Peak ozone concentrations are usually found in
the afternoon. Ozone concentrations are also usually higher in
the summer than in the winter. This is because sunlight plays a
role in ozone production and summer sunlight is more intense than
winter sunlight.
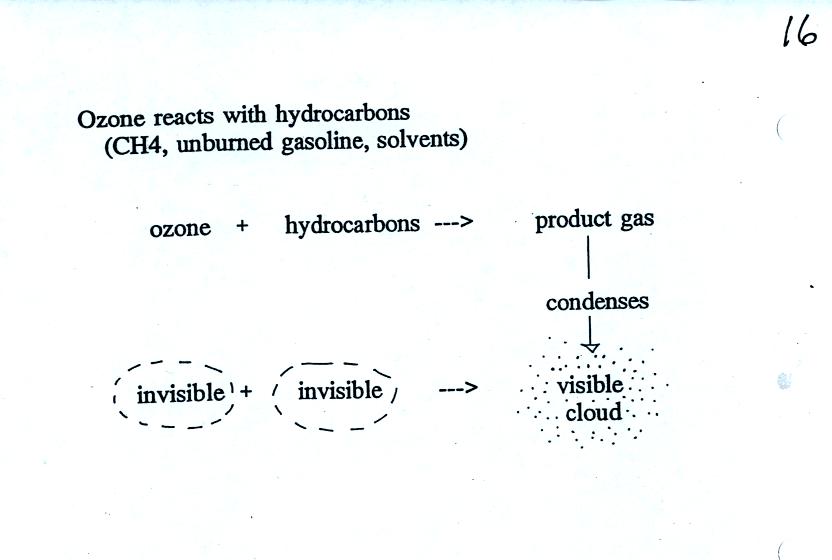
As shown in the figure below,
invisible ozone can react with a hydrocarbon of some kind which is also
invisible to make a
product
gas. This product gas sometimes condenses to make a visible smog
cloud or haze.
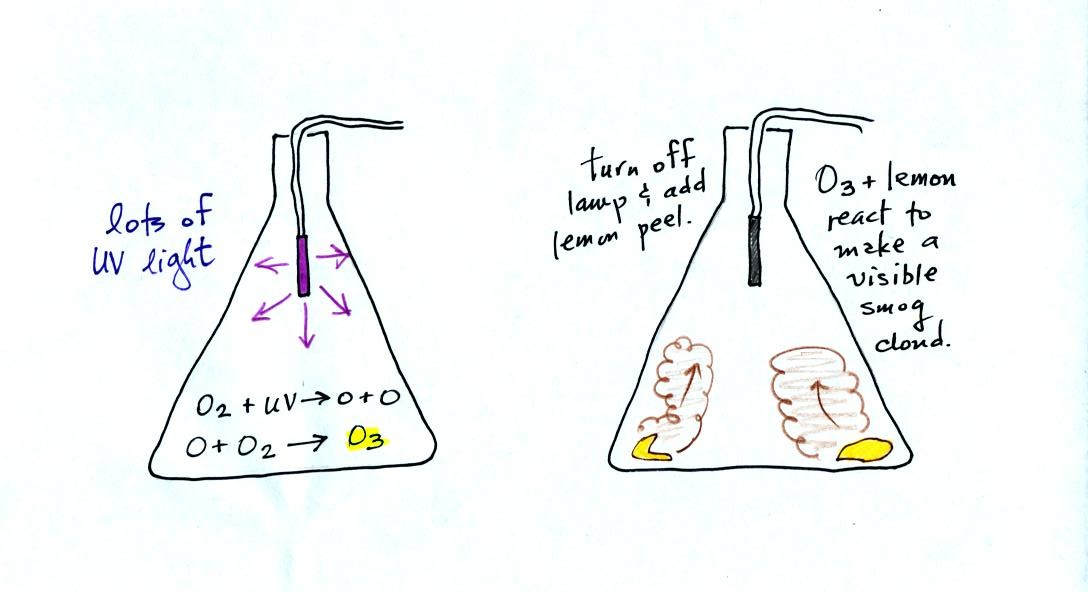
The class demonstration of photochemical smog is summarized
below (a flash was used instead of the aquarium shown on the bottom of
p. 16 in the photocopied class notes). We begin by using the UV
lamp to fill the flask with
ozone. Then a few pieces of fresh lemon peel were added to the
flask. A whitish cloud quickly became visible (colored brown in
the figure below).