Wed., Apr. 23, 2008
Today's "before class" music, J'ai ete au Zydeco, came from
Cajun country in SW Louisianna, from the Best of BeauSoleil
CD. Here are the words in
Cajun French and in English.
The Quiz #4 Study Guide is now
finished. Note that a very little bit of extra material was added
to the material that was on the preliminary version of the study guide.
Don't forget about the detailed hurricane summary, where
you'll find everything you need to know about hurricanes for next
week's quiz.
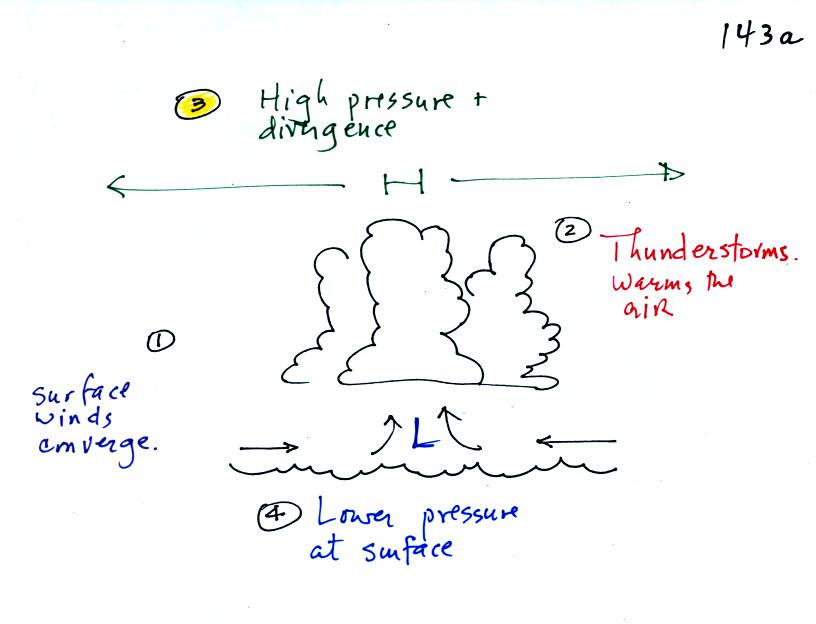
This is a summary of the steps leading up to hurricane formation.
First some sort of weather process will cause surface winds to converge
and form a cluster of thunderstorms.
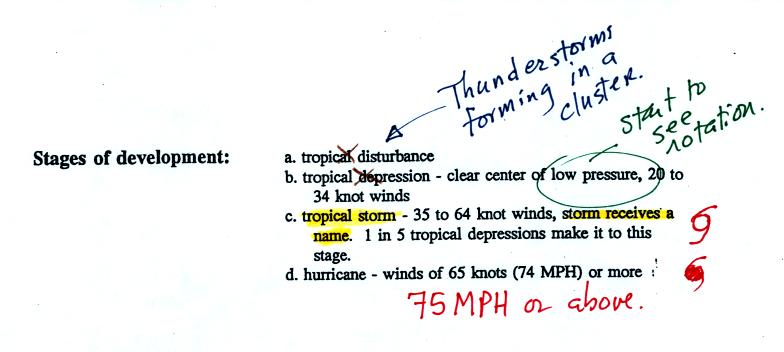
When meteorologist spots a cluster of thunderstorms on a satellite
photograph, a tropical
disturbance (see the list of stages of development below), they begin
to keep an eye
on it, as this might eventually develop into a tropical storm or a
hurricane.
Cloud formation warms the air. High pressure forms and winds
begin to diverge at the top of the hurricane. The diverging winds
lower the surface pressure at the bottom center of the storm.
Surface winds spiral in toward the surface low pressure. Once
meterologists notice rotating clouds the tropical disturbance is
upgraded to a tropical depression.
In order to be called a tropical storm the storm must organize a little
more, and winds must
increase to 35 knots. The storm receives a name at this
point. Finally when winds exceed 75 MPH (easier to remember than
65 knots or 74 MPH) the storm becomes a hurricane.
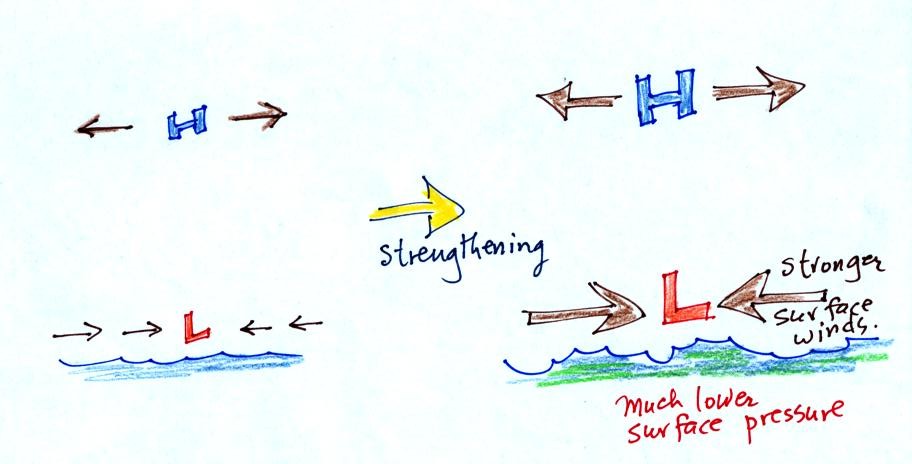
Hurricane intensification is shown in picture form below.
Basically the lower the surface pressure at the center
of the hurricane, the stronger the storm and the faster the surface
winds will blow.
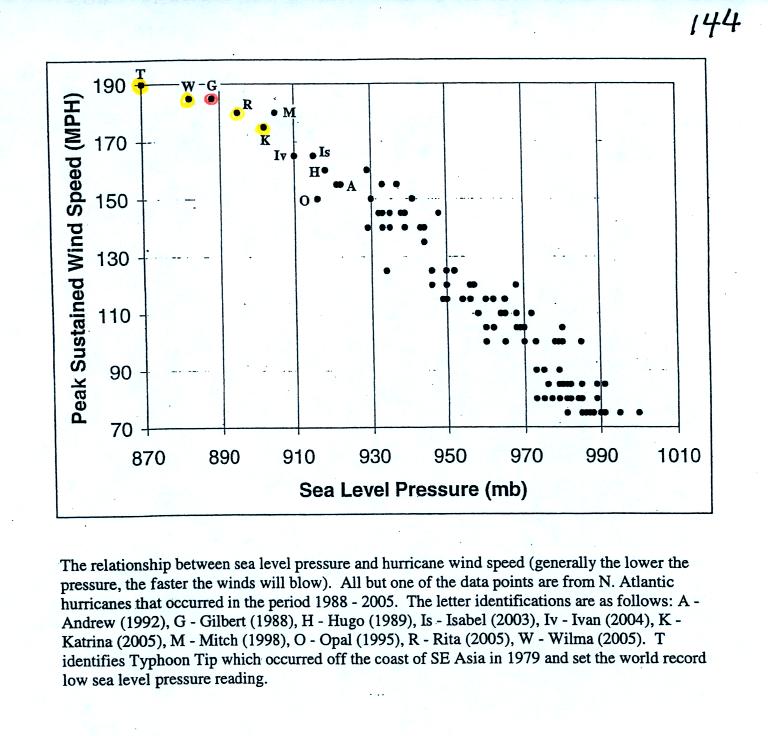
The next figure shows how the surface low pressure and the speed of the
spinning winds are related.
The world record low sea level pressure reading, 870 mb, was set
by Typooon Tip off the SE Asia coast. Sustained winds were 190
MPH. Three 2005 Atlantic hurricanes: Wilma, Rita, and Katrina had
pressures in the 880 mb to 900 mb range and winds ranging from 170 to
190 MPH.
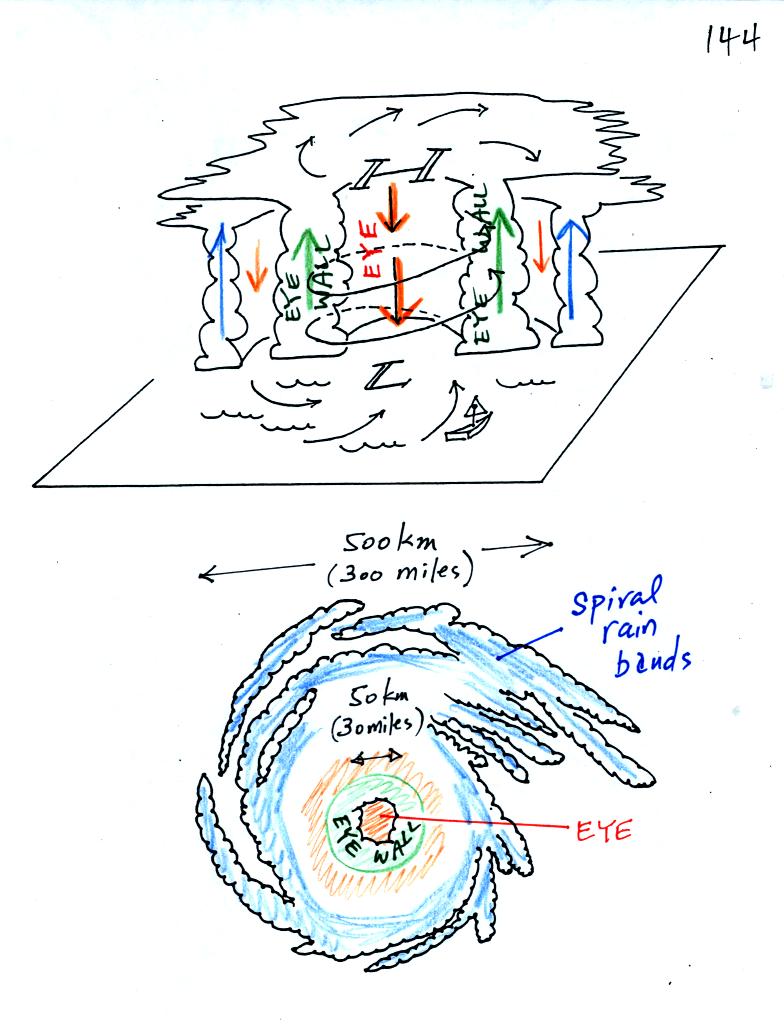
A crossectional view of a mature hurricane and a picture
like you might
see on a satellite photograph.
Sinking air in the very center of a hurricane produces the clear skies
of the eye, a hurricane's most distinctive feature. The eye is
typically a few 10s of miles across, though it may only be a few miles
across in the strongest hurricanes.
A ring of strong thunderstorms, the eye wall, surrounds the eye.
This is where the hurricane's strongest winds found.
Additional concentric rings of thunderstorms are found as you move
outward from the center of the hurricane. These are called rain
bands. These usually aren't visible until you get to the outer
edge of the hurricane because they are covered by high altitude clouds.
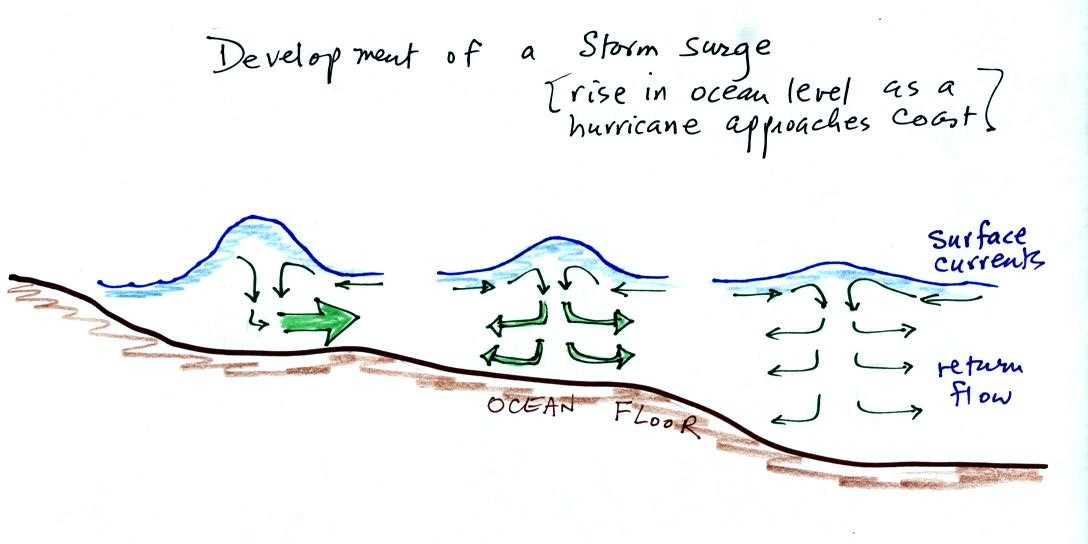
The
following figure shows how storm surges develop
Out at sea, the converging surface
winds
create
surface
currents
in the
ocean that transport water toward the center of the hurricane.
The rise in ocean level is probably only a few feet, though the waves
are much larger. A return flow develops underwater that carries
the water back to where it came from.
As the hurricane approaches shore, the ocean becomes
shallower.
The return flow must pass through a more restricted space. A rise
in ocean level will increase the underwater pressure and the return
flow will speed up. More pressure and an even faster return flow
is needed as the hurricane gets near the coast.
Here is a link to the storm surge website
(from the Hurricane Research Division of the Atlantic Oceanographic and
Meteorological Labororatory). It has an interesting animation
showing output from the SLOSH model used to predict hurricane storm
surges and the flooding they can cause.
The bottom
portion of the hurricane
summary
contains some information about the 2005 hurricane season, an
unusually active year (this is not material you need to remember for
the quiz).
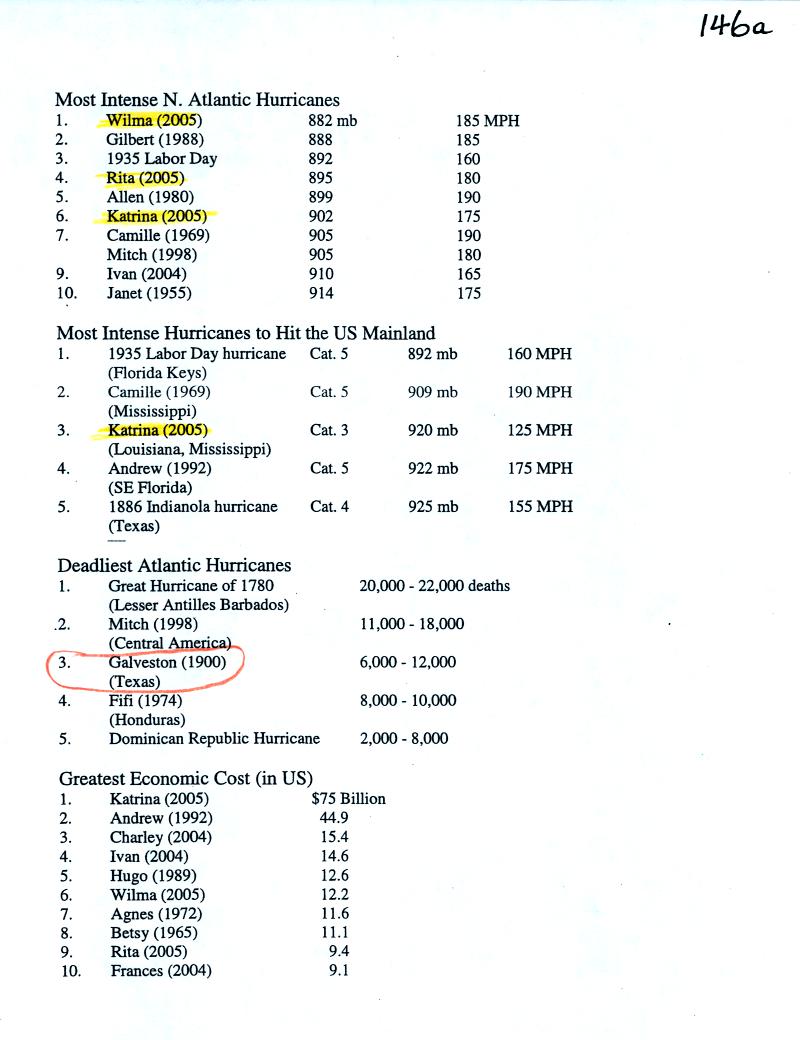
3 of the 10 most intense Atlantic hurricanes ( Wilma, Rita, and
Katrina) occurred in 2005 (you'll find the top 10 listed on p. 146a in
the photocopied classnotes, reproduced below). Wilma became the
most intense hurricane every in the Atlantic, beating out Hurricane
Gilbert (1988) which was featured in the video tape segment shown in
class on Monday.
On average there are about 10 named storms (tropical storms and
hurricanes) in the Atlantic per year. Before 2005 the record was
21 storms. There were 28 storms in 2005 which blew the old record
out of the water.
Katrina was the third most intense hurricane to hit the mainland US and
easily became the most costly natural disaster in US history.
Fortunately none of the 2005 came close to becoming the deadliest
hurricane in US history. That distinction belongs to the 1900 Galveston
hurricane.
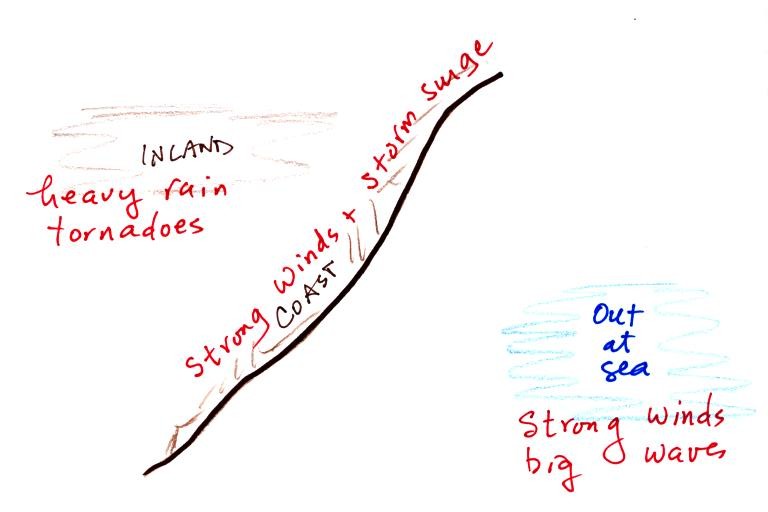
Strong winds and the storm surge cause the most damage along a
coastline.
Hurricanes weaken rapidly when they move onshore (they are cut off from
their moisture supply and friction slows the winds).
Hurricanes however can produce very large amounts of rainfall, a foot
or two of rain over a period of a day or two. This can lead to
catastrophic flooding.
Somewhere between 10,000 and 20,000 people were killed in Central
America from mudslides and flooding associated with Hurricane Mitch in
1998.
We ended the section on hurricanes by watching a short segment on
Hurricane Camille (1969). The video showed the 3-story tall
Richelieu Apartments before Camille and after Camille had made landfall
(the apartment building was completely demolished by a 20 foot storm
surge).
We had
time to take the first of ten easy steps toward understanding why winds
blow the way they do. The first step was on a handout distributed
in class (steps 2-6 were included on the Wednesday handout, steps 7-10
will be distributed in class on Friday).
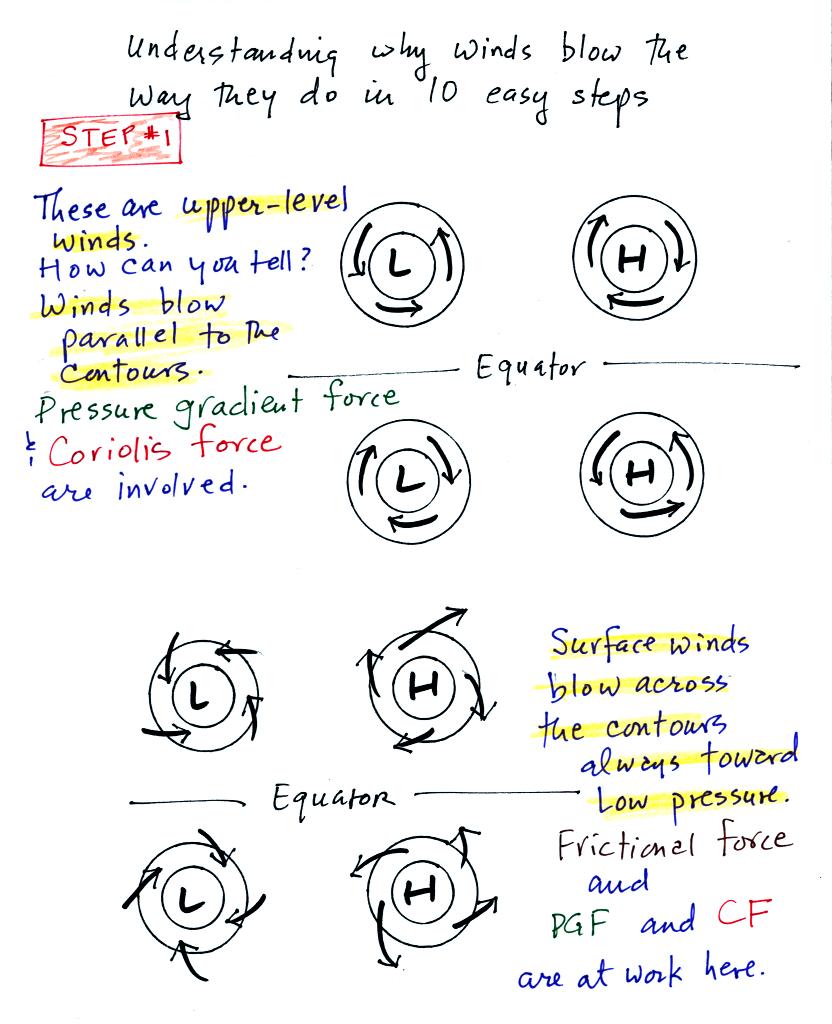
The four drawings at the bottom of the page show surface winds blowing
around high and low pressure in the southern hemisphere. These
winds blow across the contour lines slightly, always toward low
pressure. The frictional force is what causes this to
occur. He is
an example of what you will be able to say about surface winds
blowing around low pressure in the southern hemisphere.