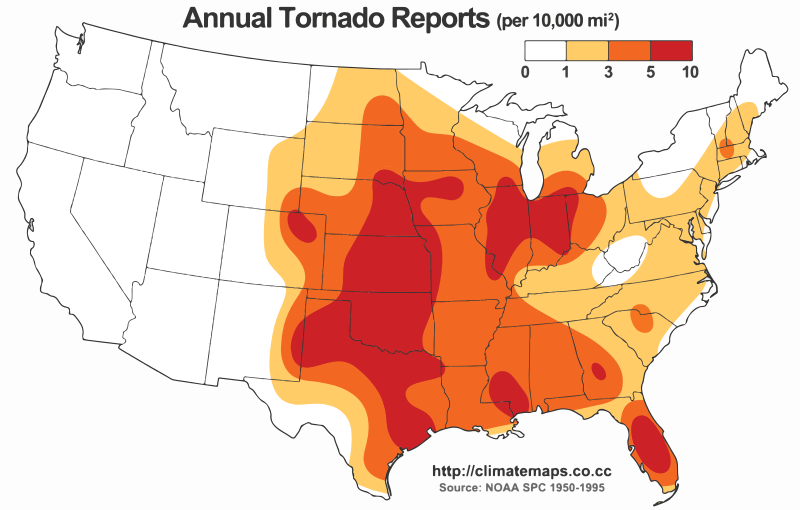
Friday, Apr. 12, 2019

Haim "If I Could Change Your Mind" (3:59), "Forever" (4:05), "I'll Try Anything Once" (3:32), "Right Now" (4:30), "Hazy Shade of Winter" (3:02), "Better Off" (3:30), "Want You Back" (3:59), "Little of Your Love" (3:39)

SpaceX Falcon Heavy Launch and Booster Return & Landings (2:10)


We'll probably be using page 159a, page 159b, and page 160a from the ClassNotes today.

Tornadoes

The United States has roughly 1000 tornadoes in an average year, more than any other country in the world.


A year's worth of tornado activity plotted on a world map.  Note the name at bottom left: T.T. Fujita, "Mr. Tornado."  The scale used to rate tornado strength and intensity is named after him.  A comparable, more recent map can be found at https://www.ncdc.noaa.gov/climate-information/extreme-events/us-tornado-climatology

This is mostly just a consequence of geography.


Without any mountains in the way, cold dry air can move in the spring all the way from Canada to the Gulf Coast.  There it collides with warm moist air from the Gulf of Mexico to form strong cold fronts and thunderstorms.  There are some other meteorological conditions that come into play that create thunderstorms capable of producing tornadoes.


This map, created by Alex Matus and from a Wikipedia article on tornado climatology (https://en.wikipedia.org/wiki/Tornado_climatology) shows the average frequency of tornado occurrence in the US. 
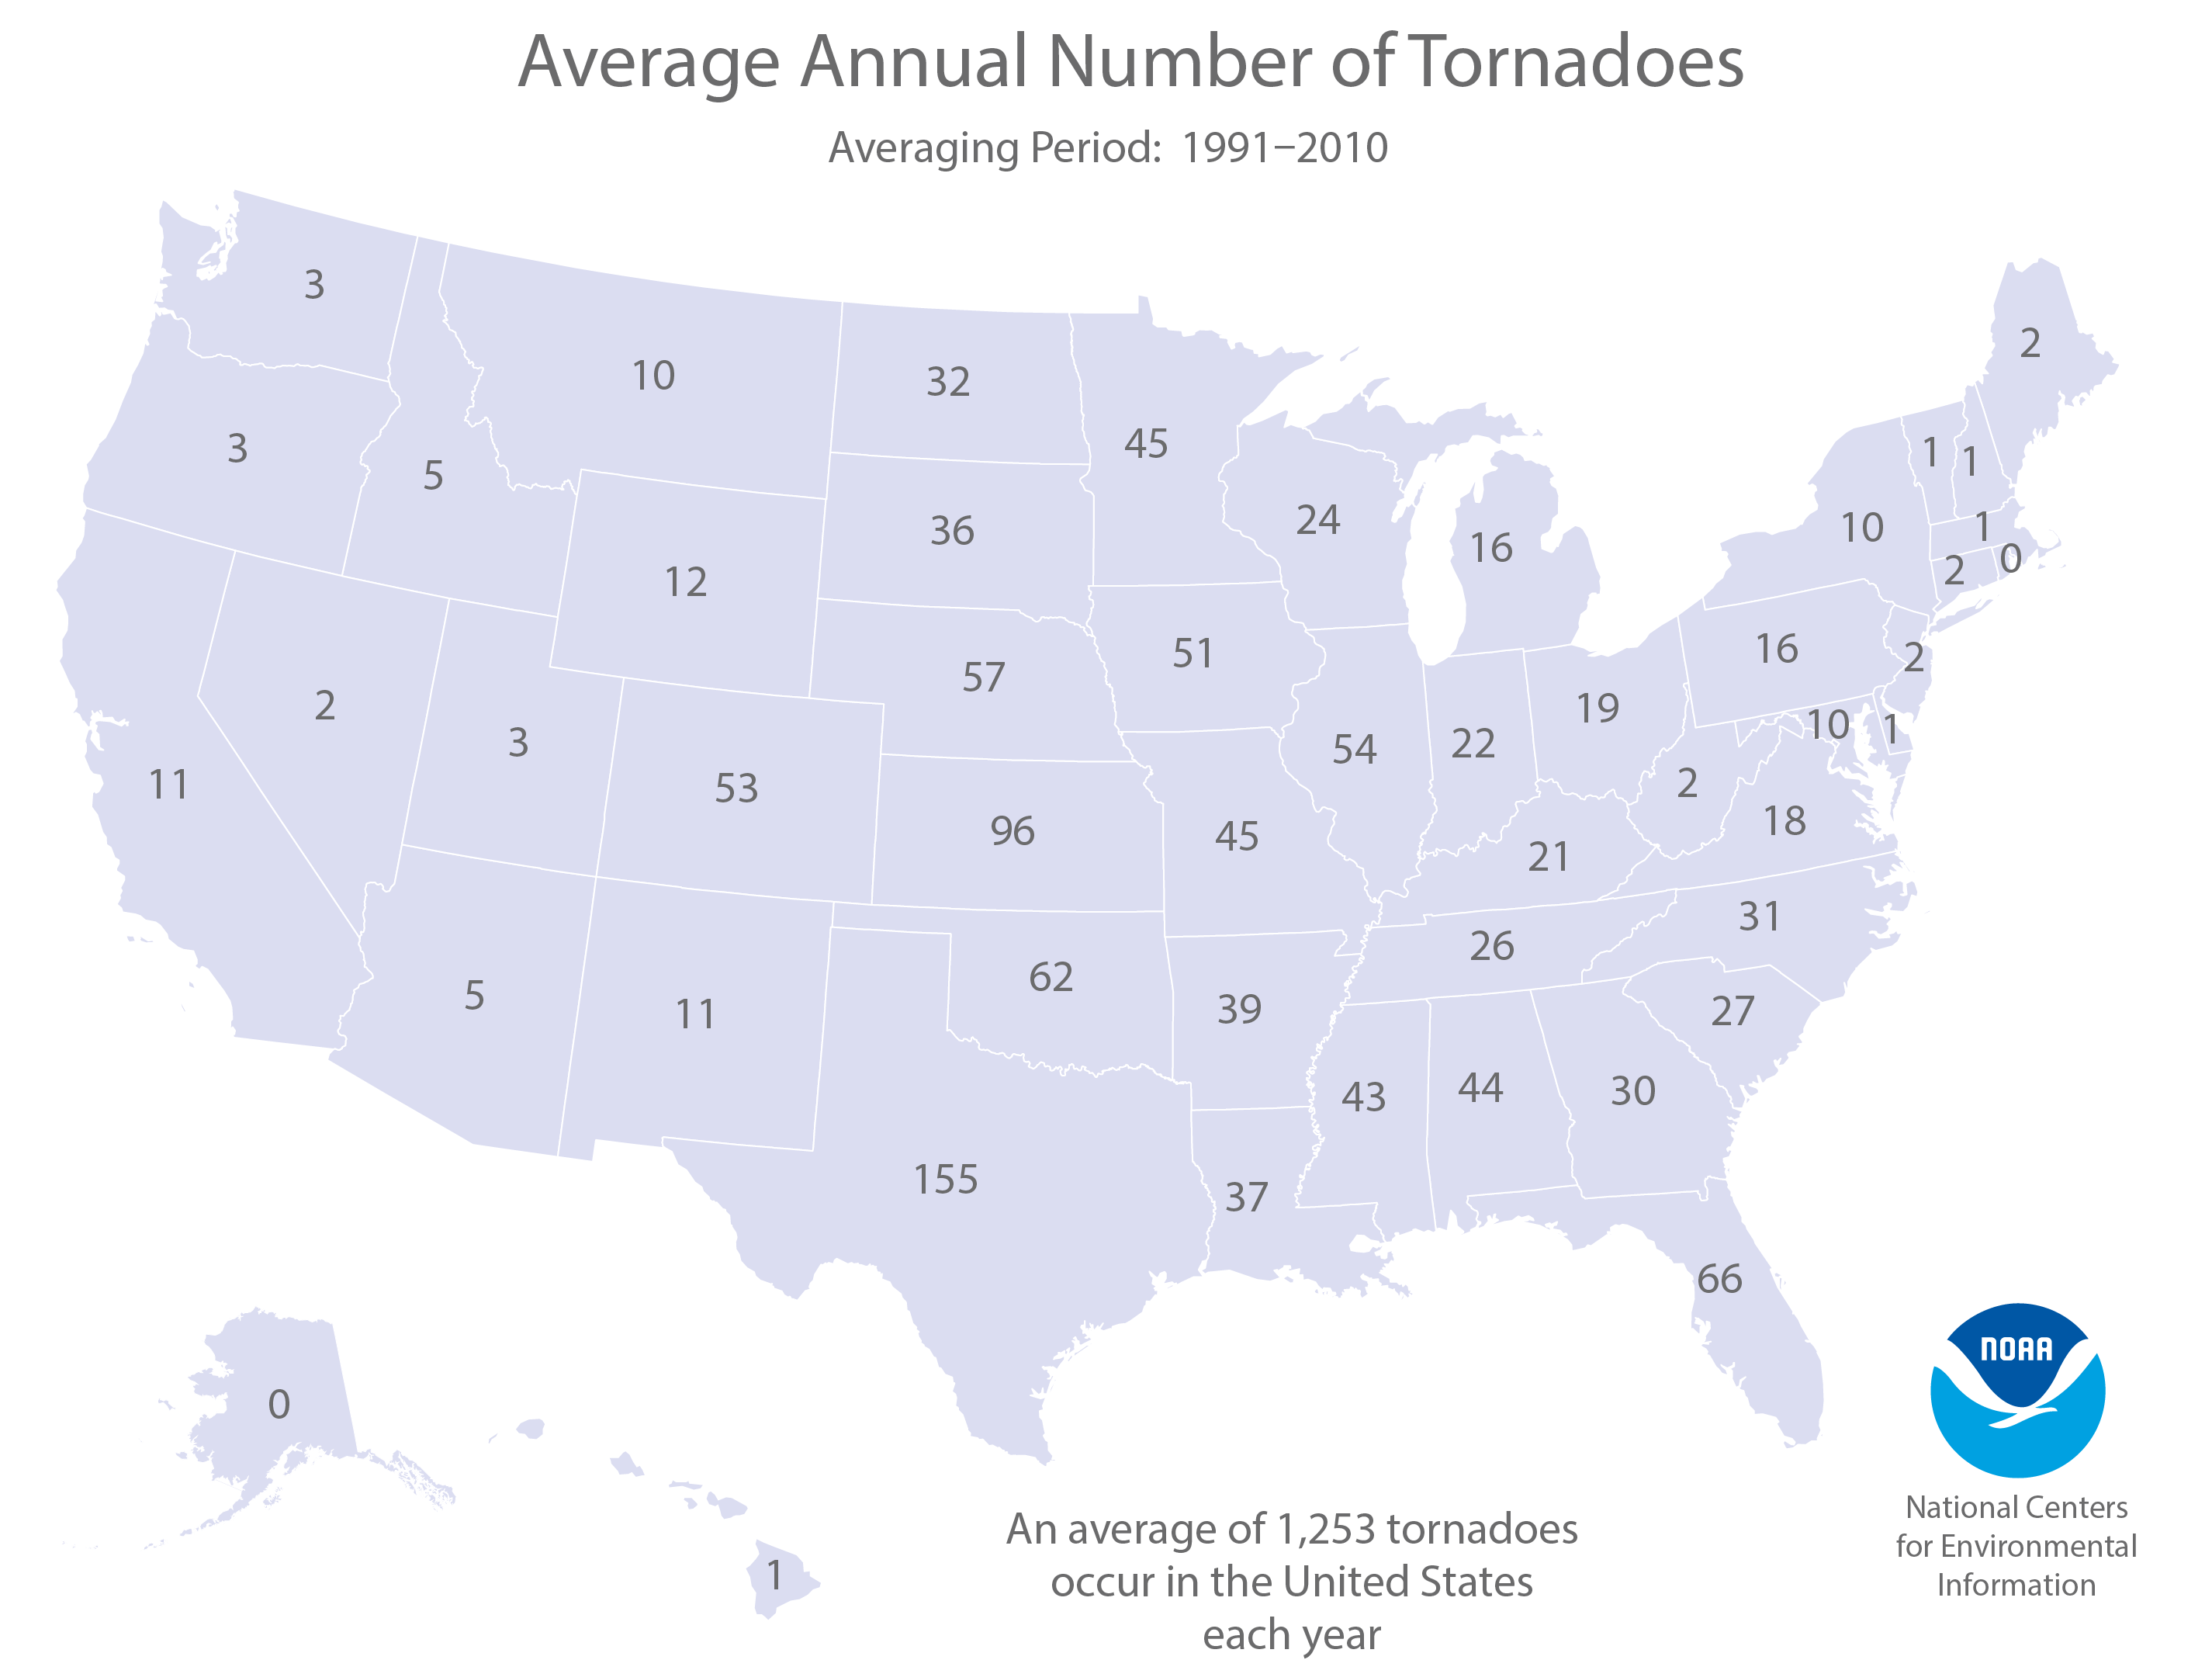
This map from the National Centers for Environmental Information (https://www.ncdc.noaa.gov/climate-information/extreme-events/us-tornado-climatology) shows the average number of tornadoes by state.

Tornadoes have been observed in every state, but tornadoes are most frequent in the Central Plains, a region referred to as "Tornado Alley" (highlighted in red, orange, and yellow above). 


The figure above shows tornado deaths per million people (from: https://blog.nssl.noaa.gov/nsslnews/2009/03/us-annual-tornado-death-tolls-1875-present/).  You can see a steady decline in fatalities beginning around 1925.  The number of deaths appears to have leveled off at roughly 0.2 deaths per million in the past decade or so (note the y-axis is a logarithmic scale).   This is roughly a factor of 10 less than it was a century ago and is due to much improved methods of detecting and sending out warnings of tornadoes and severe thunderstorms. 

The currently population of the US is about 325 million, so 0.2 deaths/million x 325 million is 65 deaths per year.

Here are some data for the past several years (a link to the 2018 data is included below).  You can see that every so often the United States experiences a particularly deadly year.  That was the case in 2011.  An  EF5 tornado struck Joplin, Missouri, on May 22 and killed 158 people (EF refers to the Enhanced Fujita Scale rating).

Tornado statistics for past few years
Year
No. of confirmed tornadoes
No. of deaths
2019 (ongoing)
144
24
2018
1123
10 (record low)
2017
1418
35
2016
976
18
2015
1178
36
2014
928
47
2013
903
55
2012
939
69
2011
1697
553*
*  second largest death total in US history

You'll find a graphical display of the average annual tornado frequency that extends back to 1995 at https://www.statista.com/statistics/203682/number-of-tornadoes-in-the-us-since-1995/

Tornado characteristics


Here are some basic tornado characteristics (the figure above is also on page 159a)

1.  About 2/3rds (maybe 3/4) of tornadoes are F0 or F1 tornadoes (this is referring to the Fujita Scale, which we'll learn more about later) and have spinning winds of about 100 MPH or less.  Microburst winds can also reach 100 MPH.  Microbursts are much more common in Tucson in the summer than tornadoes and can inflict the same level of damage. 

2.  A very strong inwardly directed pressure gradient force is needed to keep winds spinning in a circular path.  The pressure in the center core of a tornado can be 100 mb less than the pressure in the air outside the tornado.  This is a very large pressure difference in such a short distance.  The PGF is much stronger than the Coriolis Force (CF) and the CF can be neglected.  The same pressure drop can be found in strong hurricanes but it takes place over a much larger distance.  The PGF isn't as strong and the CF does play a role.

3.  Because the Coriolis force doesn't play a role, tornadoes can spin clockwise or counterclockwise, though counterclockwise rotation is more common.  This might be because larger scale motions in the cloud (where the CF is important, might determine the direction of spin in a tornado).

4, 5, 6.  Tornadoes usually last only a few minutes, leave a path on the ground that is a few miles long, and move at a few 10s of MPH.  There are exceptions, we'll look at one shortly.

7, 8.  Most tornadoes move from the SW toward the NE.  This is because tornado-producing thunderstorms are often found just ahead of a cold front where winds often blow from the SW.   Most tornadoes have diameters of 10s to a few 100s of yards but tornadoes with diameters over a mile have been observed.  Tornado diameter can also be much larger near the base of the thunderstorm than it is near the ground.

9, 10.  Overall tornadoes are most frequent in the Spring.  The strongest tornadoes also occur at that time of year.  You don't need to remember the specific months.  Tornadoes are most common in the late afternoon when the atmosphere is most unstable.


The 1925 Tri State Tornado


This figure traces out the path of the 1925 "Tri-State Tornado" .  The tornado path (note the SW to NE orientation) was 219 miles long, the tornado lasted about 3.5 hours and killed 695 people.  The tornado was traveling over 60 MPH over much of its path. It is still today the deadliest single tornado ever in the United States (you'll find a compilation of tornado records here).  The Joplin Missouri tornado (May 22, 2011) killed 158 people making it the deadliest since 1947 and the 7th deadliest tornado in US history.

Tornado outbreaks


Tornadoes often occur in "outbreaks."  The paths of 148 tornadoes during the April 3-4, 1974 "Jumbo Tornado Outbreak" are shown above.  Note the first tornadoes were located in the upper left corner of the map and all of the tornado paths are oriented from SW to NE.

The April 25-28, 2011 outbreak is now apparently the largest tornado outbreak in US history (358 tornadoes, 346 people killed).  You'll find a plot of the tornado paths from the Washington Post here.


Here is some information about a November 2015 High Plains tornado outbreak.  November tornado outbreaks are fairly unusual.


As we learn more about tornadoes I'm hoping you'll look at tornado videos with a more critical eye than you would have otherwise.  So we took a moment, at this point,  to have a look at some tornadoes caught on video.  If you click on the links below you'll see the same or a similar video that I found online.  The videos shown in class were from a tape called "Tornado Video Classics".

The numbers in the left column identified the tornado on the tape.  The next column shows the Fujita Scale rating (the scale runs from F0 (weakest) to F5 (strongest).  The locations and date are shown next.  The last column has comments and things to look for when watching the video segment.


Video
ID
Fujita
Scale
rating
Location
Date
Comments
54a
F3
Grand Isle NE
Mar. 13, 1990
tornado cloud is pretty thick and vertical
61f
F3
McConnell AFB KS
Apr. 26, 1991
this is about as close to a tornado as you're ever likely to get.  Try to judge the diameter of the tornado cloud.  What direction are the tornado winds spinning?
52
F5
Hesston KS

Mar. 13, 1990
Watch closely, you may see a tree or two uprooted by the tornado winds
51
F3
North Platte
NE

Jun. 25, 1989
Trees uprooted and buildings lifted by the tornado winds.  The online video is longer than the one shown in class and has some good closeup video.  See especially the last couple of minutes of the video
65
F1
Brainard MN
Jul. 5, 1991
It's a good thing this was only an F1 tornado
57
F2
Darlington IN
Jun. 1, 1990
Tornado cloud without much dust
62b
F2
Kansas Turnpike
Apr. 26, 1991
It's sometimes hard to run away from a tornado.  Watch closely you'll see a van blown off the road and rolled by the tornado.  The driver of the van was killed!
47
F2
Minneapolis, MN
Jul. 18, 1986
Tornado cloud appears and disappears.  The online video compares features seen in this tornado with one created in a laboratory.

A highway underpass is actually a very dangerous place to take shelter from a tornado, here is a little more information from the Ohio Committee for Severe Weather Awareness.


Tornado life cycle
Hopefully the next time you see a tornado either in person or on video you'll be able to say whether it is early or late in its life cycle and whether it appears to be a stronger or weaker than average tornado.  The following figure is on page 159b in the ClassNotes.


Tornadoes begin in and descend from a thunderstorm.  You would usually see a funnel cloud dropping from the base of the thunderstorm.  Spinning winds will probably be present between the cloud and ground before the tornado cloud becomes visible.  The spinning winds can stir up dust at ground level.  The spinning winds might also be strong enough at this point to produce some minor damage. 

In Stage 2, moist air moves horizontally toward the low pressure in the core of the tornado.  This sideways moving air will expand and cool just as rising air does (see figure below).  Once the air cools enough (to the dew point temperature) a cloud will form. 

Tornadoes can go from Stage 2 to Stage 3 (this is what the strongest tornadoes do) or directly from stage 2 to stage 4 or 5.  Note a strong tornado is usually vertical and thick as shown in Stage 3.  "Wedge tornadoes" actually appear wider than they are tall.

Here is video of the Laverne Oklahoma tornado that was shown in class and that shows the initial dust swirl stage up to the mature stage very well. 

The thunderstorm and the top of the tornado will move faster than the surface winds and the bottom of the tornado.  This will tilt and stretch the tornado.  The rope like appearance in Stage 5 is usually a sign of a weakening (though still a dangerous) tornado.


A tornado cloud forms is mostly the same way that ordinary clouds do.  In an ordinary cloud (left figure above) rising air moves into lower pressure surroundings and expands.  Expansion cools the air.  If the air expands and cools enough (to the dew point) a cloud forms.  In a tornado air moves horizontally into lower pressure at the core of the tornado.  The air expands and cools just like rising air does.  If the air cools enough a cloud appears.

Tornado intensity and the Fujita Scale

It is very hard to actually measure the speed of the rotating winds in a tornado.  Researchers usually survey the damage caused by the tornado and assign a Fujita Scale rating.  The original scale, introduced in 1971 by Tetsuya (Ted) Fujita.  A simplified, easy to remember version is shown below.  A very basic and grossly oversimplified idea of the damage that each level can produce is included.  This is simple enough that I can remember it and can use it to estimate tornado intensity when I see damage on the television news (without having to turn on my computer and look up the Fujita scale online).


The fact that the interior walls in a home as the last to go in a tornado means this is probably the best location to seek shelter from a tornado if a better location (such as an underground storm cellar) is not available. 

At some point it became apparent that the Fujita (F) Scale was probably overestimating the wind speeds in tornadoes.  The original scale has been replaced by the Enhanced Fujita (EF) scale.  We'll look at the improved scale and some damage photographs next Monday.