


| Scale |
Phenomenon |
| Beaufort* |
Wind speed |
| Fujita |
Tornado intensity |
| Kelvin |
Temperature |
| Richter* |
Earthquakes |
| Saffir-Simpson |
Hurricane intensity |

 |
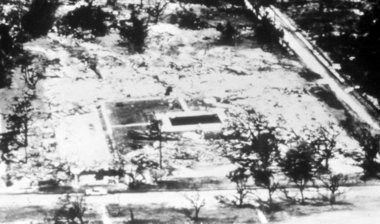 |
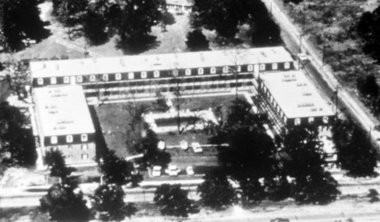
| The Richelieu
Apartments in Pass Christian, Mississippi, before and
after being destroyed by a storm surge produced by
Hurricane Camille in August, 1969 (source of these
pictures: https://www.nola.com/hurricane/2014/08/hurricane_camille_party_what_h.html |
|

