Monday, Feb. 12, 2018
Some Cajun music for Mardi Gras: "Emilie
Vidrine & Tee Franglais" (6:58), "Marais
Bouleur" (10:32), "Belisaire"
(3:48), "Bal
de Maison" (6:55),
"Pain de
Mais" (10:47)
Temperature patterns and fronts
Drawing
isobars on a surface weather map reveals the pressure
pattern. Differences in pressure cause winds to start to
blow. The wind then can affect and change the
temperature pattern.
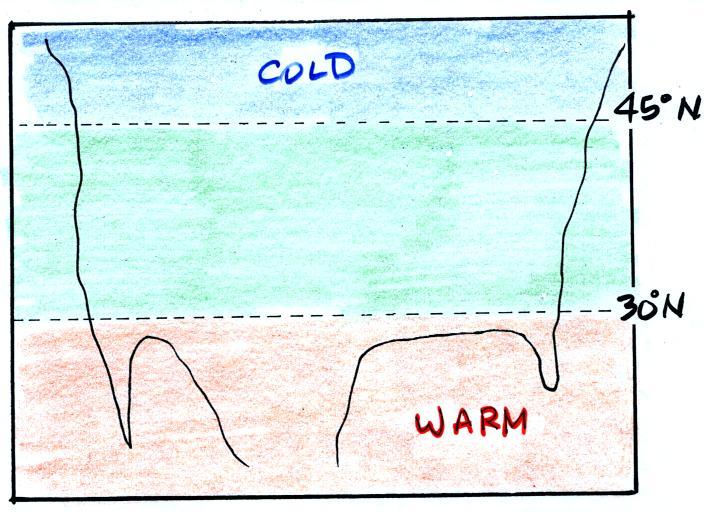
The figure below shows the temperature pattern you would
expect to see if the wind wasn't blowing at all or if the wind
was just blowing straight from west to east. The bands
of different temperature are aligned parallel to the lines of
latitude. Temperature changes from south to north but
not from west to east.
This picture gets a
little more interesting if you put centers of high or low
pressure in the middle.
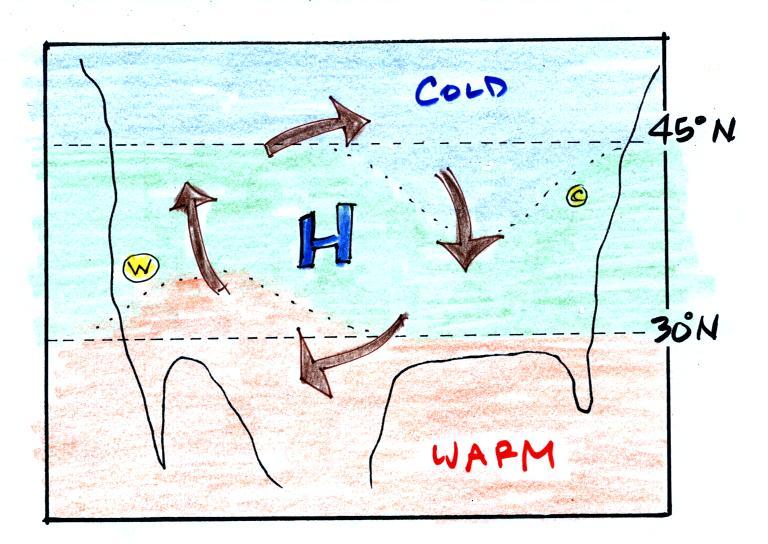
In the case of high pressure,
the clockwise spinning winds move warm air to the north on the
western side of the High. The front edge of this
northward moving air is shown with a dotted line (at Pt. W) in
the picture above. Cold air moves toward the south on
the eastern side of the High (another dotted line at Pt. C,
it's a little hard to distinguish between the blue and green
in the picture). The diverging winds also move the warm
and cold air away from the center of the High. Now you
would experience a change in temperature if you traveled from
west to east across the center of the picture.
The transition from warm to cold along the boundaries (Pts.
W and C) is spread out over a fairly long distance and is
gradual. This is because the winds around high pressure
diverge and blow outward away from the center of high
pressure. There is also some mixing of the different
temperature air along the boundaries.
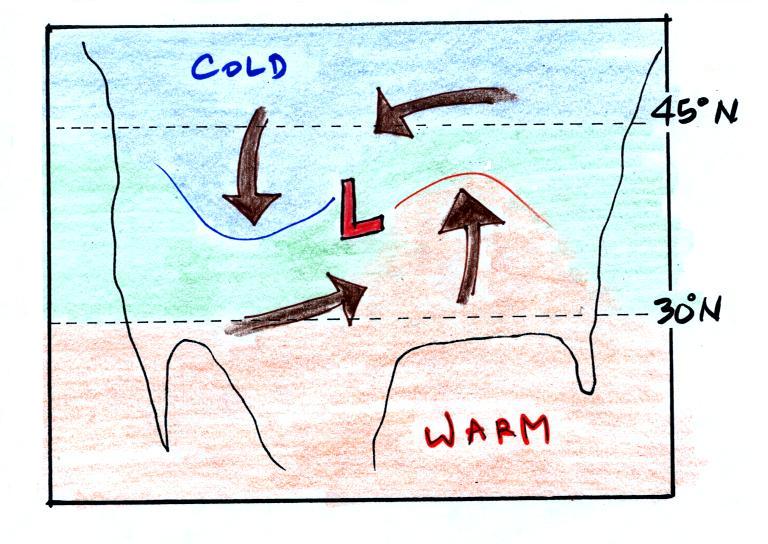
Counterclockwise winds move cold air toward the south on the
west side of the Low. Warm air advances toward the north
on the eastern side of the low. This is just the opposite
of what we saw with high pressure.
The converging winds in the case of low pressure will move
the air masses of different temperature in toward the center of
low pressure. The transition zone between different
temperature air gets squeezed and compressed. The change
from warm to cold occurs in a shorter distance and is sharper
and more distinct. Solid lines have been used to delineate
the boundaries above. These sharper and more abrupt boundaries
are called fronts (there are probably additional meteorological
processes that help to create fronts).
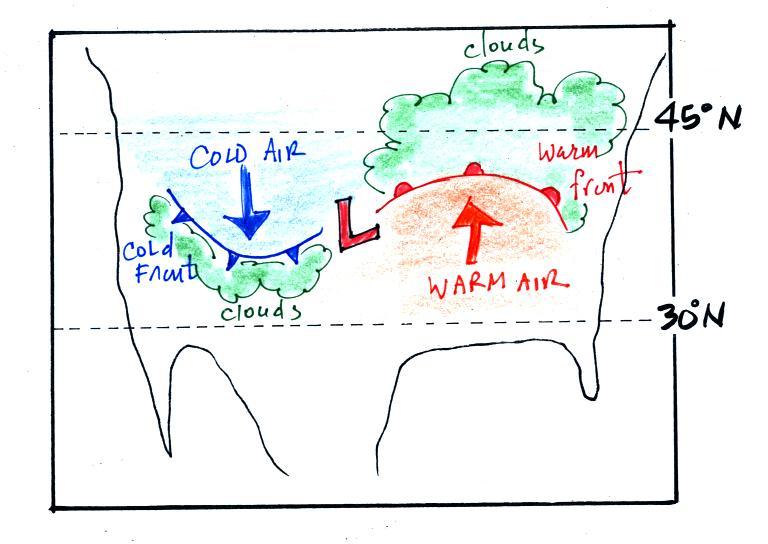
Warm and cold fronts, middle latitude storms (aka
extratropical cyclones)
A cold front is drawn at the front edge of the southward moving
mass of cold air on the west side of the Low. Cold fronts
are generally drawn in blue on a surface weather map. The
small triangular symbols on the side of the front identify it as a
cold front and show what direction it is moving.
A warm front (drawn in red with half circle symbols) is shown
on the right hand side of the map at front edge of the northward
moving mass of. A warm front is usually drawn in red and has
half circles on one side of the front to identify it and show its
direction of motion.
The fronts are like spokes on a wheel. The "spokes"
will spin counterclockwise around the low pressure center (the
axle).
Both types of fronts cause rising air motions.
Fronts are another way of causing air to rise. That's
important because rising air expands and cools. If the air
is moist and cools enough, clouds can form.
The storm system shown in the picture above (the Low together with
the fronts) is referred to a middle latitude storm or an
extra-tropical cyclone. Extra-tropical means outside the
tropics, cyclone means winds spinning around low pressure
(tornadoes are sometimes called cyclones, so are
hurricanes). These storms form at middle latitudes because
that is where air masses coming from the polar regions to the
north and the more tropical regions to the south can collide.
Large storms that form in the tropics (where this mostly just warm
air) are called tropical cyclones or, in our part of the world,
hurricanes.
This is the
dividing line between material that you should be familiar
with for this week's quiz (above)
and material that won't be covered on this week's quiz
(below)
3-dimensional structure of cold fronts
A
3-dimensional cross-sectional view of a cold front is
shown below (we've jumped to p. 148a in the photocopied
ClassNotes)
The person in the
figure is positioned ahead of an approaching
cold front. Time wise, it might be the day before
the front actually passes through. There
are 3 fairly important features to notice in this
picture.
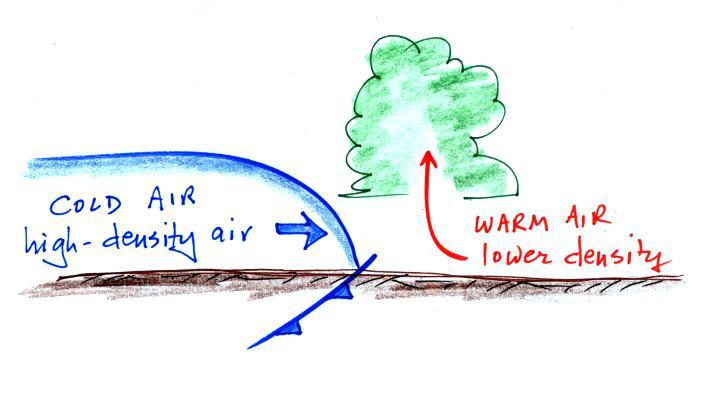
1. The
front edge of the approaching air mass has a
blunt, rounded shape. A vertical slice
through a cold front is shown below at left.
Friction with
the ground causes the edge to "bunch up" and gives
it the blunt shape it has. You'd see
something similar if you were to pour something
thick and gooey on an inclined surface and watched
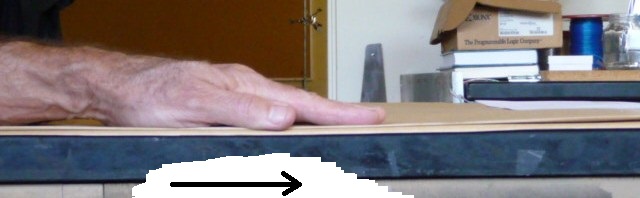
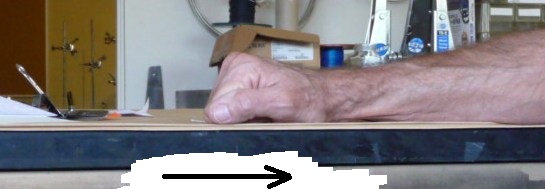
it roll downhill. Or, as
shown in class, you can lay your arm and hand on a
flat surface.
Slide your arm to the right.
Your fingers
will drag on the table surface and will curl up
and your hand will make a fist.
2. A cold front, the leading edge
of a cold air mass is kind of like a fist slamming into a
bunch of warmer air. Because it is denser, the cold
air lifts the warm air out of the way.
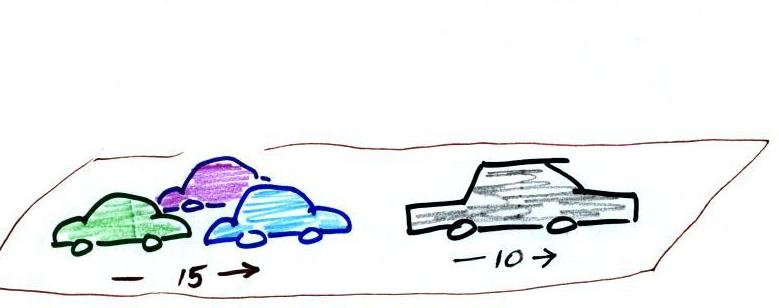
The cold dense air mass behind a cold
front moves into a region occupied by warm air. The
warm air has lower density and will be displaced by the
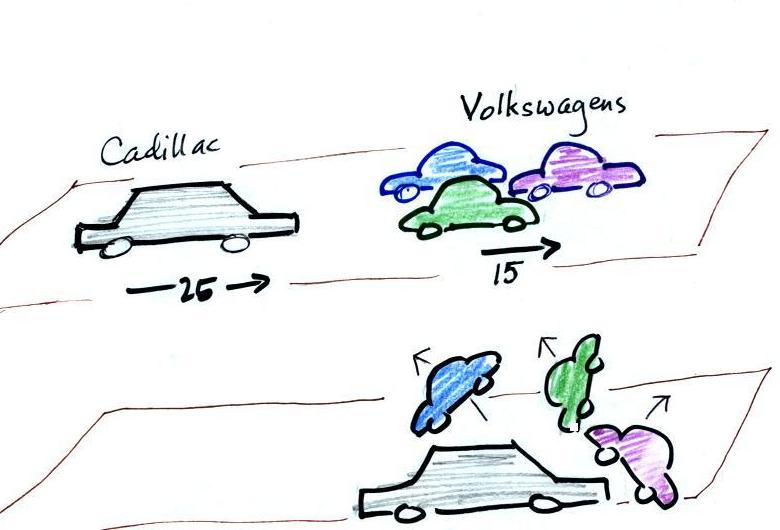
cold air mass. In some ways its analogous to a big
heavy Cadillac plowing into a bunch of Volkswagens.
At this point, just 15 to 20 minutes into today's class, we're in
a position to better appreciate a video recording of the cold
front passing through Tucson. The first video is a time
lapse movie of a cold front that came through Tucson on on Easter
Sunday morning, April 4, 1999. Click here
to see the cold front video (it may take a minute or two to
transfer the data from the server computer in the Atmospheric
Sciences Dept., be patient). Remember this is a time
lapse movie of the frontal passage. The front seems to
race through Tucson in the video, it wasn't moving as fast as the
video might lead you to believe. Cold fronts typically move
15 to 25 MPH.
The 2nd
video was another cold front passage that occurred on
February 12, 2012.
In the past I've had trouble playing the videos using Firefox
on the classroom computer. If that is the
case, you can right click on each link, then click on the Save
Link As... option, and choose to save to the Desktop.
Then double click on the icon on your desktop to view the
video. If you use
Chrome or Internet Explorer you should be able to watch them.
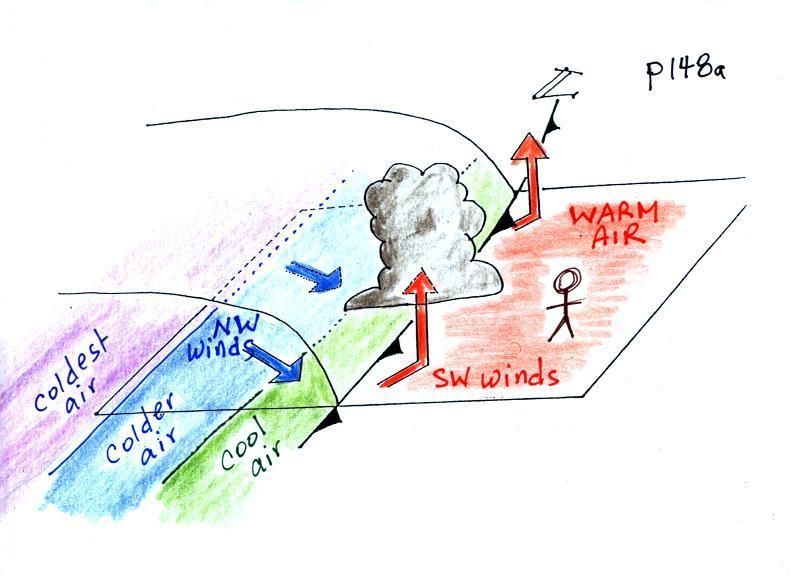
3. Note
the cool, cold, colder bands of air behind
the cold front.
The warm air
mass ahead of the front has just been sitting
there and temperatures are pretty uniform
throughout. Cold fronts are found at the
leading edge of a cold air mass. The air
behind the front might have originated in
Canada. It might have started out very cold
but as it travels to a place like Arizona it can
change (warm) considerably. The air right
behind the front will have traveled the furthest
and warmed the most. That's the reason for
the cool,
cold,
and colder
temperature bands (temperature gradient) behind
the front. The really cold air behind a cold
front might not arrive in Arizona until 1 or 2
days after the passage of the front.
Weather
changes that precede and follow passage of
a cold front
Here are some of the specific weather changes
that might precede and follow a cold
front.
Weather
variable
|
Behind
|
Passing
|
Ahead
|
Temperature
|
cool, cold,
colder*
|
|
warm
|
Dew
Point
|
usually much
drier**
|
|
may be moist
(though that is often
not the case here in the desert southwest)
|
Winds
|
northwest
|
gusty winds (dusty)
|
from the southwest
|
Clouds,
Weather
|
clearing
|
rain clouds,
thunderstorms
in a narrow band along the front
(if the warm air mass is moist)
|
might see some high
clouds
|
Pressure
|
rising
|
reaches a minimum
|
falling
|
* as mentioned
above, the coldest air might follow passage of a cold front by
a day or two.
**nighttime temperatures drop much more quickly in dry air
than in moist or cloudy air. This is part of the reason
it can get very cold a day or two after passage of a cold
front.
Gusty winds and a shift in wind direction are often one of the
most obvious change associated with the passage of a cold
front in Tucson.
The pressure changes that precede and follow a cold front are
not something we would observe or feel but are very useful
when trying to locate a front on a weather map.
3-dimensional structure of warm fronts
We've learned a fair amount about cold fronts:
cross-sectional structure, weather changes that precede and
follow passage of a cold front, and how to locate a cold front
on a surface weather map. Now we have to
do the same for warm fronts.
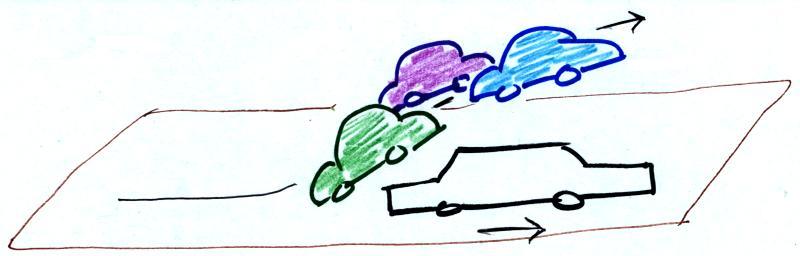
Warm air approaching and colliding with a cold air mass is
like a fleet of Volkswagens overtaking a Cadillac
The VWs are still lighter than the
Cadillac. What will happen when the VWs catch the
Cadillac?
They'll run up and over (overrun) the
Cadillac.
The same kind of thing happens along a warm front. Warm
air is overtaking some colder air that is also moving to the
right.
The approaching warm air is still less dense than the cold air and
will overrun the cold air mass.
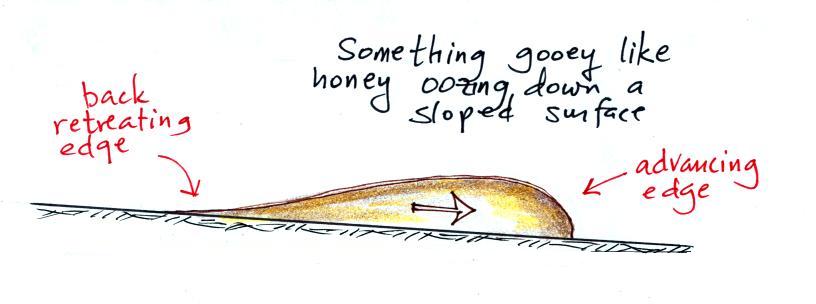
There's one key difference between cold and warm front
boundaries
1. The back edge of a
retreating cold mass that the warm air overtakes has a much
different shape than the advancing edge. The advancing
edge bunches up and is blunt. The back edge gets
stretched out and has a more gradual ramp like shape.
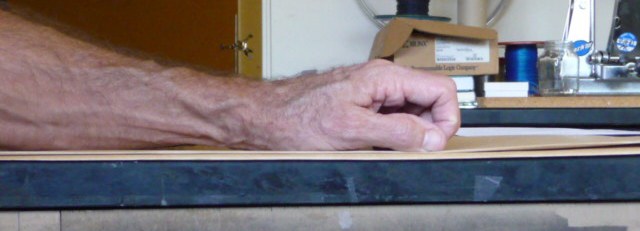
You can use your hand and arm again.
You start with your fingers curled up
then move your arm and hand to the right.
As your arm moves to the
right, friction uncurls your fingers.
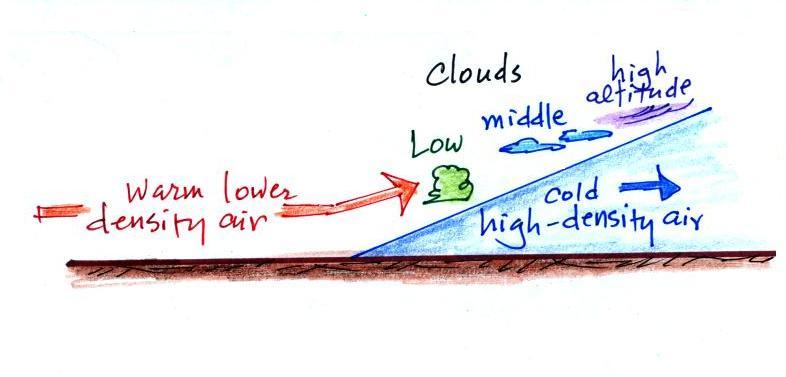
The warm air rises more slowly
and rises over a much larger area out ahead of the warm
front. A variety of cloud types form and spread out
over a large area ahead of the warm front. This is
an important difference between warm and cold fronts.
Weather changes
that precede and follow passage of a warm front
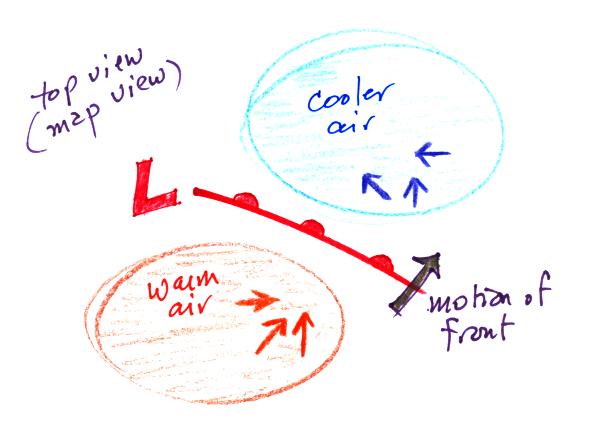
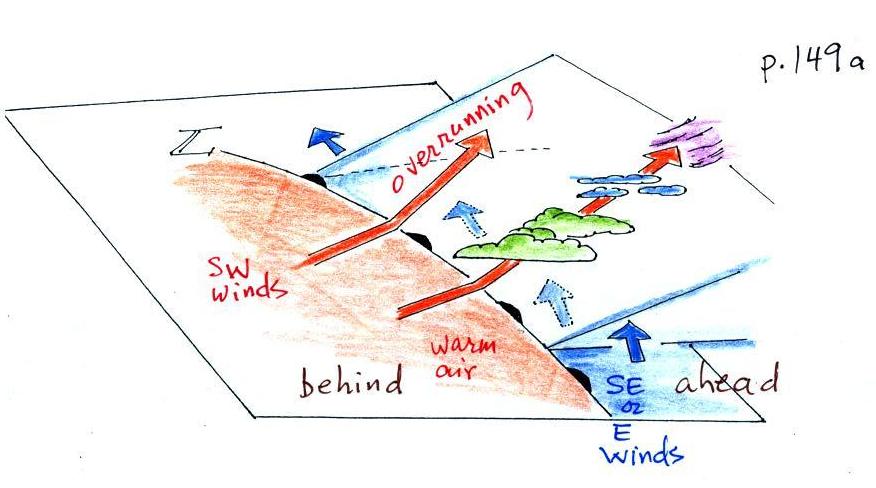
Here's the 3-dimensional view again that's in the ClassNotes.
and the map view
Here are the kinds
of weather changes that usually precede and follow
passage of a warm front.
We'll probably go through this fairly quickly in class.
Weather
Variable
|
Behind
(after)
|
Passing
|
Ahead
(before)
|
Temperature
|
warmer
|
|
cool
|
Dew point
|
may be moister
|
|
drier
|
Winds
|
SW, S, SE
|
|
from the East or
SE, maybe even the S
|
Clouds,
Weather
|
clearing
|
|
wide
variety of clouds that may precede arrival of the front
by a day or two
clouds may produce a wide variety of types of
precipitation also
(snow, sleet, freezing rain, and rain)
|
Pressure
|
rising
|
minimum
|
falling
|
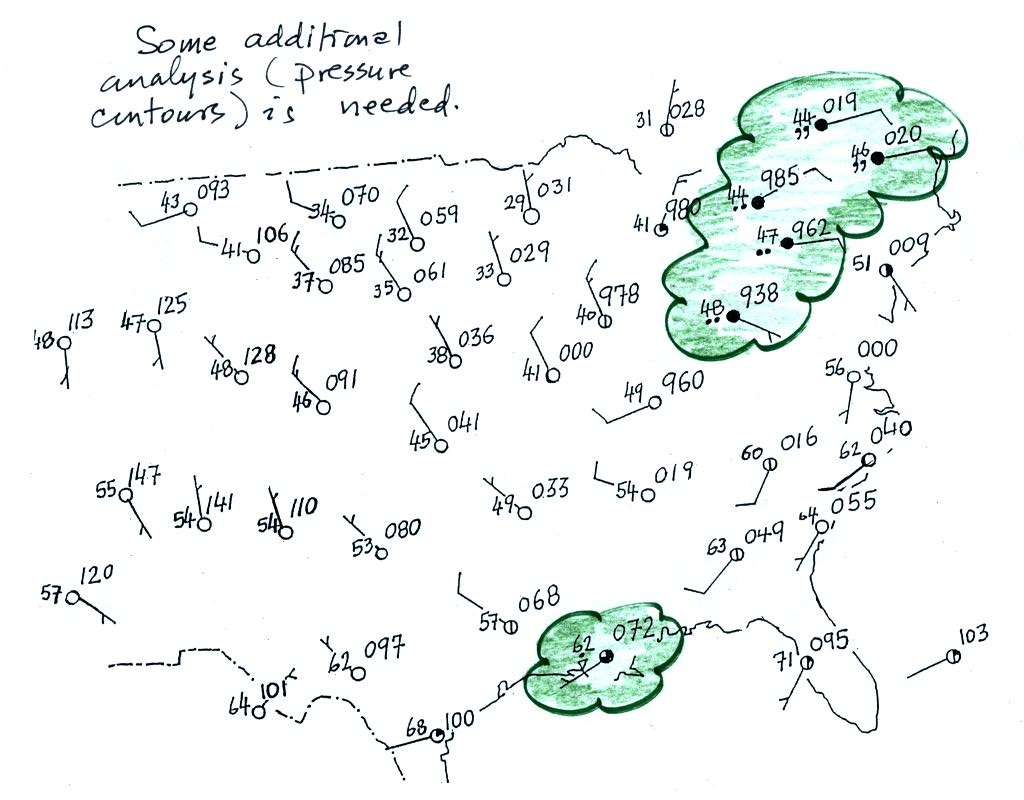
We need to go back to the figure where this
section on surface weather maps all began.
After learning how weather data
are plotted on a map using the station model notation we
found that the data, by themselves, were not enough to
really be able to say what was causing the cloudy, rainy
weather in the NE and along the Gulf Coast.
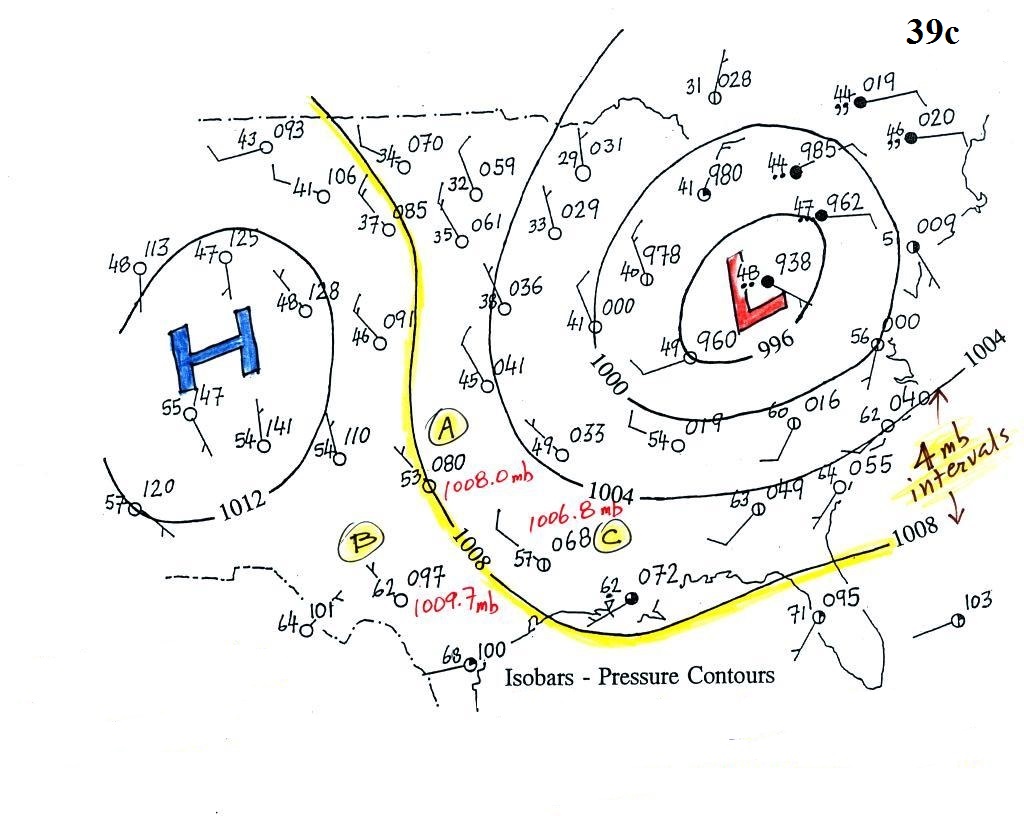
We added some isobars to reveal the pressure pattern and to
locate large centers of high and low pressure. Winds
converging into the center of low pressure cause air to rise and
might be part of the explanation for the unsettled weather in
the NE. That would explain the rain shower along the Gulf
Coast however.
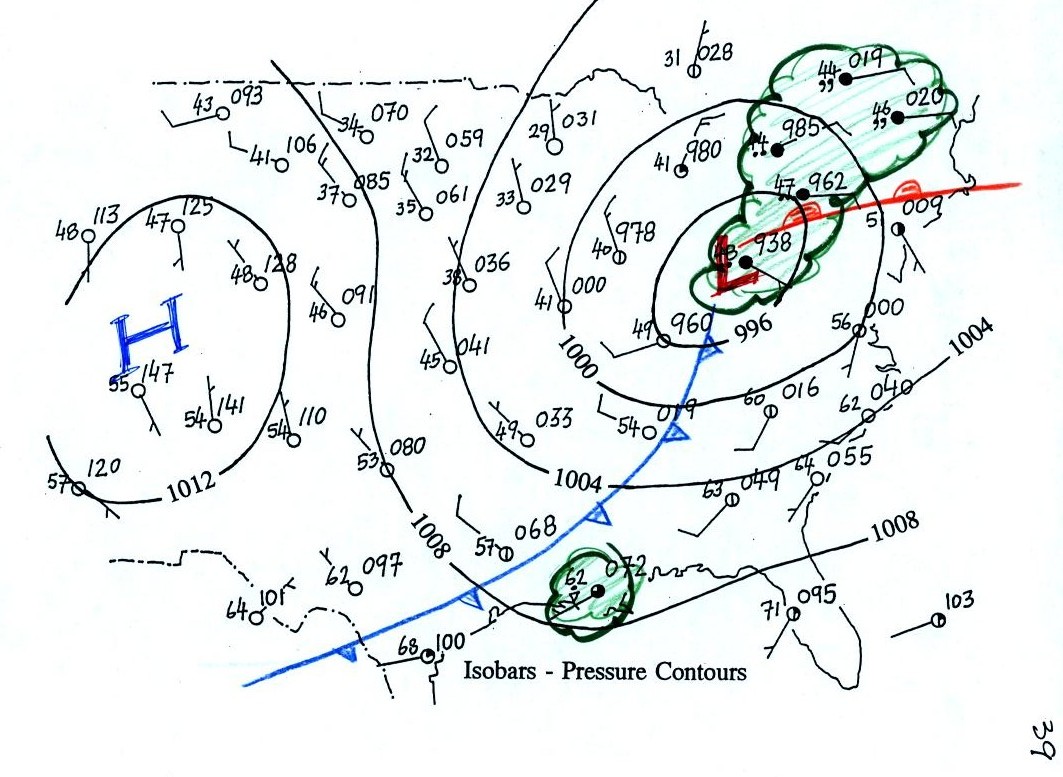
Now we've added cold and warm fronts to the picture. The
approaching cold front is almost certainly the cause of the shower
along the Gulf Coast. The clouds in the NE are probably
mostly being produced by the warm front.