Friday, Apr. 13, 2018
Coldplay and Buena Vista Social Club "Clocks"
(4:59), "La
Negra Tomasa" (8:29), Lila Downs "Cielo Rojo"
(3:58)
The 1S1P Fog in Tucson reports have been graded and were
returned in class. The report includes an updated 1S1P pts
total.
The Forces and Winds Optional Assignment was also returned.
I will put some answers online next week, probably after the other
section of the class turns in their work on the assignment next
Tuesday. The Controls of Temperature Optional Assignment was
collected today.
Gust fronts and the dust storms (haboobs) they can
produce
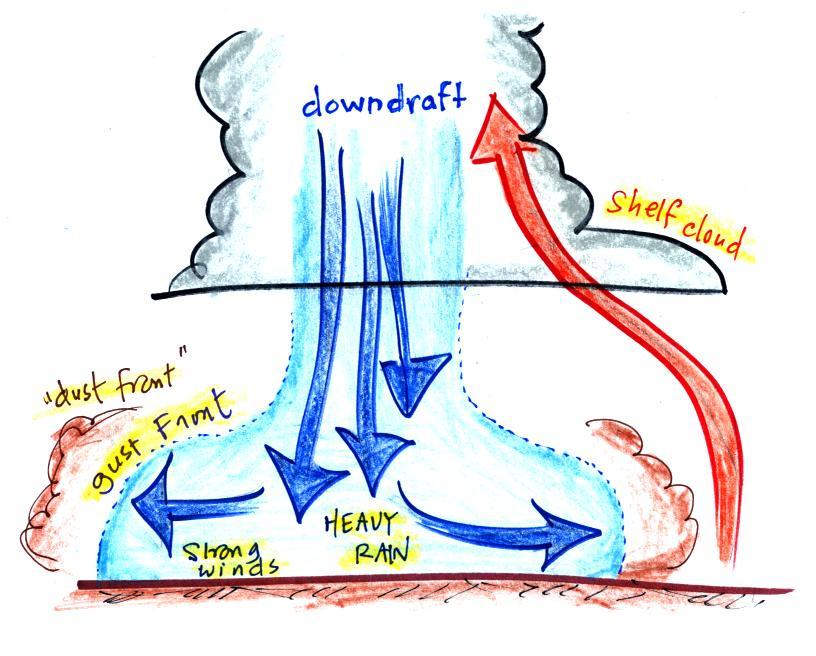
The picture below shows some of the features at the base of a
thunderstorm (I got a little carried away with the colored
pencils).
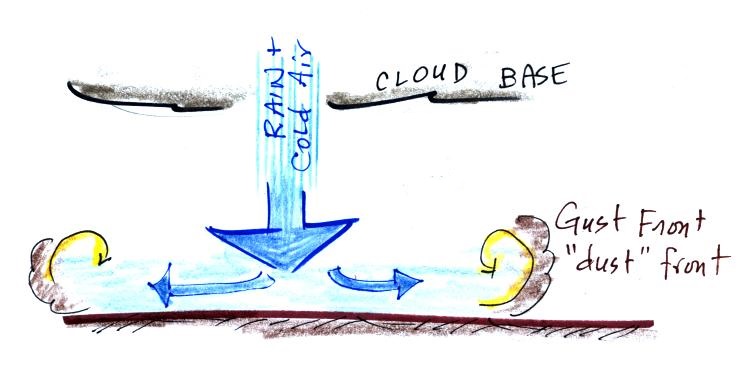
The cold downdraft air spilling out of
a thunderstorm hits the ground and begins to move outward from underneath the thunderstorm. The
leading edge of this outward moving air is called a gust
front. You can think of it as a dust front
because the gust front winds often stir up a lot of dust here in
the desert southwest (see below). There are
several very nice examples in Mike Olbinski's Storm Gallery (http://gallery.mikeolbinski.com/thestormgallery).
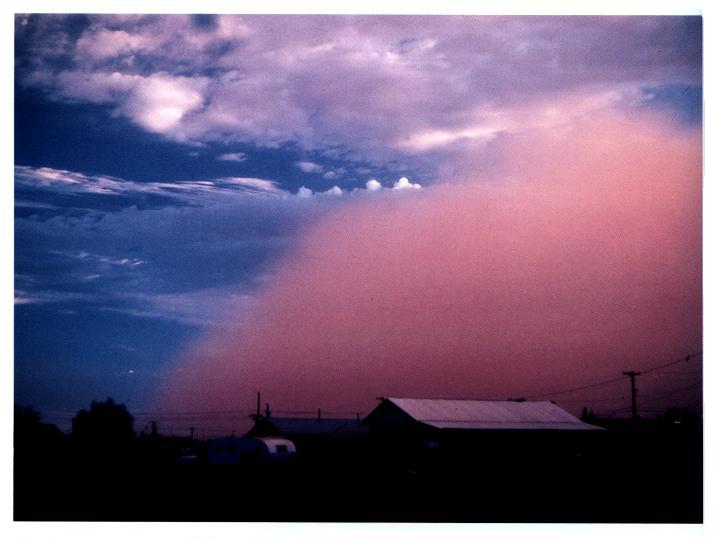
The gust front in this picture
(taken near Winslow,
Az) is moving from the right to the left.
Visibility in the dust cloud can drop to near zero which
makes this a serious
hazard to automobile traffic. Dust storms like this
are sometimes called "haboobs".
There's lots of video on YouTube of an impressive dust storm a
few summers ago. Here's an example
from Gilbert Arizona (July 5, 2011). You
can see day literally turn to night when the dust cloud is
overhead (start at about 1:20). Here's another video of the
same storm
from a different location (South Mountain). There are also
several time lapse videos on Mike Olbinski's Time Lapse Gallery
page (http://www.mikeolbinski.com/timelapse/#top).
Here's a video
from a summer 2012 dust storm captured from the front window
of a vehicle that drove through the storm. Check the last
minute or two of the video where visibility drops to near zero
(about 9:00 minutes into the video). Officials recommend
that you drive off the highway under conditions like this, turn
off your lights, and take your foot off the brake so that your
brake lights are not on (otherwise someone might follow your
lights thinking you're still on the highway and run into you from
behind).
Microbursts
Thunderstorm downdraft winds can be a serious hazard whether they
stir up dust or not.
A narrow intense
thunderstorm downdraft is called a microburst. At the
ground microburst winds will sometimes reach 100 MPH or more
(over a limited area). As we will see most tornadoes have
winds of 100 MPH or less. Microburst winds can damage
homes (especially mobile homes that aren't tied to the ground),
uproot trees, and seem to blow over a line of electric power
poles at some point every summer in Tucson (with the downed power lines
remaining energized). Wind damage from a microburst is
often incorrectly attributed to a tornado.
Microbursts
are a serious threat to aircraft especially when they are close
to the ground during landing or takeoff. Microburst
associated wind shear was largely responsible for the crash of Delta
Airlines Flight 191 while landing at the Dallas Fort Worth
airport on Aug. 2, 1985 (caution some of the links at the end of
the article contain audio of actual cockpit communications).
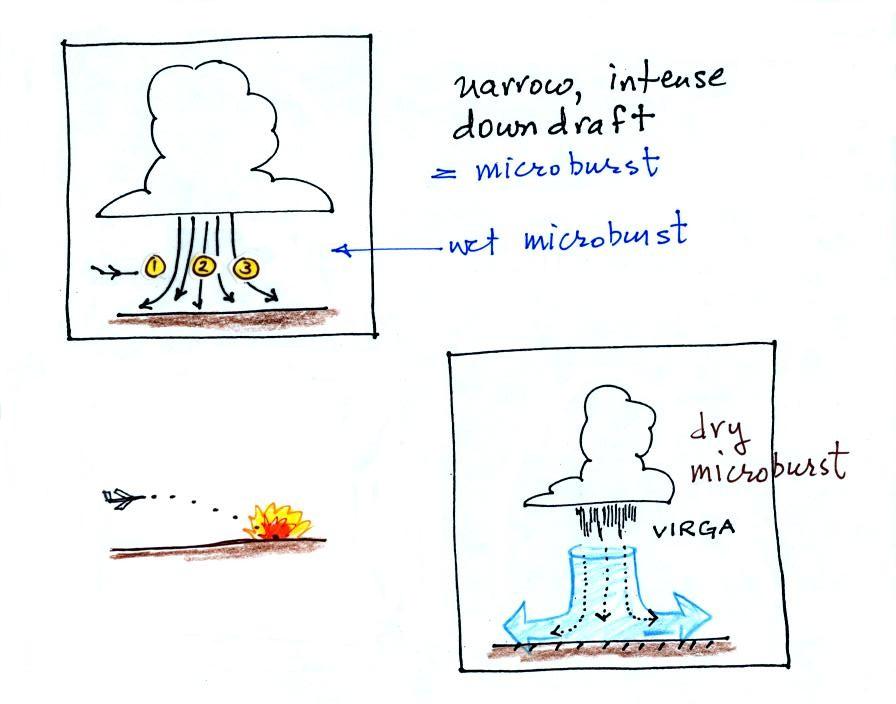
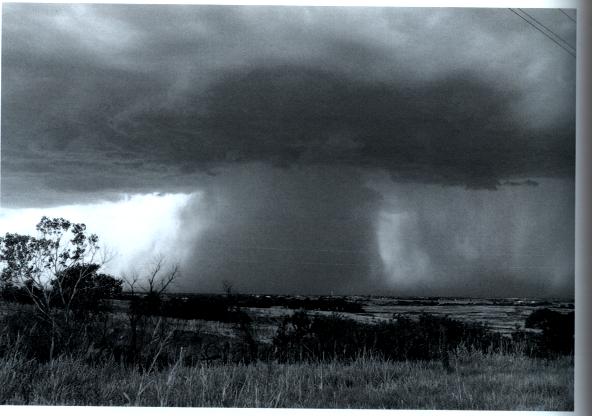
Falling rain could warn of a
wet microburst (see photo below). In other cases, dangerous dry microburst winds might be
invisible (the virga, evaporating
rain, will cool the air, make the air more dense, and strengthen
the downdraft winds).
Here are a couple of microburst
videos. The first video
was taken in the heavy rain and strong winds under a
thunderstorm in the microburst. You'll see a power pole
snapped in half by the microburst winds at about 2:26 into the
video. We'll look at portions of a 2nd longer
video in class. It was taken in or near San Tan,
Arizona. The microburst doesn't look too impressive at the
start of the footage but the storm winds soon get pretty violent
(at about the 3:15 point in the video) and winds were strong
enough to break the trunks of at least one tree (6:45 into the
video). It is probably more common to see recently planted
trees uprooted.
Severe thunderstorms, wind shear, mesocyclones, and
wall clouds
Next I wanted to look at some of the conditions that can lead
to severe thunderstorm formation and some of the characteristics
of these storms. Severe thunderstorms last longer, grow
bigger, and become stronger than ordinary air mass
thunderstorms. They can also produce tornadoes.
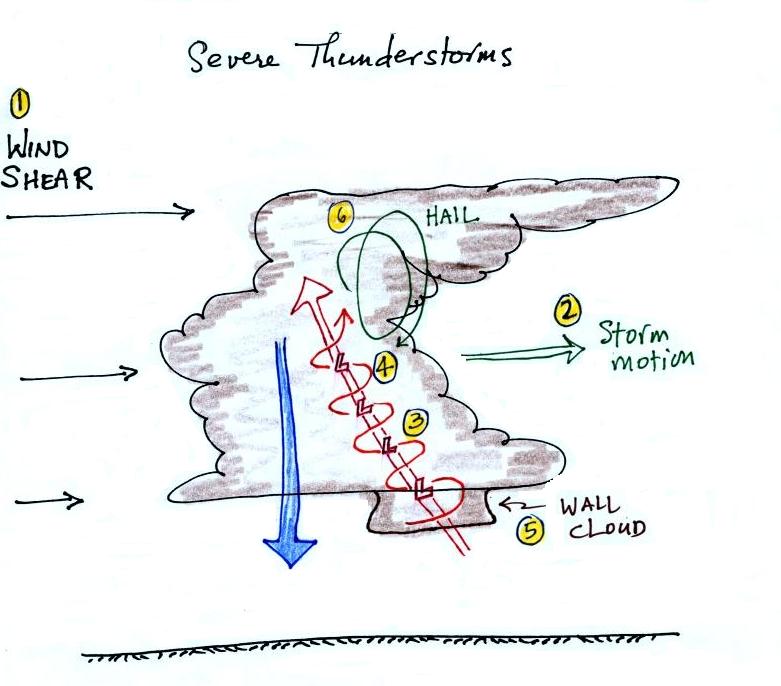
Severe storms are more likely to form
when there is vertical wind shear (the picture above is on p.
154a in the ClassNotes). Wind shear (Point 1)
is changing wind direction and/or wind speed with
distance. In the case shown above, the wind speed is
increasing with increasing altitude, this is vertical wind
shear.
A thunderstorm that forms in this kind of an environment will move at an average of
the speeds at the top and bottom of the cloud (Point 2). The
thunderstorm will move to the right more rapidly than the air
at the ground which is where the updraft begins. Rising
air that is situated at the front bottom edge of the
thunderstorm will find itself at the back edge of the storm
when it reaches the top of the cloud.
This produces a tilted updraft (Point 3). The downdraft
is situated at the back of the ground. The updraft is
continually moving to the right and staying away from the
downdraft. The updraft and downdraft coexist and do not
"get in each others way." If you remember in air mass
thunderstorms, the downdraft gets in the way of the updraft
and leads to dissipation of the storm.
Sometimes
the tilted updraft will begin to rotate. A rotating
updraft is called a mesocyclone (Point
4). Meso
refers to medium size (thunderstorm size) and cyclone means
winds spinning around low pressure (tornadoes are sometimes
called cyclones). Low pressure in the core of the mesocyclone creates an inward pointing
pressure gradient force needed to keep the updraft winds
spinning in circular path.
The cloud that extends below the cloud
base and surrounds the mesocyclone
is called a wall cloud
(Point 5). The
largest and strongest tornadoes will generally come from the
wall cloud.
Note (Point 6)
that a tilted updraft also provides a way of keeping growing
hailstones inside the cloud. Hailstones get carried up
toward the top of the cloud where they begin to fall. But they then fall back into the strong core
of the updraft and get carried back up toward the top of the
cloud.
Here is a link to an exceptional time lapse video (http://www.mikeolbinski.com/timelapse/)
of a supercell thunderstorm in Texas from Mike Olbinski
again. Find the Supercell near Booker, Tx frame near the
bottom of the page. In time lapse you can see the rotation
of the wall cloud. If you watch closely you'll see another
interesting feature: moisture from air in the downdraft that
reaches the ground is drawn into the thunderstorm updraft
(starting at about 0:38 in the video up until the end of the first
segment of video). As the downdraft air moves upward cloud
begins to form.
It is worth trying to understand why the wall cloud surrounds the
mesocyclone and why it extends below the rest of the cloud.
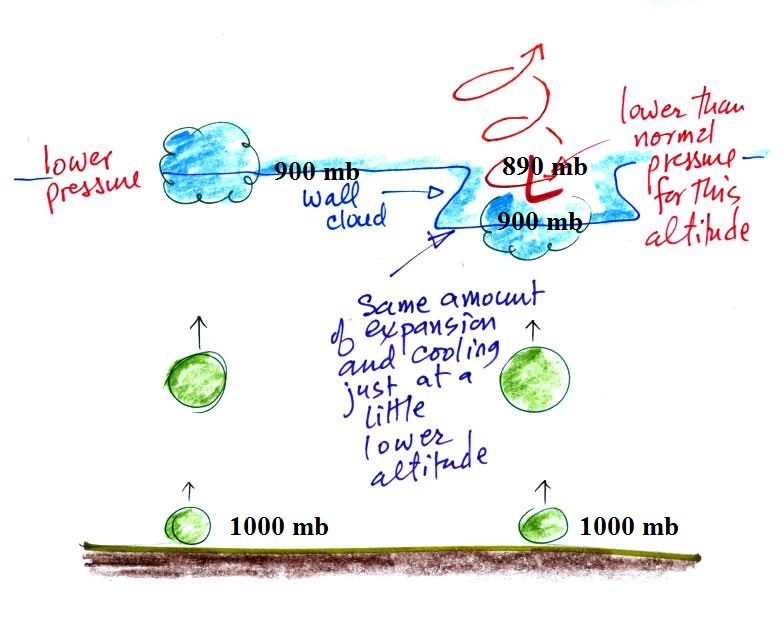
Air in the center of the rotating updraft has a little
lower pressure than the air surrounding it at the same
altitude. I've assumed that the pressure in the middle
of the mesocyclone at cloud base altitude is 890 mb. In
this part of the picture 900 mb pressure is found a little bit
closer to the ground. Thus air that rises into the
rotating updraft doesn't have to go as high before it
encounters 900 mb pressure and has expanded and cooled enough
to form a cloud.
A similar kind of thing happens in the formation of a tornado
cloud.
Weather radar and "hook
echoes"
Thunderstorms with rotating updrafts and supercell thunderstorms
often have a distinctive radar signature called a hook echo.
This is one of the ways that scientists are now able to
better detect and warn of tornadic thunderstorms
We haven't discussed
weather radar in this class. In some ways a radar image of
a thunderstorm is like an X-ray photograph of a human body.
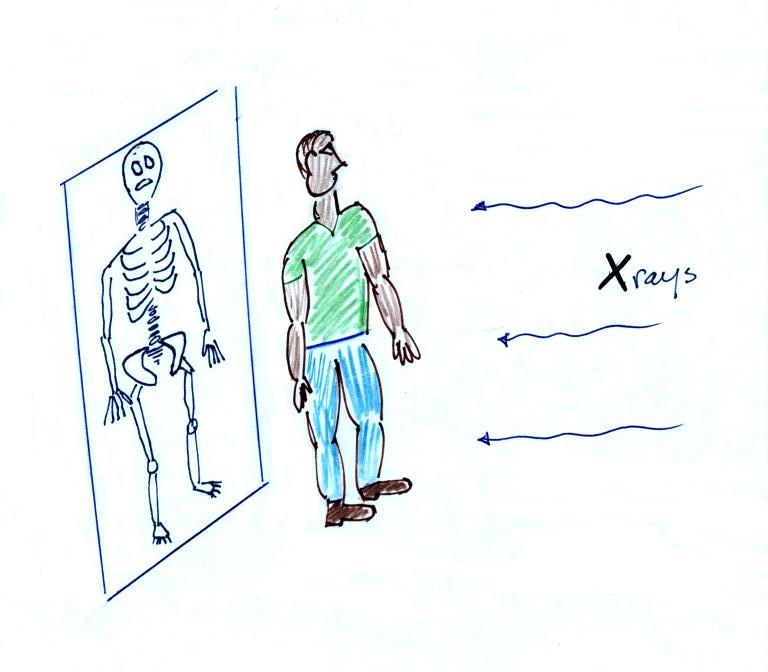
An X-ray image of a person doesn't usually
show the entire body, often just the bones and skeleton
inside.
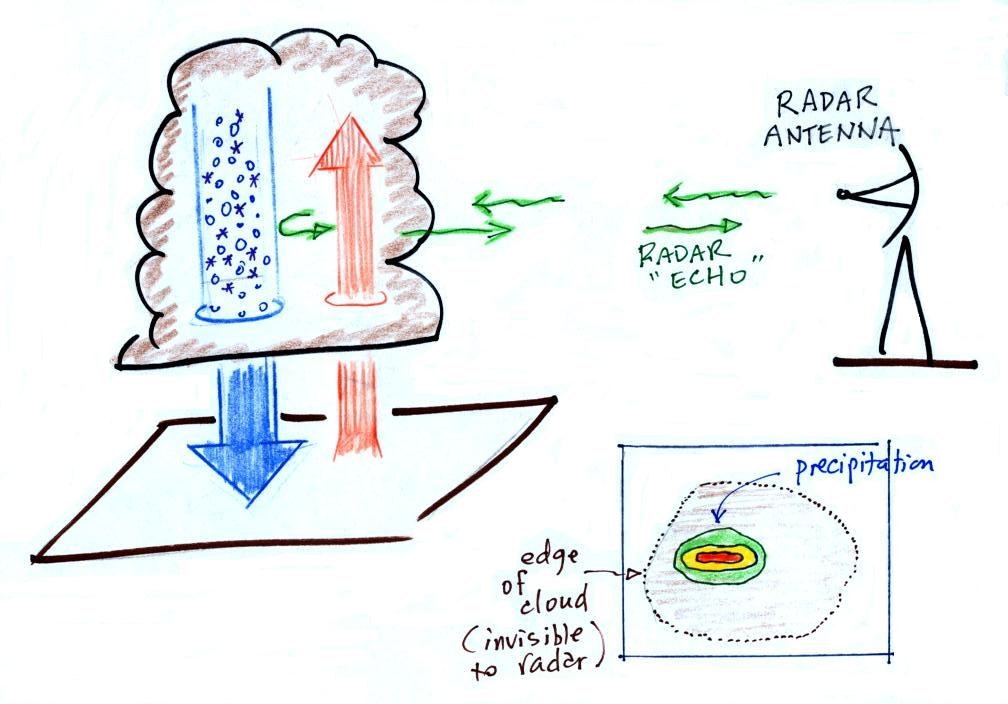
The
radio signals emitted by radar pass through the cloud itself
but are reflected by the much larger precipitation
particles. The radar keeps track of how long it takes for the
emitted signal to travel out to the cloud, be reflected, and
return to the radar antenna. The radar can use this to
determine the distance to the storm. It also knows the
direction to the storm and can locate the storm on a
map. The intensity of the reflected signal (the echo) is
often color coded. Red means an intense reflected signal
and lots of large precipitation particles. The edge of
the cloud isn't normally seen on the radar signal.
The amount and intensity of the precipitation is sometimes used
in Tucson during the summer to issue a severe thunderstorm
warning.
A Doppler radar (something we didn't
discuss in class) can detects small shifts in the
frequency of the reflected radar signal caused by precipitation
moving toward or away from the radar antenna. This can be
used to determine wind speeds inside the tornado.
Below is an actual radar image with a prominent hook
echo. The hook is evidence of large scale rotation inside
a thunderstorm and means the thunderstorm is capable of, and may
already be, producing tornadoes.
This is the radar image of a thunderstorm that
produced a very strong tornado that hit Oklahoma
City in May 1999
. The hook echo is visible near the lower left
hand corner of the picture. Winds in the tornado
may have exceeded 300 MPH. You can read more about this
tornado here.
And here is some storm chase
video of the tornado.
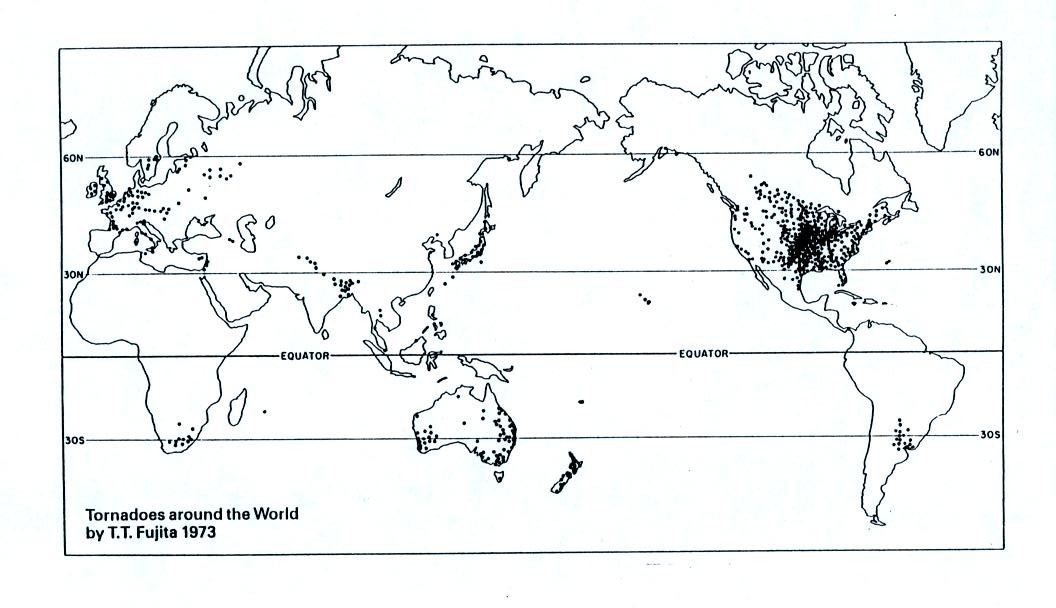
Tornadoes
The
United States
has roughly
1000 tornadoes
in an average
year, more
than any other country in
the world.
A
year's worth of tornado activity plotted
on a world map. Note
the name at bottom left: T.T. Fujita,
"Mr. Tornado." The
scale used to rate tornado strength and
intensity is named after him. A
comparable, more recent map can be found
at https://www.ncdc.noaa.gov/climate-information/extreme-events/us-tornado-climatology
This is mostly just a
consequence of geography.
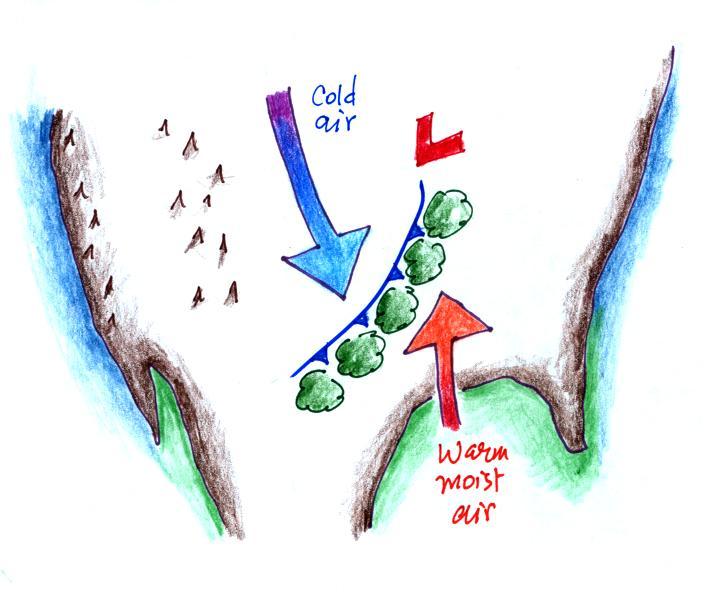
Without
any mountains in the way, cold dry air can
move in the spring all the way from Canada
to the Gulf Coast. There it collides
with warm moist air from the Gulf of Mexico
to form strong cold fronts and
thunderstorms. There are some other
meteorological conditions that come into
play that make these storms capable of
producing tornadoes.
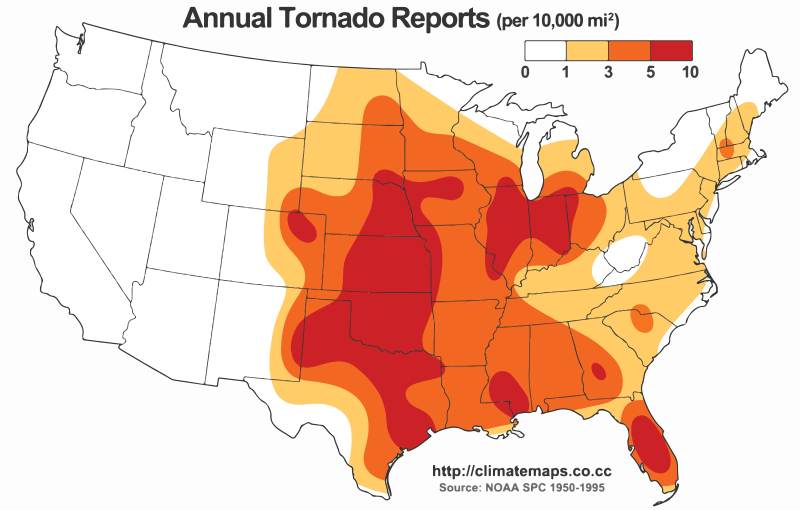
Tornadoes have been observed in every state
(though perhaps infrequently in Alaska), but
tornadoes are most
frequent in the Central Plains, a region
referred to as "Tornado Alley"
(highlighted in red, orange, and yellow
above).
This is where we ran out of
time in class today. I will leave
the following figure here and move all of the remaining
tornado notes to the Monday, Apr. 16 notes.
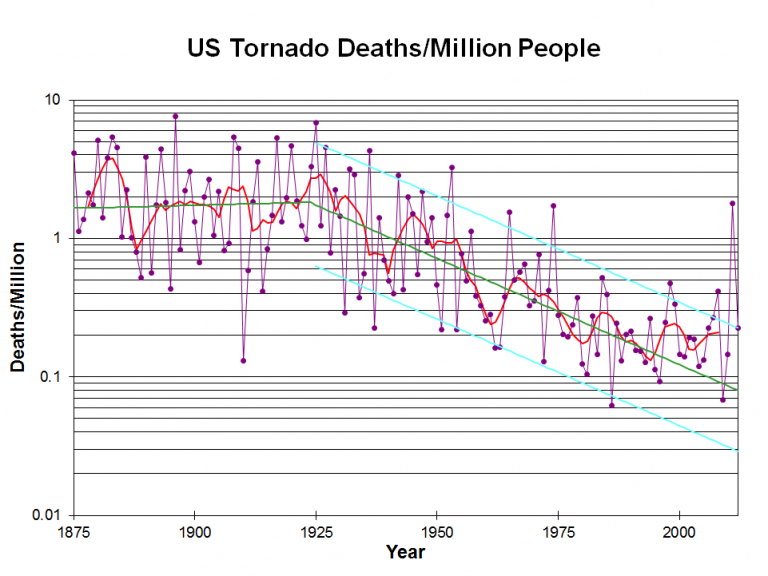
The figure above shows tornado
deaths per million people (from: https://blog.nssl.noaa.gov/nsslnews/2009/03/us-annual-tornado-death-tolls-1875-present/).
You can see a steady decline in fatalities beginning
around 1925. The number of deaths appears to
have leveled off at roughly 0.2 deaths per million
in the past decade or so (note the y-axis is a
logarithmic scale). This is roughly a
factor of 10 less than it was a century ago and is
due to much improved methods of detecting and
sending out warnings of tornadoes and severe
thunderstorms.
The currently population of the US is about 325
million, so 0.2 deaths/million x 325 million is 65
deaths per year.
Here are some data for the past several years (a
link to the 2018 data is included below). You
can see that every so often the United States
experiences a particularly deadly year. That
was the case in 2011. An EF5 tornado
struck Joplin, Missouri, on May 22 and killed 158
people (EF refers to the Enhanced Fujita Scale
rating).
Tornado
statistics for past few years
|
Year
|
No. of
confirmed tornadoes
|
No. of
deaths
|
2018
(ongoing)
|
148
|
2
|
2017
|
1418
|
35
|
2016
|
976
|
18
|
2015
|
1178
|
36
|
2014
|
928
|
47
|
2013
|
903
|
55
|
2012
|
939
|
69
|
2011
|
1697
|
553*
|
* second
largest death total in US history
You'll find a graphical display of the average annual
tornado frequency that extends back to 1995 at https://www.statista.com/statistics/203682/number-of-tornadoes-in-the-us-since-1995/