Haim "When
We Were Young" (3:32), "If
I Could Change Your Mind" (3:59), "Forever"
(4:05), "I'll
Try Anything Once" (3:32), "Right
Now" (4:30), "Hazy
Shade of Winter" (3:02), "Better
Off" (3:30)
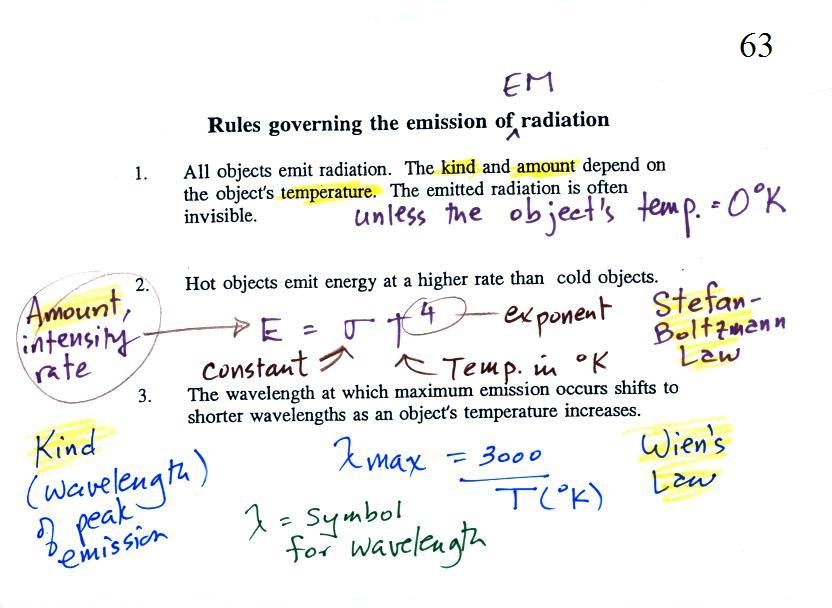
Rules governing the emission of EM radiation
We'll spend a big part of the
class learning about some rules governing the emission of
electromagnetic radiation. Here they are:
1.
Everything
warmer than 0 K will emit EM radiation. Everything in
the classroom: the people, the furniture, the walls and the
floor, even the air, are emitting EM radiation.
Often this radiation will be invisible so that we can't see it
and weak enough that we can't feel it (or perhaps because it
is always there we've grown accustomed to it and ignore
it). Both the amount and kind (wavelength) of the
emitted radiation depend on the object's temperature. In
the classroom most everything has a temperature of around 300
K and we will see that means everything is emitting
far-infrared (FIR) radiation with a wavelength of about 10µm.
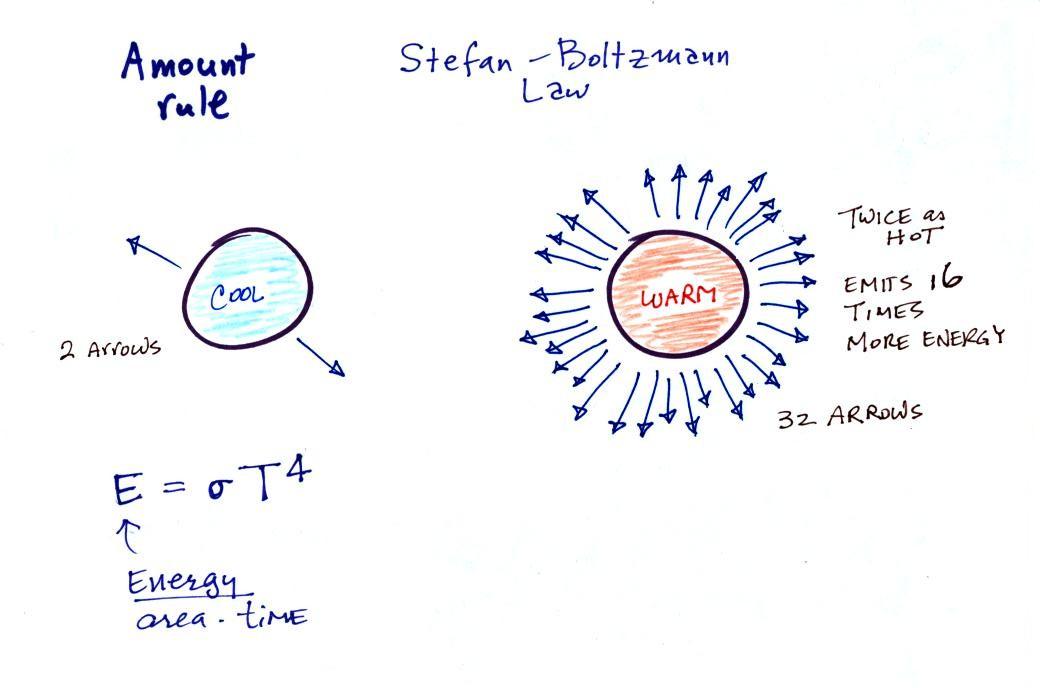
2.
The second rule allows you to determine the
amount of EM radiation (radiant energy) an object will
emit. Don't worry about the units (though they're given
in the figure below), you can think of this as amount, or
rate, or intensity. Don't worry about σ (the Greek character rho) either, it is
just a constant. The amount depends
on temperature to the fourth power. If the temperature
of an object doubles the amount of energy emitted will
increase by a factor of 2 to the 4th power (that's 2 x 2 x 2 x
2 = 16). A hot object just doesn't emit a little more
energy than a cold object it emits a lot more energy than a
cold object. This is illustrated in the following figure
(found on p. 64 in the ClassNotes):
The cool object is emitting 2 arrows worth of energy.
This could be the earth at 300 K. The warmer object is 2
times warmer, the earth heated to 600 K. The earth then
would emit 32 arrows (16 times more energy).
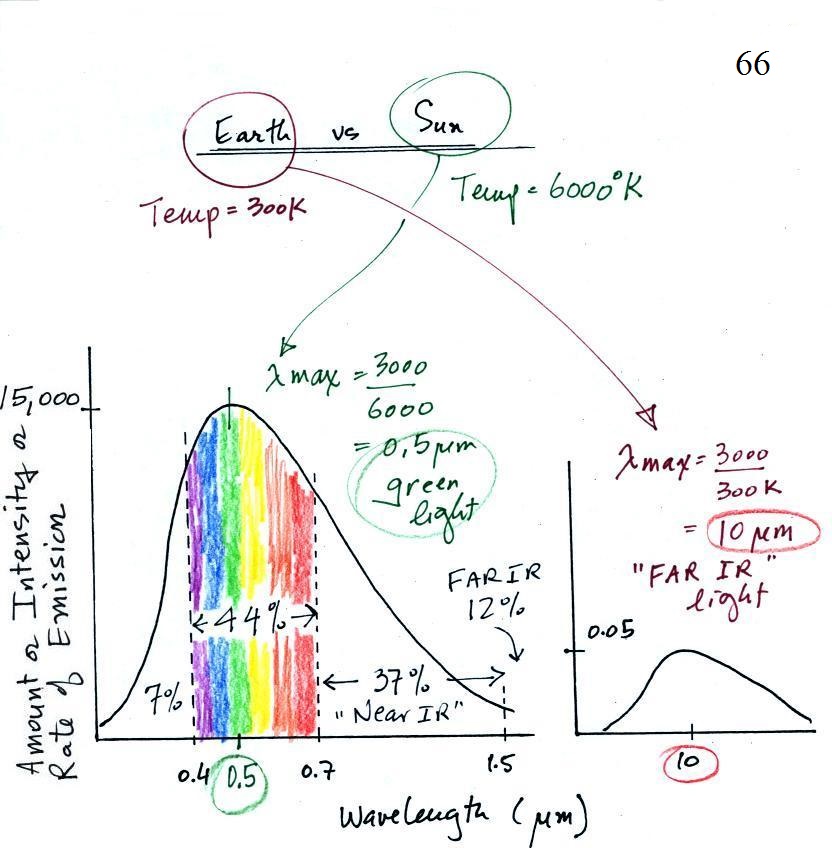
The earth has a temperature of 300 K. The sun is 20
times hotter (6000 K). Every square foot of the sun's
surface will emit 204 (160,000)
times more energy per second than a square foot of the
earth's surface.
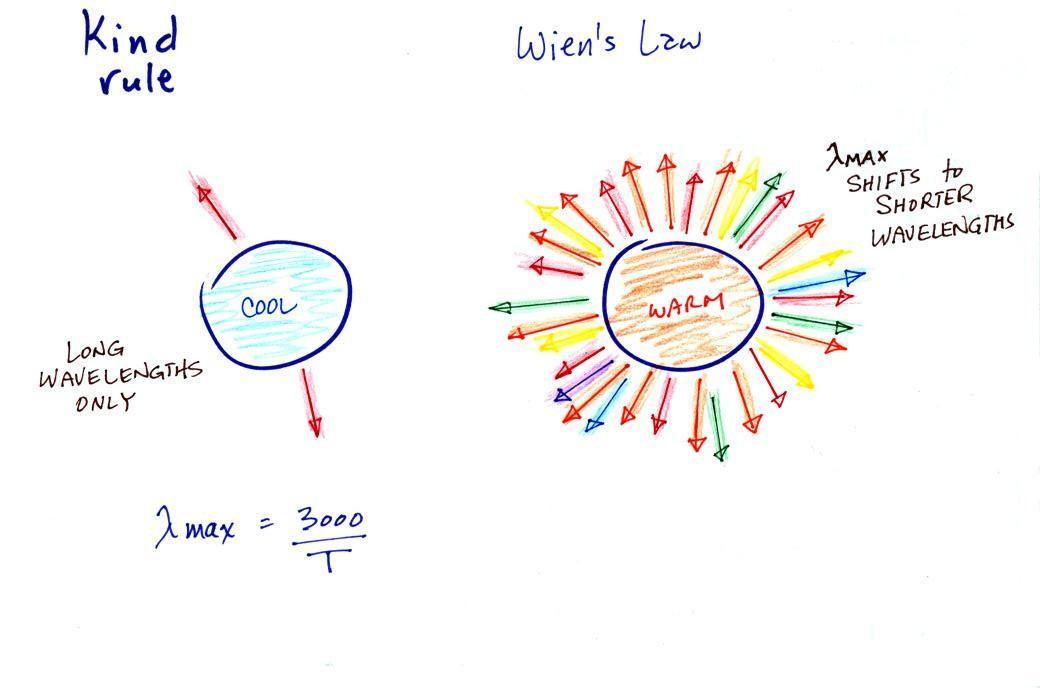
3.
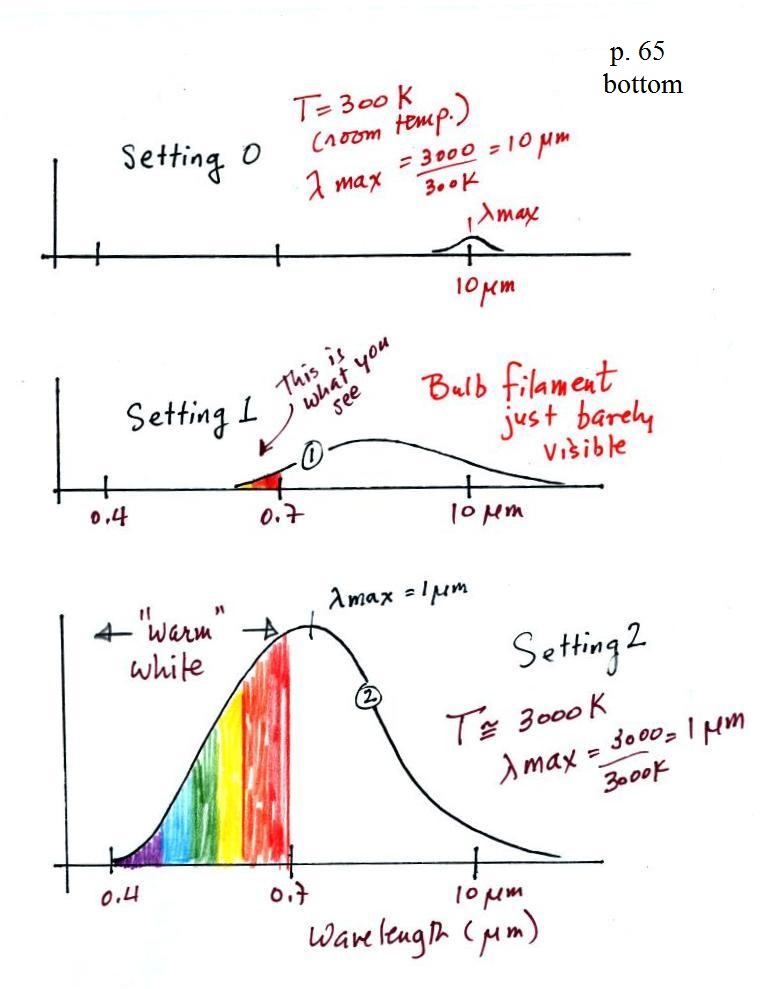
The third rule tells you something about the kind of
radiation emitted by an object. We will see that objects
usually emit radiation at many different wavelengths but not in
equal amounts. Objects emit more of one particular
wavelength than any of the others. This is called λmax
("lambda max", lambda is the Greek character used to represent
wavelength) and is the wavelength of maximum emission. The
third rule allows you to calculate λmax.
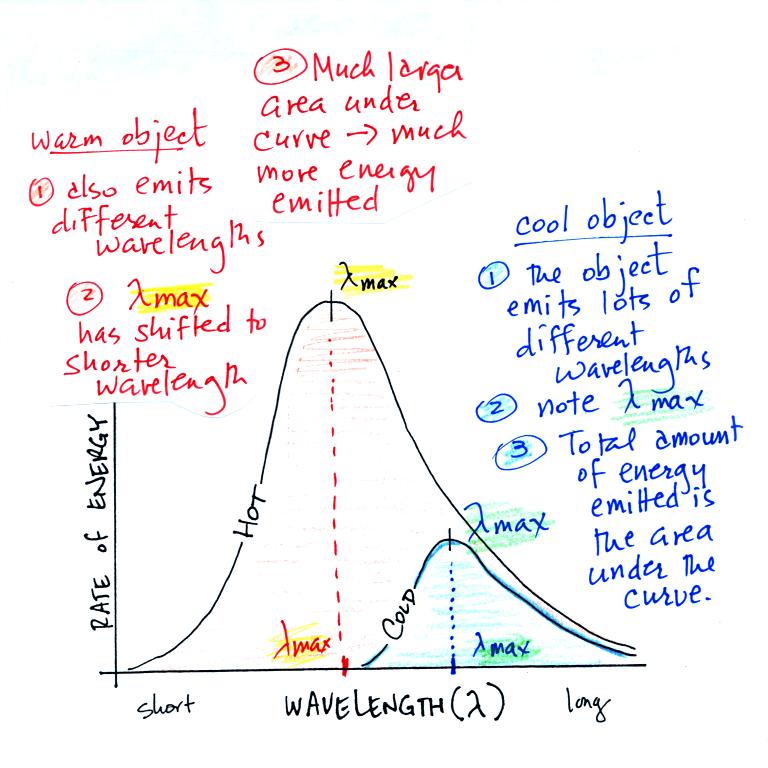
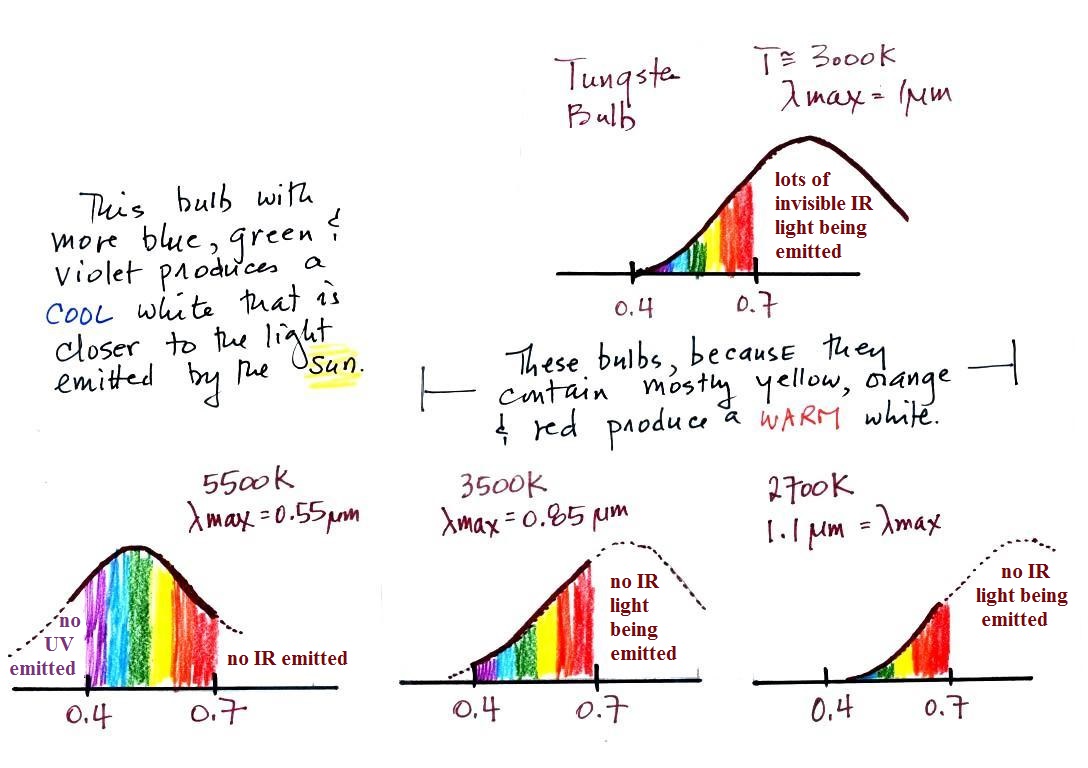
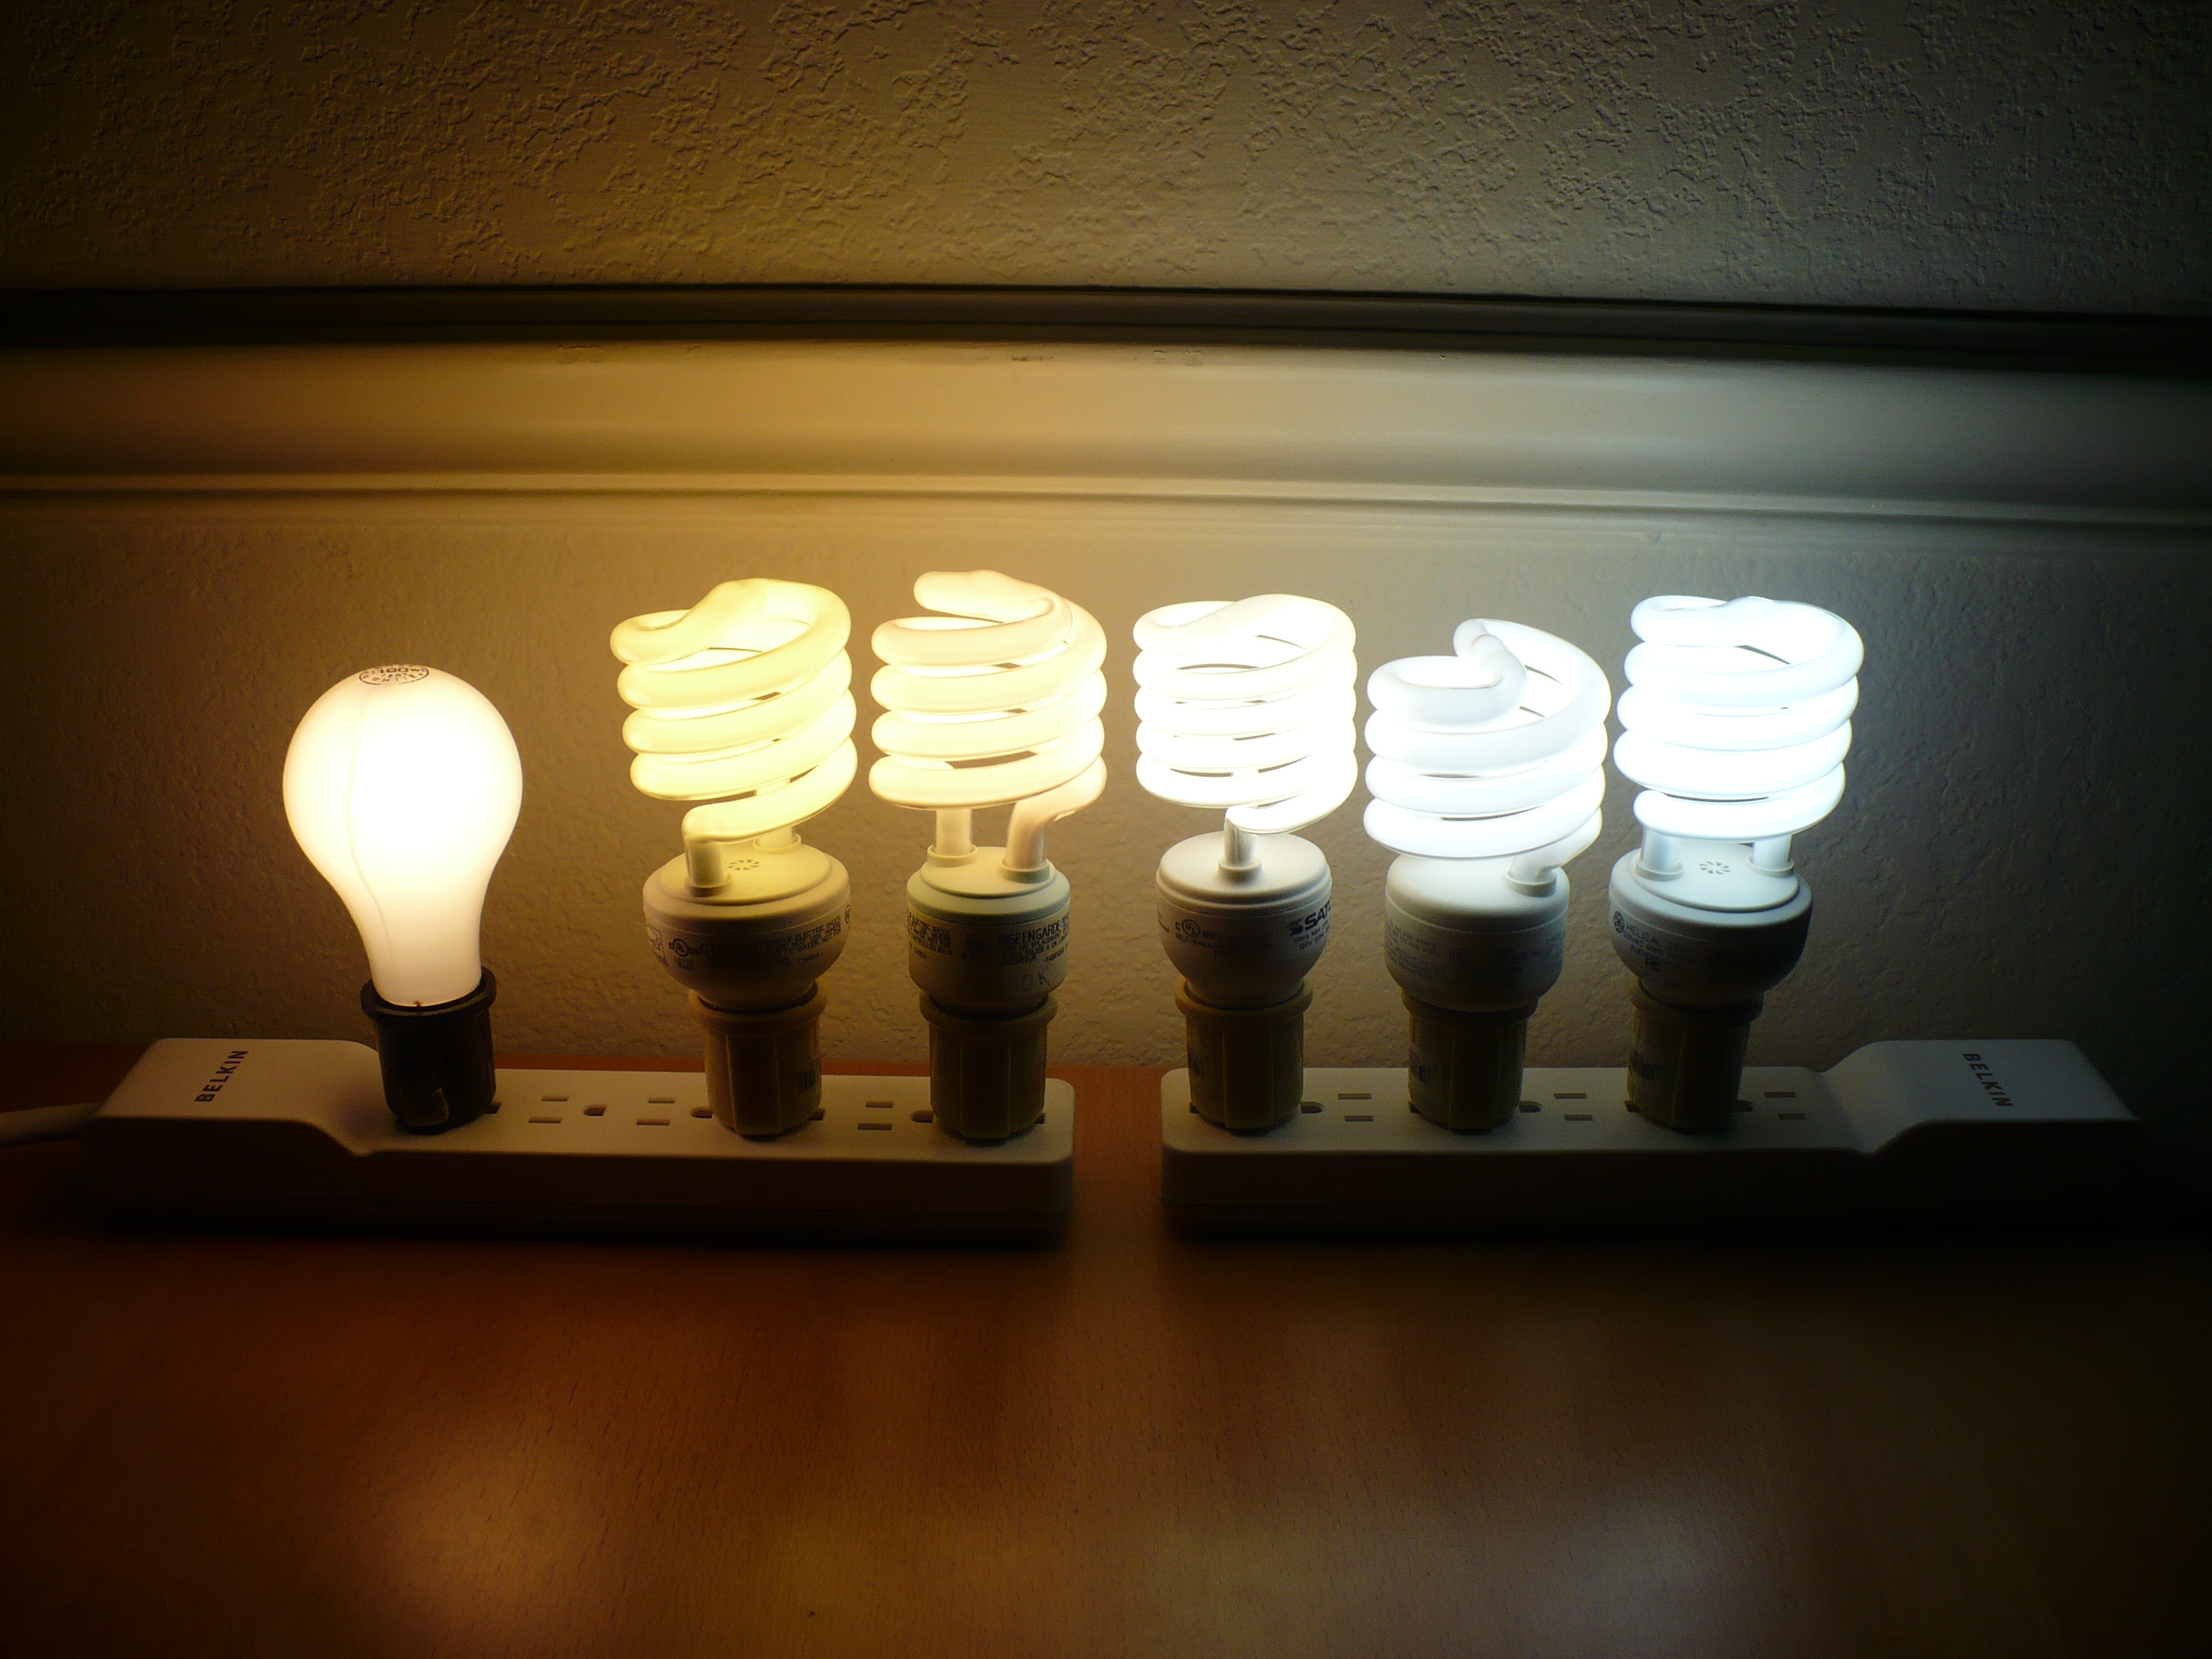
The tendency for warm objects to emit radiation at shorter
wavelengths is shown below.
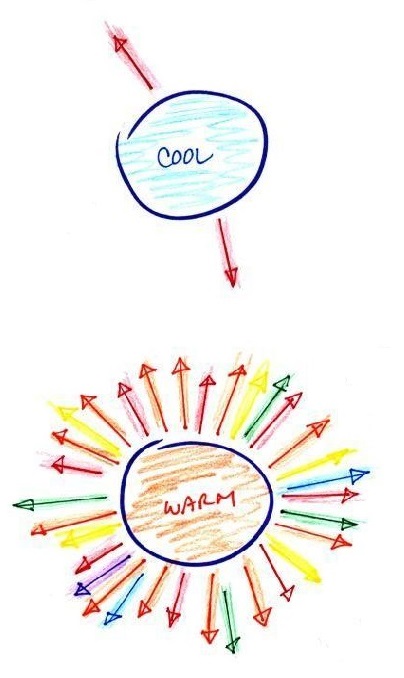
1.
Notice
first that both and warm and the cold objects emit radiation
over a range of wavelengths (the curves above are like quiz
scores, not everyone gets the same score, there is a
distribution of grades). The warm object emits all the
wavelengths the cooler object does plus lots of additional
shorter wavelengths.
2.
The peak of
each curve is λmax
the wavelength of peak emission (the
object emits more of that particular wavelength than any other
wavelength). Note that λmax
has shifted toward shorter wavelengths for the warmer
object. That is Wien's law in action. The warmer
object is emitting lots of types of short wavelength radiation
that the colder object doesn't emit.
3.
The area under the curve is the total radiant
energy emitted by the object. The area
under the warm object curve is much bigger than the area
under the cold object curve. This
illustrates the fact that the warmer object emits a lot more
radiant energy than the colder object.