Tuesday, Feb. 20, 2018
Monsieur Perine "La Muerte"
(3:31), "Llore"
(6:31), "Suin
Romanticon" (4:37), "Tu
M'as Promis" (5:30), "Nuestra
Cancion" (6:30)
Weather
changes that precede and follow passage of
a cold front
Here are some of the specific weather changes
that might precede and follow a cold
front.
Weather
variable
|
Behind
|
Passing
|
Ahead
|
Temperature
|
cool, cold,
colder*
|
|
warm
|
Dew
Point
|
usually much
drier**
|
|
may be moist
(though that is often
not the case here in the desert southwest)
|
Winds
|
northwest
|
gusty winds (dusty)
|
from the southwest
|
Clouds,
Weather
|
clearing
|
rain clouds,
thunderstorms
in a narrow band along the front
(if the warm air mass is moist)
|
might see some high
clouds
|
Pressure
|
rising
|
reaches a minimum
|
falling
|
* as mentioned
above, the coldest air might follow passage of a cold front by
a day or two.
**nighttime temperatures drop much more quickly in dry air
than in moist or cloudy air. This is part of the reason
it can get very cold a day or two after passage of a cold
front.
Gusty winds and a shift in wind direction are often one of the
most obvious change associated with the passage of a cold
front in Tucson.
The pressure changes that precede and follow a cold front are
not something we would observe or feel but are very useful
when trying to locate a front on a weather map.
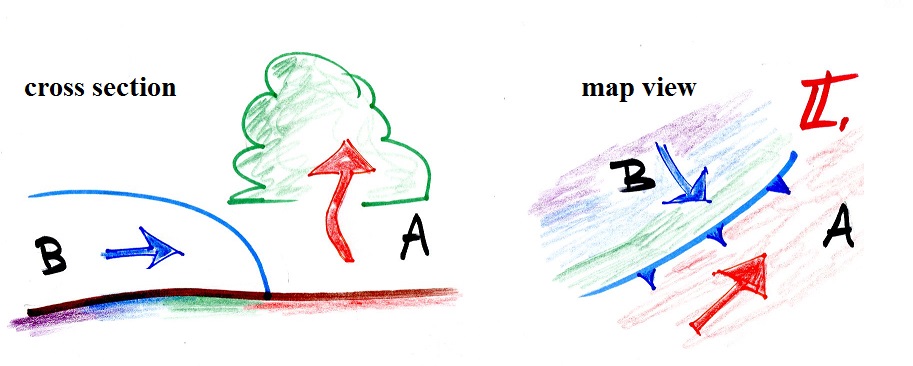
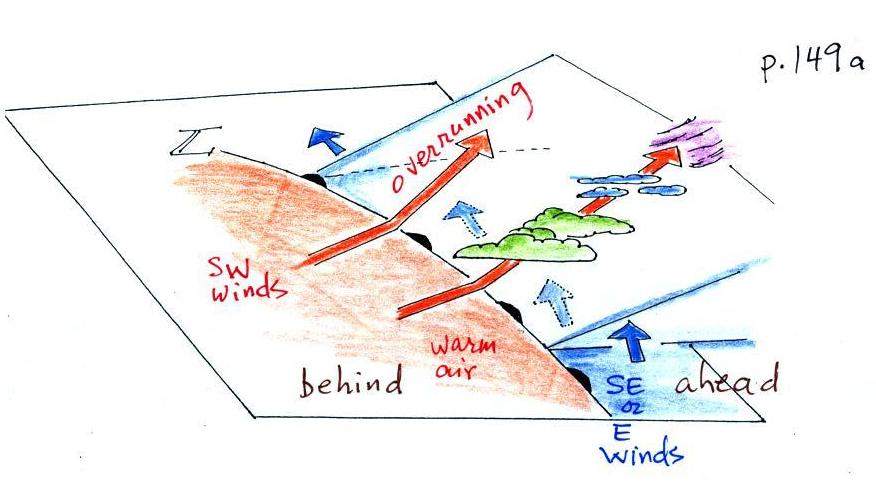
3-dimensional structure of warm fronts
We've learned a fair amount about cold fronts:
cross-sectional structure, weather changes that precede and
follow passage of a cold front, and how to locate a cold front
on a surface weather map. Now we have to
do the same for warm fronts.
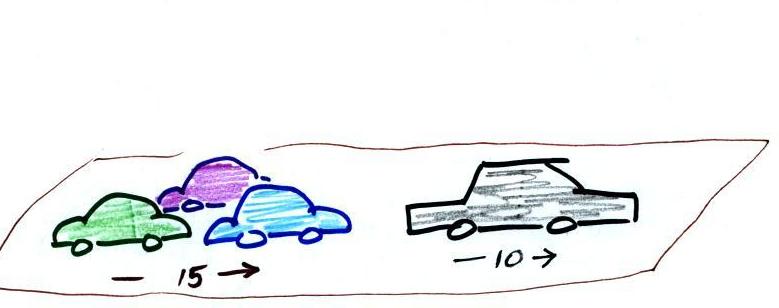
Warm air approaching and colliding with a cold air mass is
like a fleet of Volkswagens overtaking a Cadillac
The VWs are still lighter than the
Cadillac. What will happen when the VWs catch the
Cadillac?
They'll run up and over (overrun) the
Cadillac.
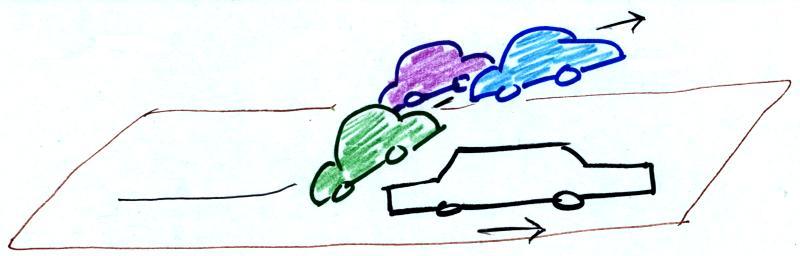
The same kind of thing happens along a warm front. Warm
air is overtaking some colder air that is also moving to the
right.
The approaching warm air is still less dense than the cold air and
will overrun the cold air mass.
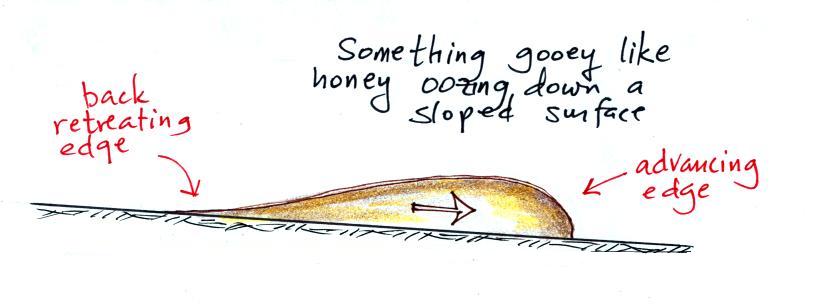
There's one key difference between cold and warm front
boundaries
1. The back edge of a
retreating cold mass that the warm air overtakes has a much
different shape than the advancing edge. The advancing
edge bunches up and is blunt. The back edge gets
stretched out and has a more gradual ramp like shape.
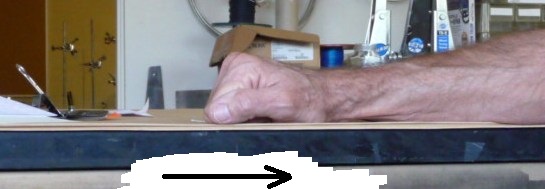
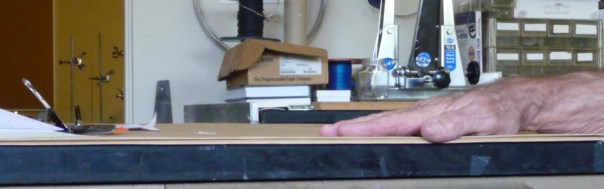
You can use your hand and arm again.
You start with your fingers curled up
then move your arm and hand to the right.
As your arm moves to the
right, friction uncurls your fingers.
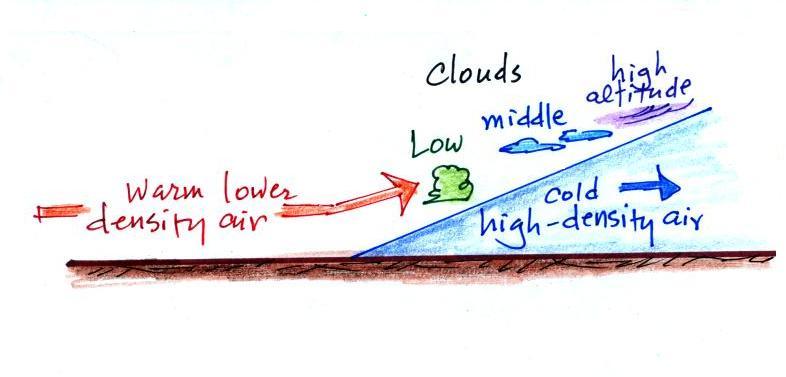
The warm air rises more slowly
and rises over a much larger area out ahead of the warm
front. A variety of cloud types form and spread out
over a large area ahead of the warm front. This is
an important difference between warm and cold fronts.
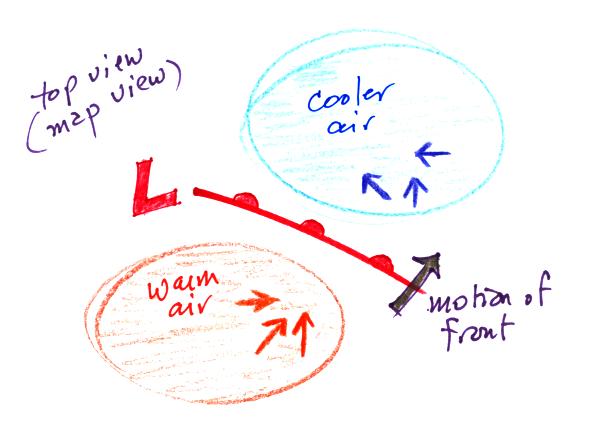
Weather changes
that precede and follow passage of a warm front
Here's the 3-dimensional view again that's in the ClassNotes.
and the map view
Here are the kinds
of weather changes that usually precede and follow
passage of a warm front.
We'll probably go through this fairly quickly in class.
Weather
Variable
|
Behind
(after)
|
Passing
|
Ahead
(before)
|
Temperature
|
warmer
|
|
cool
|
Dew point
|
may be moister
|
|
drier
|
Winds
|
SW, S, SE
|
|
from the East or
SE, maybe even the S
|
Clouds,
Weather
|
clearing
|
|
wide
variety of clouds that may precede arrival of the front
by a day or two
clouds may produce a wide variety of types of
precipitation also
(snow, sleet, freezing rain, and rain)
|
Pressure
|
rising
|
minimum
|
falling
|
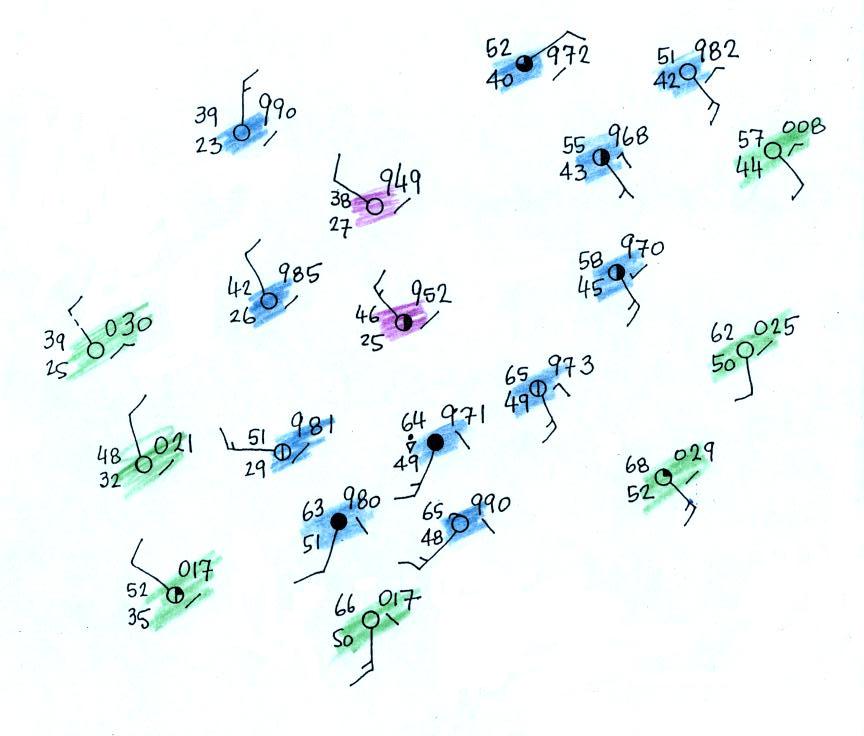
Locating a cold front on a weather map
In the next figure we
started with some weather data plotted on a surface
map using the station model notation. We'll try
to make a little more sense of this data and
eventually locate a cold front. Study this
example carefully because you will have an opportunity
to do a surface weather map analysis of your own and
will be able to earn some 1S1P points or Extra Credit
points.
Step #1 - draw in some isobars and ocate the low
pressure center
In
some respects fronts are like spokes on a
wheel - they rotate counterclockwise around
centers of low pressure. It makes sense
to first locate the center of low
pressure. To do that we
need to draw in a few isobars and map out
the pressure pattern.
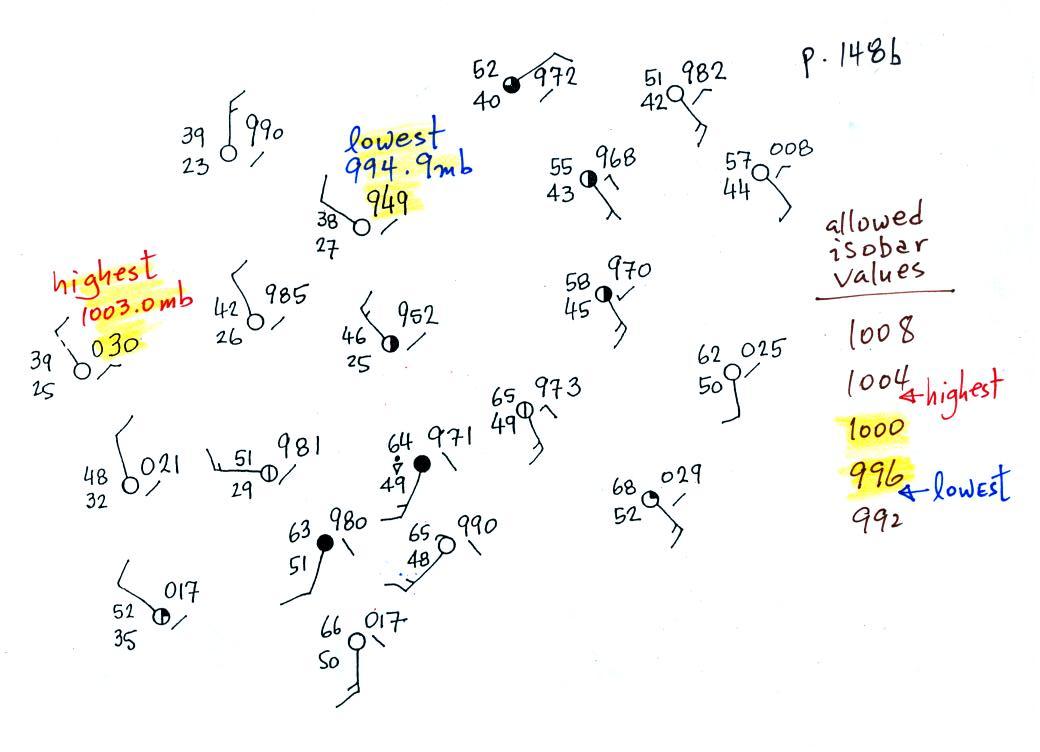
Isobars are drawn at 4 mb increments above and
below a starting value of 1000 mb. Some of the allowed
values are shown on the right side of the figure (992, 996, 1000,
1004, 1008 etc). The highest pressure on the map is
1003.0 mb, the lowest is 994.9 mb. You must choose from
the allowed list of isobar values and pick only the values
that fall between the high and low pressure values on the
map. Thus we only need to draw in 996 mb and 1000
mb isobars.
Step #1 cont'd
Color coding the plotted pressure values may be
helpful. In
the figure below stations with pressures lower than
996 mb have been colored in purple.
These will be enclosed by the 996 mb contour.
Pressures between 996 and 1000 mb have been colored blue. These
stations will lie outside the 996 mb contour but
inside the 1000 mb isobar. Finally stations with
pressures greater than 1000 mb have been colored green. The 1000
mb isobar will separate the blue stations from the
green stations.
End
of Step #1
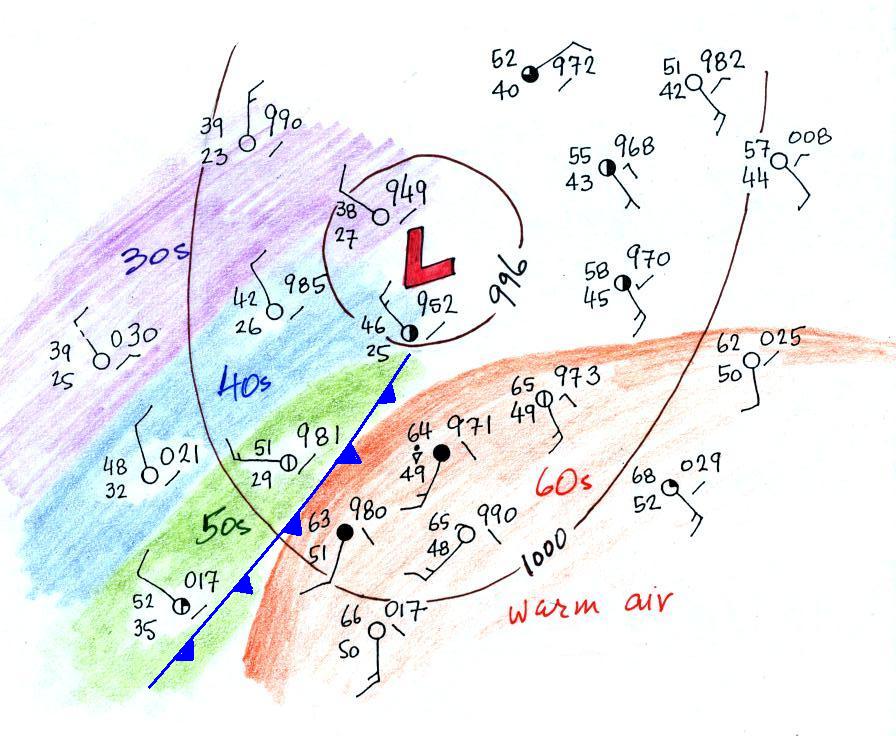
The map below shows the same picture
with the 996 mb and 1000 mb contours
drawn in (it is always a good idea to
label the isobars when you draw them
in).
Step
#2 - locate the warm air mass
The
next step was to try to locate the
warm air mass in the picture.
I'll start with a new map for clarity
that keeps the isobars. The
colors now will represent different
air temperatures.
Temperatures
are in the 60s in the lower right portion of the map;
this area has been circled in orange. Cooler air
to the west of the Low pressure center has also been
identified. Do the green, blue, purple (cool,
cold, colder) bands look familiar? Based on just
the temperatures we have a pretty good idea where a
cold front would be found.
Step #3 - draw in a tentative location for
the cold front
Locating and drawing in the cold front.
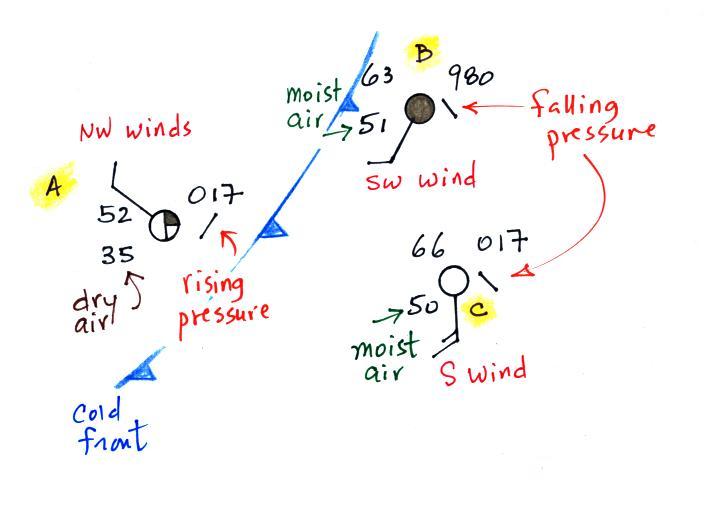
Step
#4 - double check the front location
We should
double check the front location using some of the
other weather changes (wind shift, dew point, pressure
change etc.) that precede and follow a cold front.
The air ahead of the front (Pts. B & C) is
warm, moist, has winds blowing from the S or SW, and the
pressure is falling. These are all things you would
expect to find ahead of a cold front.
Overcast skies are found at Pt. B. very near the front.
The air behind the front at Pt. A is colder, drier, winds are
blowing from the NW, and the pressure is rising. That is
just what you would expect behind a cold front. So our
location of the front looks pretty good.
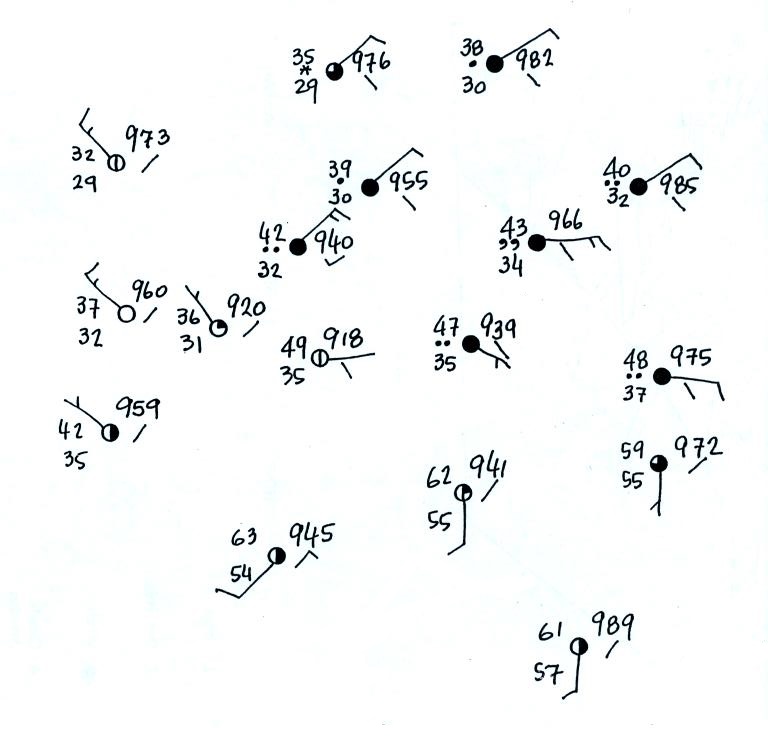
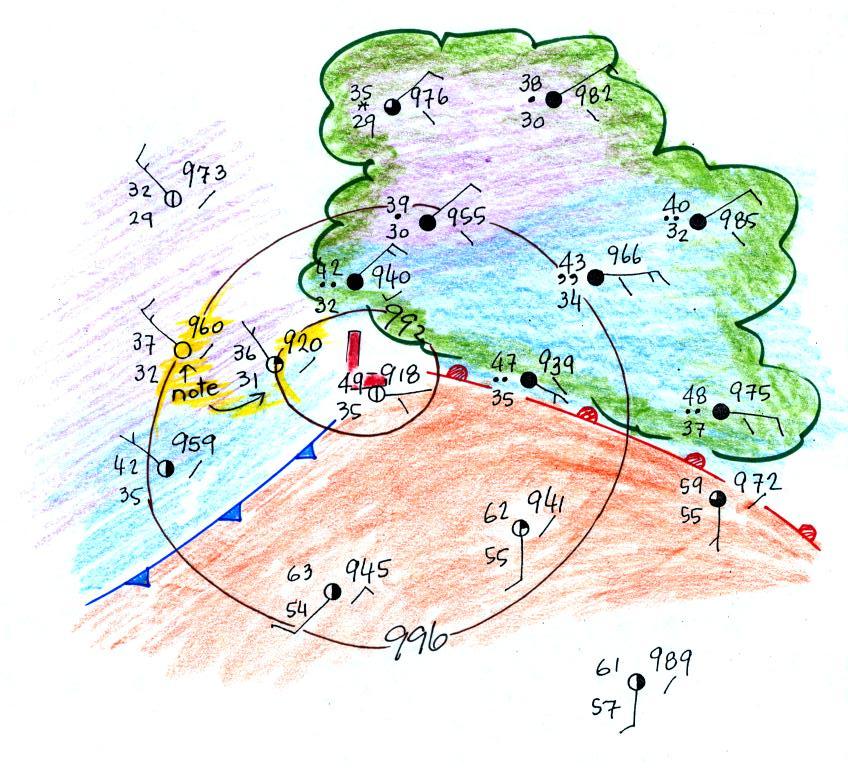
Locating
a warm front on a weather map
We need to finish our study of
surface weather maps by trying to located a warm front.
This is the map we will be working with
(see p. 149b in the ClassNotes). It's worth pausing
and noting that you really can't make any sense out of this
jumble of weather data at this point.
Step #1 - draw in some
isobars and locate the low pressure center
We'll start by drawing some isobars to map out the
pressure pattern. A partial list of allowed isobars is
shown at the right side of the map above (increments of 4 mb
starting at 1000 mb).
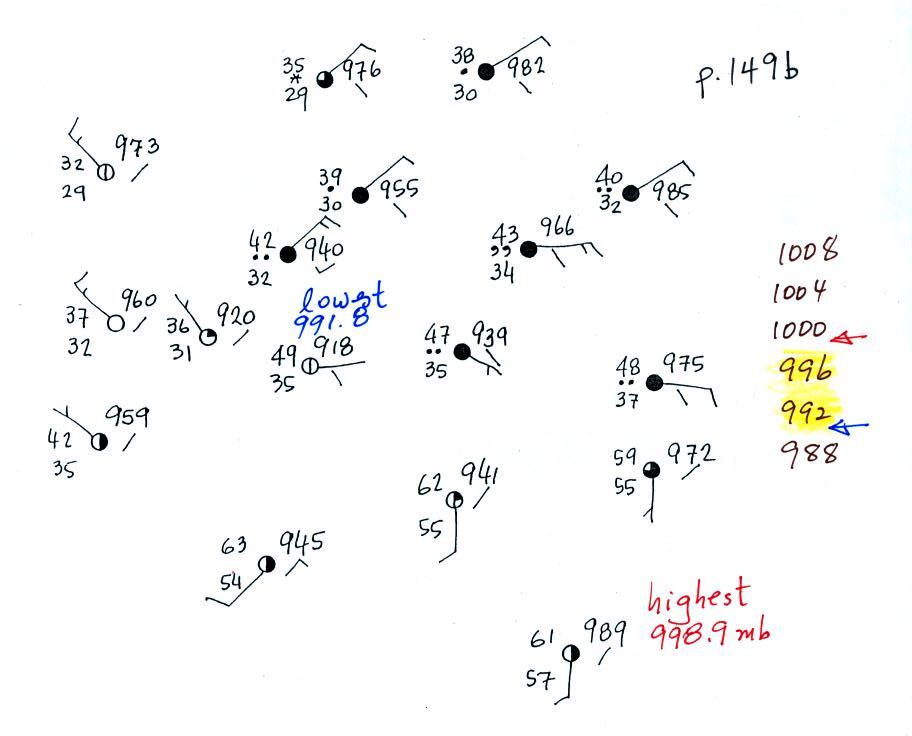
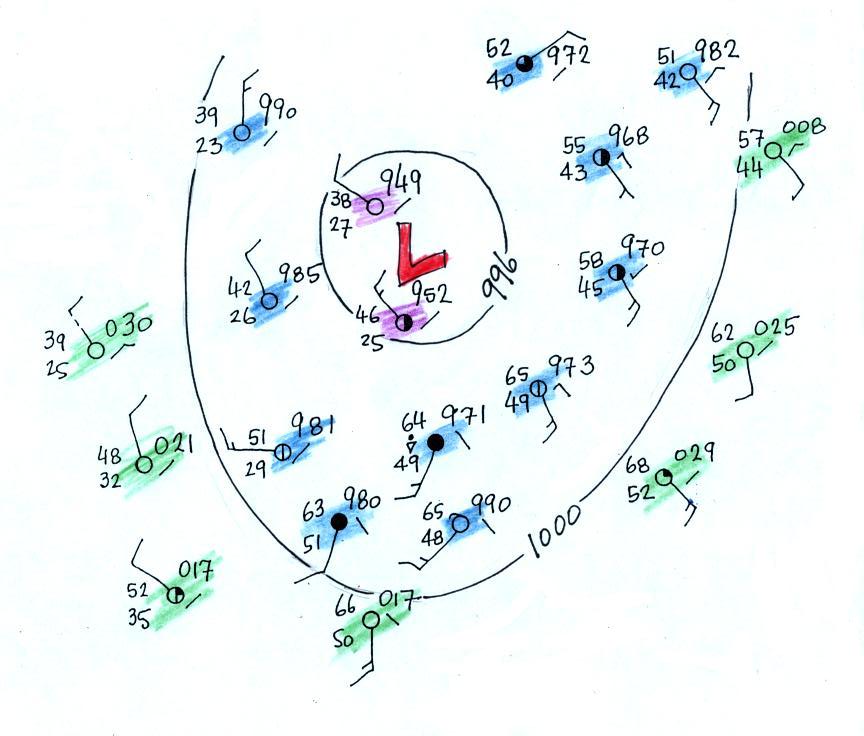
We've located located the highest and
lowest pressure values on the map. Then we choose
allowed isobar values that fall between these limits.
In this case we'll need to draw 992 mb and 996 mb isobars.
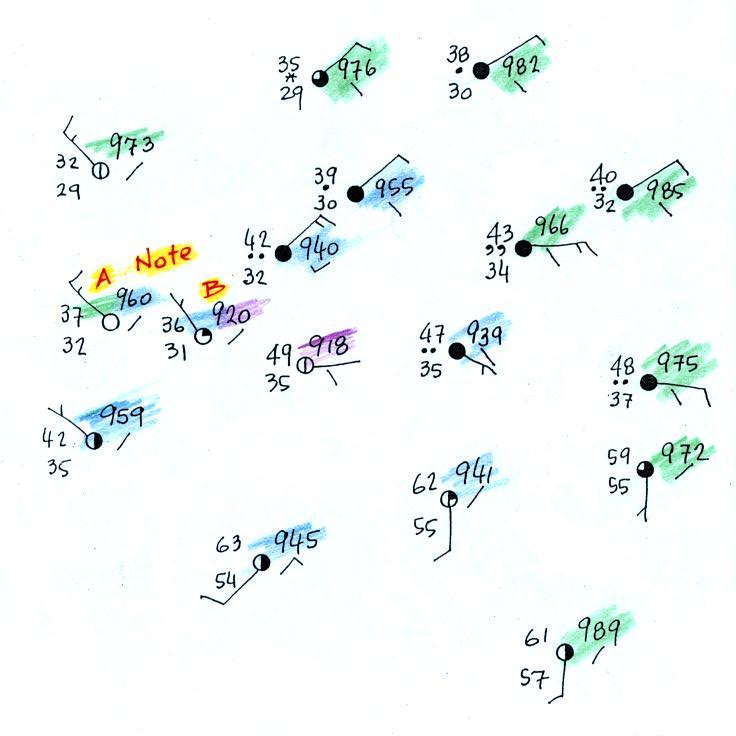
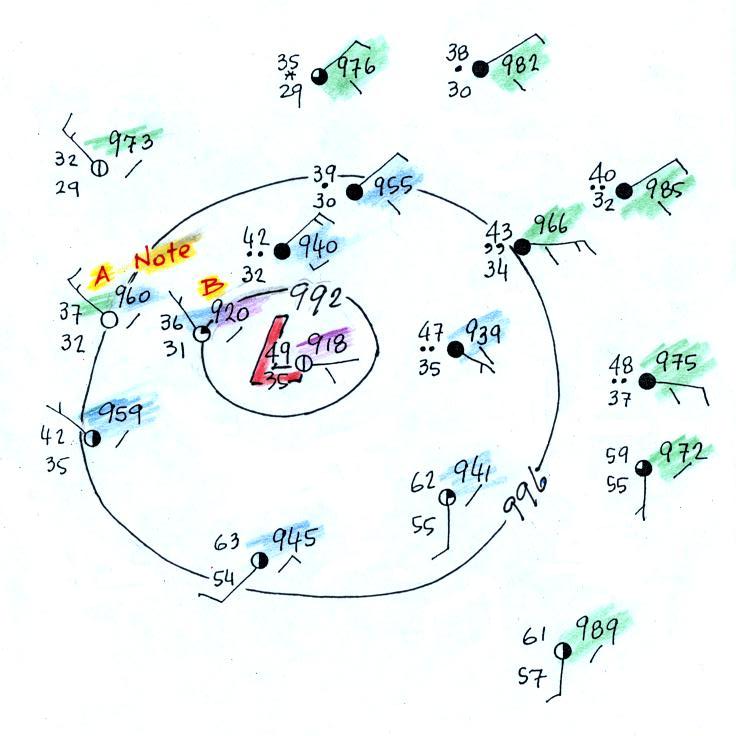
Here's the map with color coded pressures.
Pressures less than 992 mb are purple,
pressures between 992 and 996 mb are blue, and pressures greater
than 996 mb are green.
Note that station B has a pressure of exactly 992.0 mb, the
992 mb isobar will go through that station. The 996 mb
isobar will go through station A because it has a pressure
of exactly 996.0 mb.
Here's the map with the isobars drawn
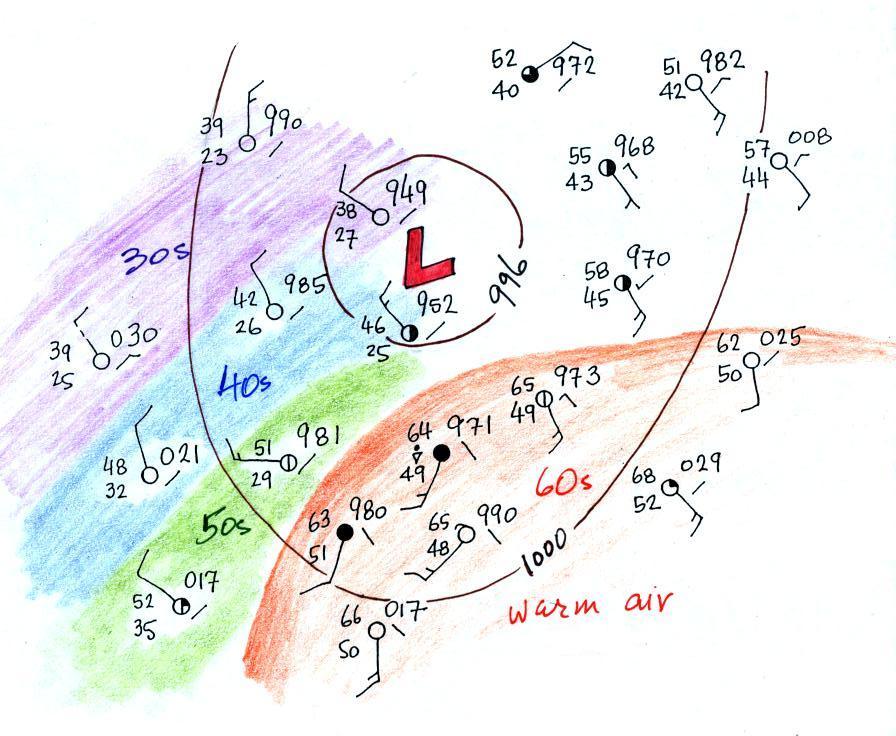
in. On the map below we use colors to locate the warm
and cooler air masses.
Step #2 - locate the warm air mass
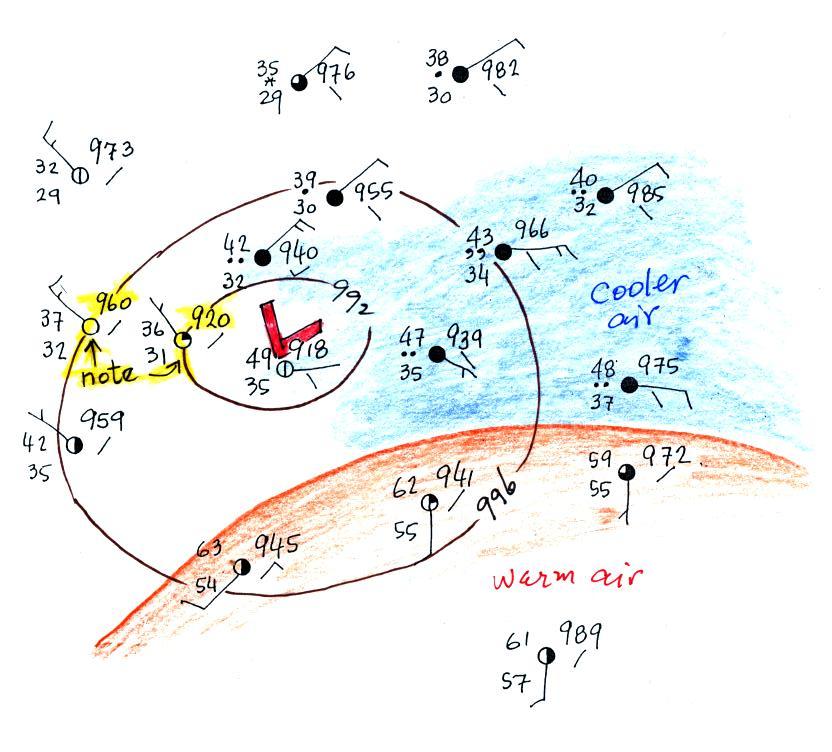
The warm air mass has been colored in orange.
Cooler air east of the low pressure center is blue.
Can you see where the warm front should go?
Step #3 - draw in a tentative warm
front location
Here's the map with a warm front drawn in
(the map was redrawn so that the edge of the warm
(orange) air mass would coincide with the warm
front).

The change in wind directions was probably
more pronounced than the temperature change. Most of the
clouds outlined in green are probably being produced by the
warm front. You can see how more extensive cloud
coverage is with a warm front.
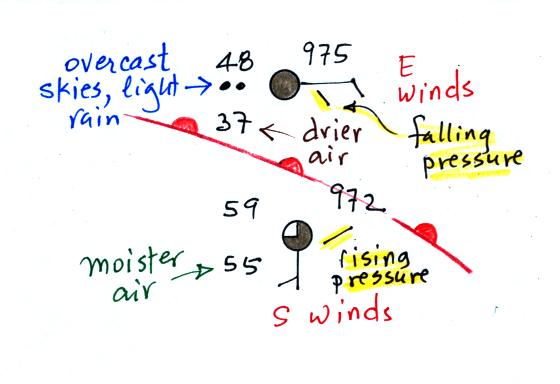
Step #4 - double check the
front location
Two of the stations near the right edge of the
picture and on opposite sides of the front are redrawn below.
The station north of the front has cooler and drier air,
winds are from the east, skies are overcast and light rain is
falling. The pressure is falling as the warm front
approaches. These are all things you'd expect to find
ahead of a warm front. Behind the front at the southern
station pressure is rising, the air is warmer and moister, winds
have shifted to the south and the skies are starting to clear.
In this case there is a Step #5 -
have a look at the rest of the surface map
Have a look at the
left, western, side of the map. There's pretty good
evidence of a cold front.
There's a big temperature change (low 60s to low 40s and 30s)
and a very noticeable wind shift (SW ahead of the cold front and
NW behind).
Upper Level Charts - Basic Features
There is an Assignment that
accompanies this 3-part reading material on Upper Level Charts.
You'll be able to earn extra credit points or points that will be
added to your next quiz score. We'll only cover Upper-level
charts Pt. 1 in class. Here are links to Pt. 2 and Pt. 3.
We've been spending some time learning about surface weather
maps. Maps showing conditions at various altitudes above the
ground are also drawn. Upper level conditions can affect the
development and movement of surface features (and vice versa).
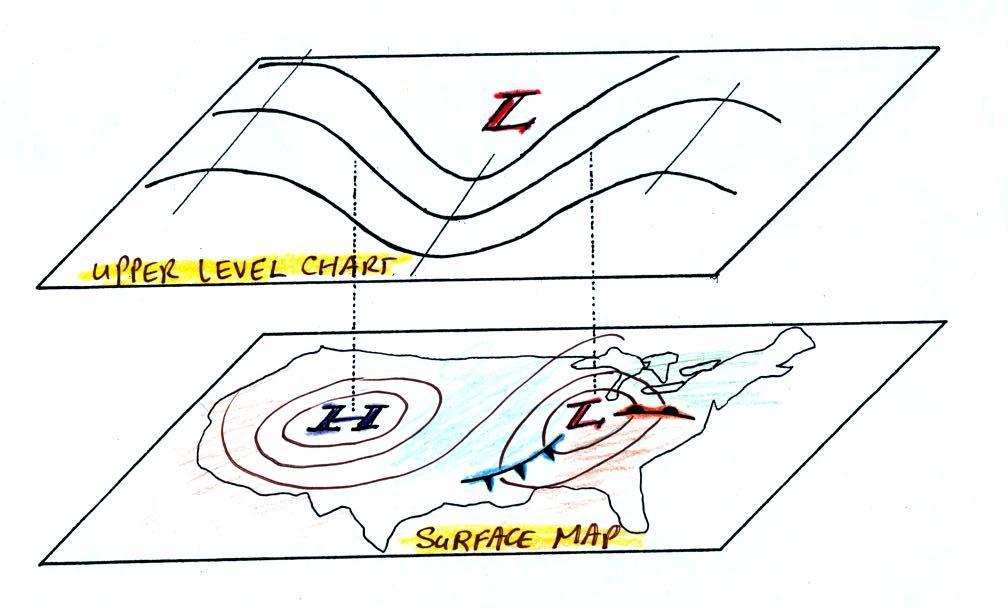
In this first section we'll
just learn 3 basic facts about upper level charts. First
the overall appearance is somewhat different from a surface
weather map. The pattern on a surface map can be complex
and you generally find circular (more or less) centers of high
and low pressure (see the bottom portion of the figure
below). You can also find closed high and low pressure
centers at upper levels, but mostly you find a relatively
simple wavy pattern like is shown on the upper portion of the
figure below (sort of a 3-dimensional view)
A simple upper
level chart pattern is sketched below (a map view).
There are two basic features: wavy lines that dip southward
and have a "u-shape" and
lines that bend northward and have an "n-shape".
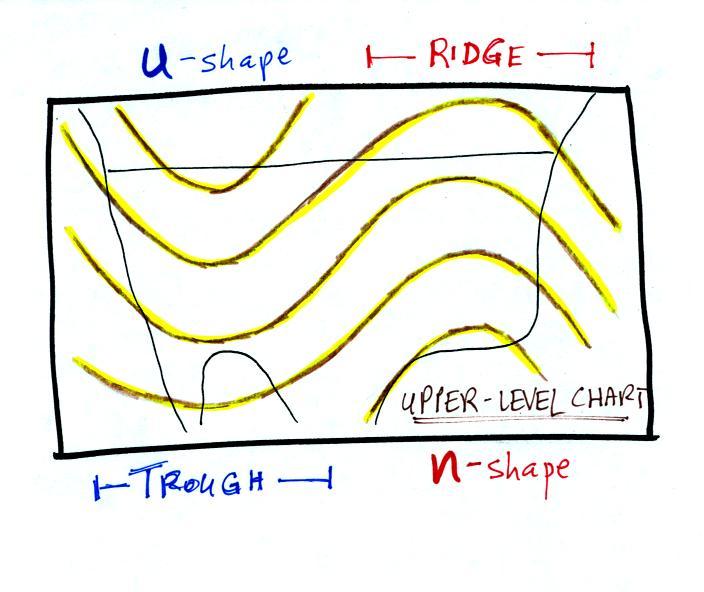
The u-shaped portion
of the pattern is called a trough. The n-shaped portion is called
a ridge.
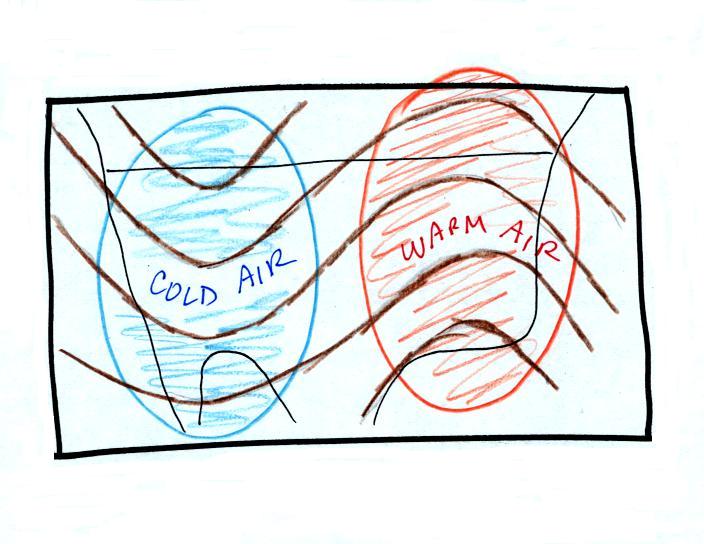
Troughs are produced by large volumes of cool or cold
air (the cold air is found between the ground and the upper
level that the map depicts). The western half of the
country in the map above would probably be experiencing colder
than average temperatures. Large volumes of warm or hot
air produce ridges. We'll see why this is true in "Upper
level charts pt. 2".
|
|
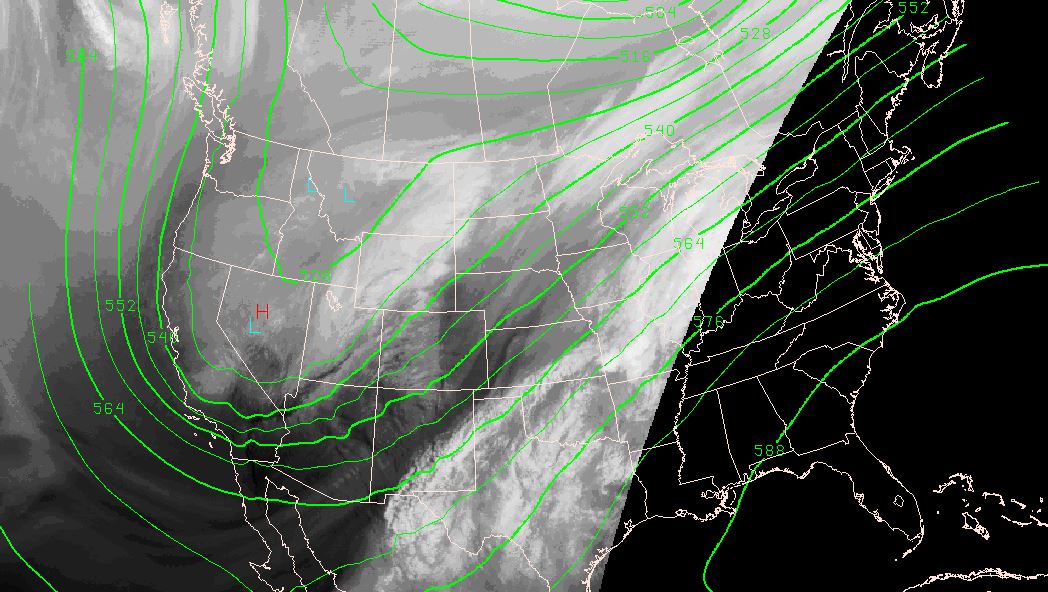
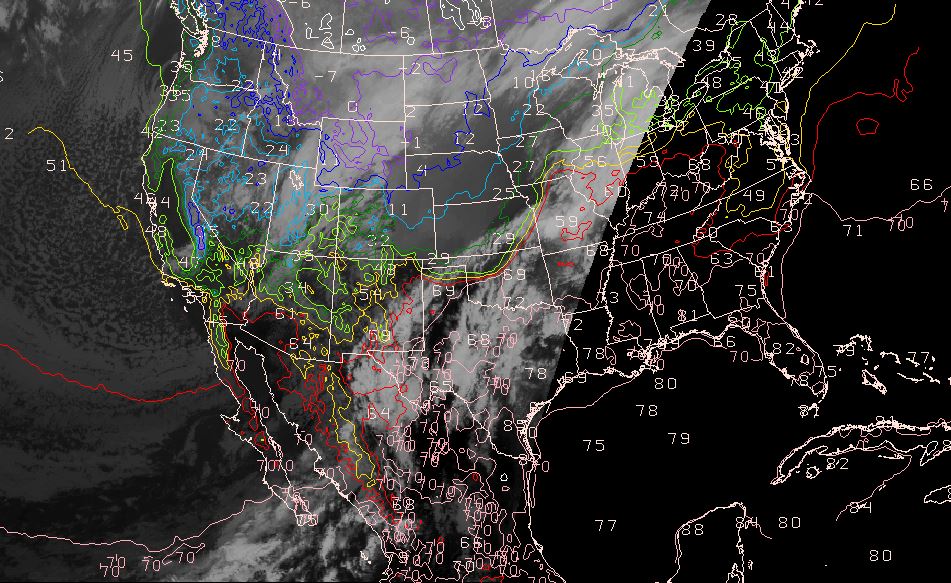
The 500 mb upper level chart for Monday
Feb. 19, 2018. Note the trough positioned over the
western states.
|
2 pm surface temperatures for Monday,
Feb. 19 (18Z = 11 am MST). At a given latitude,
temperatures do seem to be somewhat cooler under the
trough over the western third of the US (blue and green
colors) compared to the eastern portion of the US (yellow
and red isotherms).).
|
Yesterday's
rainy weather was associated with a trough that had formed over
the western US. The trough is the dominant
feature in the figure above at left. The figure at right
shows 2 pm surface temperatures being reported early yesterday
afternoon. There does seem to be a tendency for cooler
temperatures to be found under and in the vicinity of the
trough.
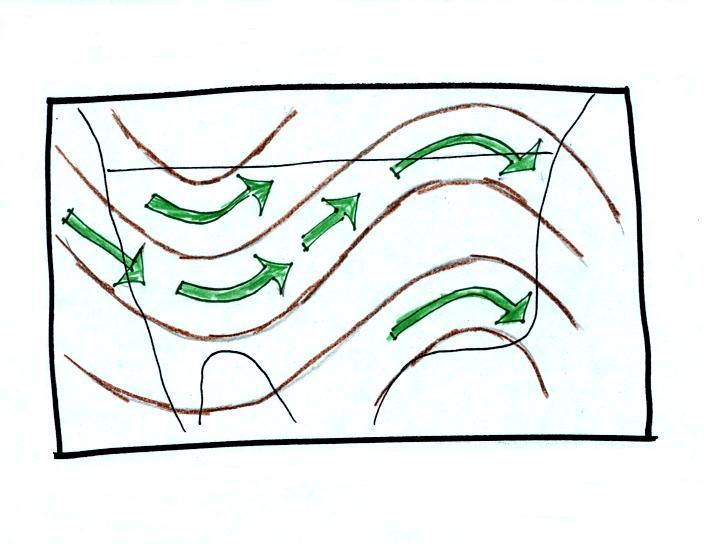
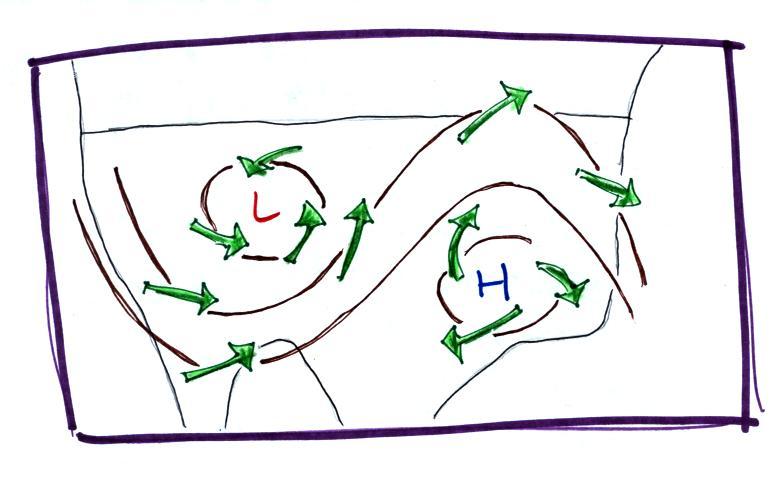
The winds on upper level charts blow parallel to
the contour lines generally from west to east. This is a
little different from surface winds which blow across the
isobars toward low pressure. An example of surface winds
is shown below.
That's it for this first section. Really all you need to
be able to do is
1. identify troughs and ridges,
2. remember that troughs are associated with cold air & ridges
with warm air, and
3. remember that upper level winds blow parallel to the contour
lines from west to east.