Sprites, blue jets, and elves
The preferred term for these types of events is Transient
Luminous Event (TLE).
In
a 1924 paper, C.T. Wilson suggested that "The electric
field of the [thunderstorm] cloud may cause ionization at
great heights..." "At a height of 60 km, the density of
the air is about 1.6 x 10⁻⁴ of that near the
ground, while the composition of the air is not very
different, so that the critical value of the field may be
taken as about 30,000 x 1.6 x 10-4 = 4.8 volts per
centimetre."
Despite many reports of optical phenomena high above
thunderstorms (often from pilots flying at night), credit for
the first photographic evidence of these kinds of phenomena is
given to John Winckler, a researcher at the University of
Minnesota. On the night of July 6, 1989 he was testing a
low light level video camera and later found two images of
sprites on the video he had recorded (ref).
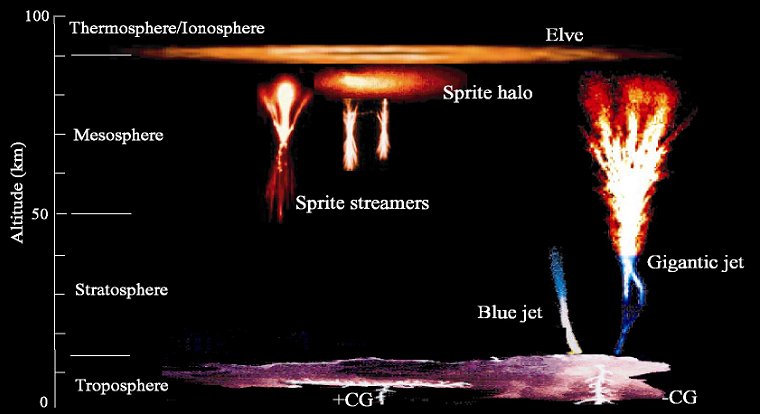
Here's a pretty good figure summarizing the various types
of luminous event (source:
http://smsc.cnes.fr/TARANIS/GP_science.htm;
CNES is the French Centre National d'Etudes Spatiales
)
Sprites
The following figure is adapted from a review
article by C.J.
Rodger (1999) and shows some of the forms sprites
may take:
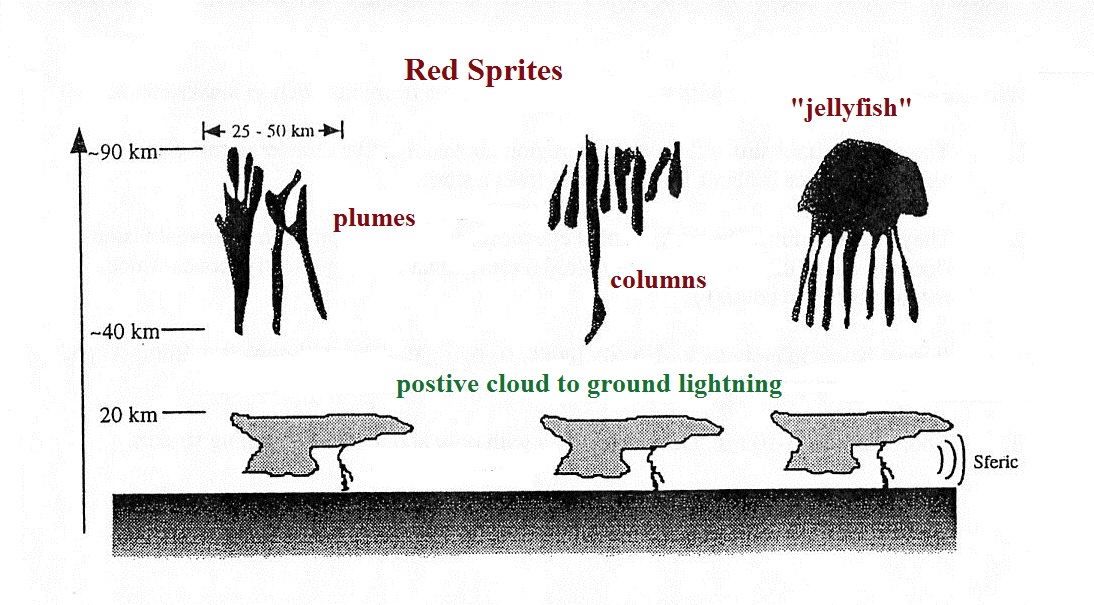
And some general characteristics of red
sprites (from the Rodger, 1999, paper cited above).
Sprites seem to follow positive cloud to ground
discharges.
Color
|
red
|
Minimum altitude
|
50 km (tendrils < 40 km)
|
Maximum altitude
|
90 km
|
Width (km)
|
25 - 50 km (columns >2 km)
|
Duration
|
5 - 300 ms
|
Association with lightning
|
positive cloud-to-ground (ELF slow
tail)
|
Occurrence rate
|
1 in 40 to 1 in 2.3
|
Sprites are dim and hard to see with the naked eye
(adapted from http://elf.gi.alaska.edu/#intro
)
To see a sprite you need an unobstructed view of the region
above an active thunderstorm. The best viewing distance
is about 100 - 200 miles from a storm.
The dark adapted eye most readily sees sprites in parfoveal
vision (looking out the corner of your eye (rods) rather than
looking directly at the sprite (cones which respond better to
colors).
It must be very dark, no city light, no twilight.
Cloud illumination from lightning activity may be too bright
or may be distracting.
Sprites are very brief (3-10 ms usually). They are
produced by only about 1% of lightning strokes.
Sprite videos:
sprite
movie (Univ. AK, Geophys. Inst.)
sprite in
slow motion (H.H.C. Stenbaek-Nielsen, U. Alaska
Fairbanks, DARPA, NSF)
sprite
movie high speed video (NM Tech)
sprite
movie high speed video (NM Tech)
here
are some spectacular pictures and videos (not sure
how to cite this page)
Some of my favorite pictures are still images
(especially ones that include the foreground and
surroundings)
Mike
Hollingshead (Astronomy Picture of the Day)
Sprite with
Aurora (Walter Lyons and an Astronomy Picture of the
Day)
A hard to
spot sprite viewed from the International Space Station
(ISS Expedition 31 crew, NASA)
sprite
(National Geographic) (click here
if the link is slow to respond)
sprite
(Geospace Physics Laboratory, Florida Inst. of Tech.)
sprite
(WDRB.com)
sprite
(Weatherscapes)
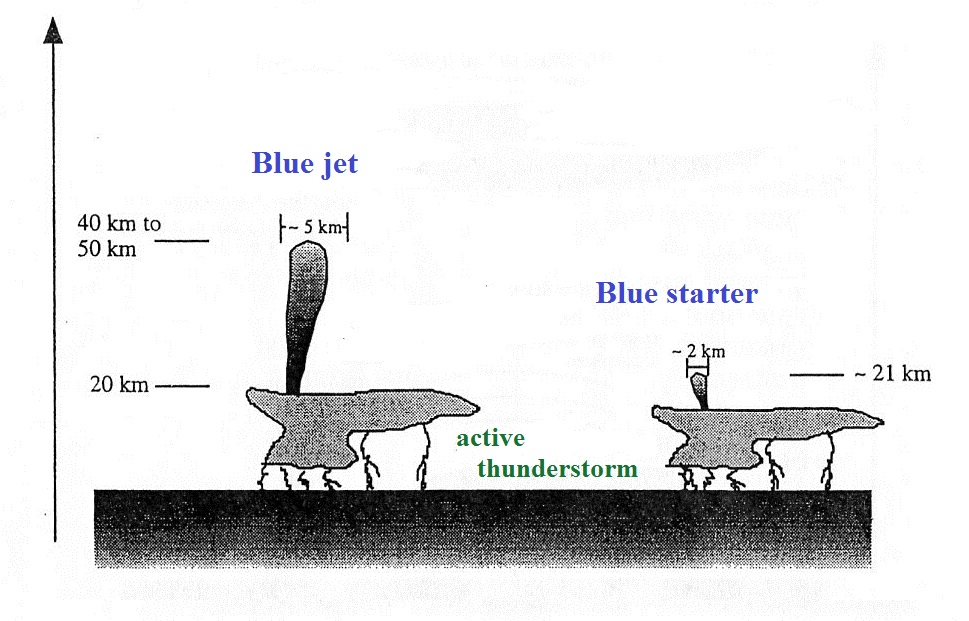
Blue jets
These begin and extend upward from the tops of
thunderstorms. Characteristics of blue jets and blue
starters are shown below (from Rodger 1999).
It is still not clear what produces blue jets, they do not
necessarily follow directly after a lightning discharge.
The propagate upward at about 1 x 10⁵ m/s.
The deep blue color, which is more readily scattered by air,
makes them difficult to see and photograph. Some
characteristics of blue jets are shown below (from Rodger,
1999)
Color
|
deep blue
|
Minimum altitude
|
about 20 km
|
Maximum altitude
|
40 to 50 km
|
Width (km)
|
about 3 km (cone about 15 degrees)
|
Duration
|
about 250 ms
|
Occurrence rate
|
2.8 per minute (in 22 min.)
|
blue jet videos
blue
jet movie (Univ. AK, Geophys. Inst.)
still photographs
blue
jet (PBS Nova)
Stanford
University photograph (this might be an example of a
giant blue jet)
blue
jet photographed above a thunderstorm in the Northern
Territory, Australia (Thijs Bors published in The Telegraph)
blue
jet on St. Barth (credit: Elka Liot, Muskapix Gregory
Moulard. "St. Barth" refers to Saint Barthelemy a French
Overseas Collectivite Territoriale in the
Carribean. Together with Saint Martin, Guadeloupe, and
Martinique it is part of the French West Indies)
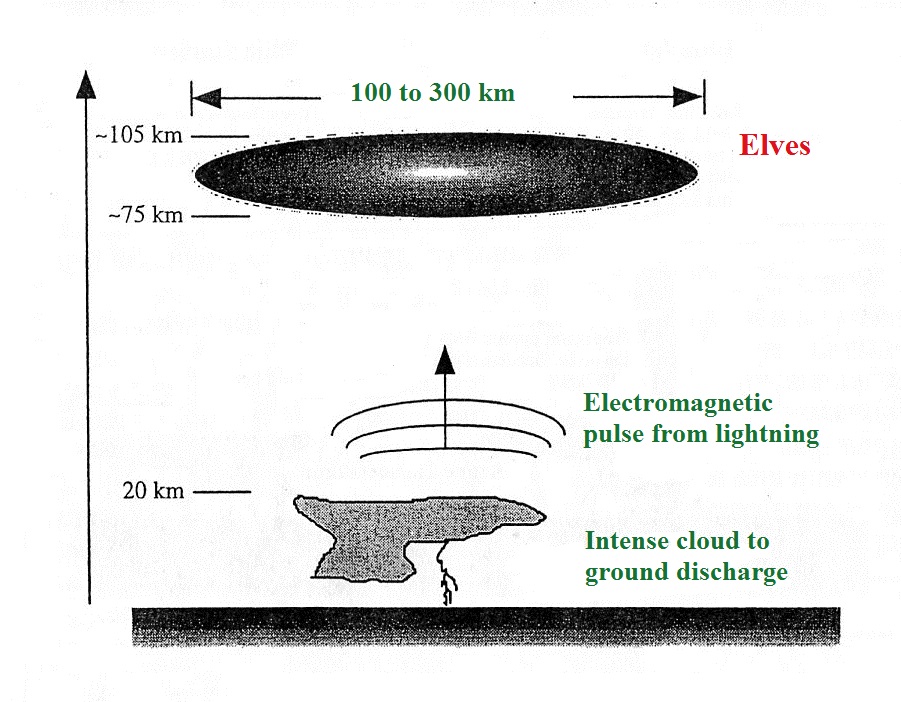
Elves
The name is an acronym for Emission of
Light and Very Low Frequency
Perturbations Due to Electromagnetic Pulse
Sources.
Color
|
. . .
|
Minimum altitude
|
75 km
|
Maximum altitude
|
105 km
|
Width (km)
|
100 - 300 km
|
Duration
|
< 1 ms
|
Association with lightning
|
intense positive cloud-to-ground
(average 148 kA)
|
Occurrence rate
|
. . .
|
Videos of Elves
Blue
jets, Sprites, and Elves (New Scientist video)
Production
of X-rays and γ-rays by lightning
This section needs some updating
Moore
et al. (2001) have reported observing bursts of high
energy radiation associated produced in a 1 to 2 ms
interval just before the start of the return stroke and as
the stepped leader was nearing the ground. Dwyer
et al. (2003) observed bursts of energetic radiation
in the last 160 μs of the dart leader and possibly right
at the start of the return stroke in 31 out of 37
triggered events studied. The shorter interval may
be because dart leaders have a higher propagation
speed. My understanding is that the
sensors used in both these two experiments were unable
to distinguish between energetic electrons, X-rays,
and gamma rays.
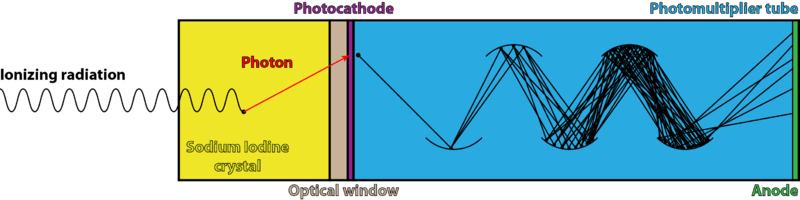
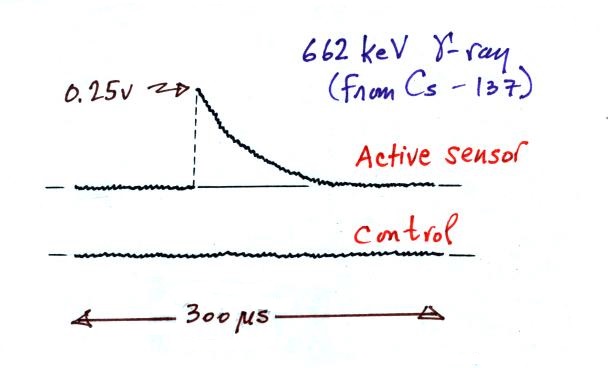
A NaI (sodium iodide) scintillation detector was used
in both experiments. Light is emitted when the
high-energy radiation strikes the NaI. The weak
light signal is then detected and converted into an
electrical current using a photomultiplier tube (source of
the figure below)
The exponential decay following the peak is the response of
the preamplifier circuit.
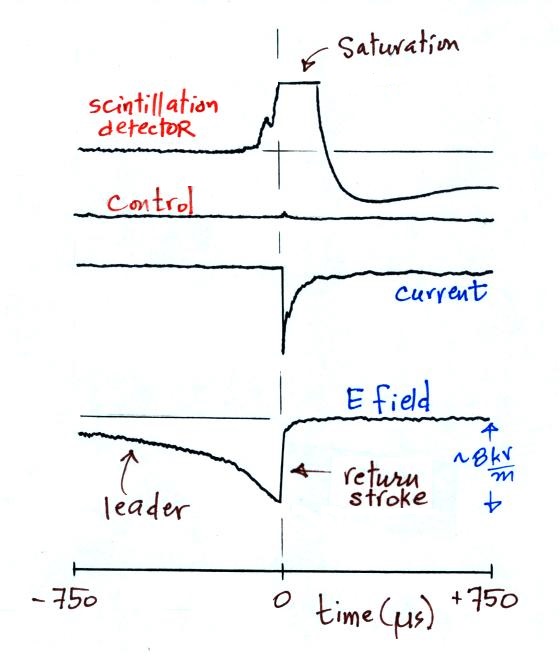
The figure below is a sketch of high energy radiation produced
by a triggered lightning discharge from the Dwyer et al.
(2003) paper.
The output of the scintillation detector is shown at
top. This signal began 160 μs before the
start of the return stroke (the return stroke began at time 0
in the figure). The complex signal shape during the rise
to peak indicates that several energetic particles were
detected. A very small pulse is just visible on the
control signal trace and may have been caused by energetic
particles directly striking the photocathode of the
photomuliplier tube. The return stroke current was
measured at the strike point and rose to a peak value of about
22.5 kA. The electric field was measured at a point 260
m away from the strike point and has the characteristic
asymmetric V-shape described by Rubenstein
et al. (1995) for the leader-return stroke transition
observed at close range.
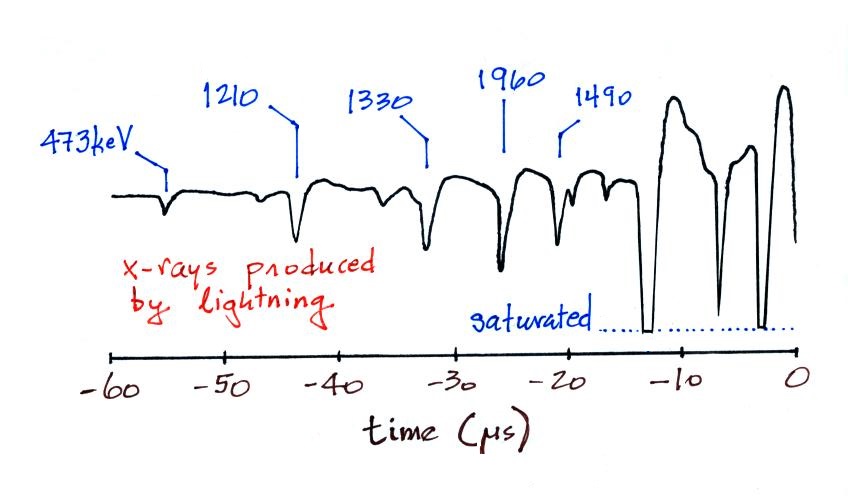
An improved sensor was used during the summer 2003
campaign and Dwyer
et al. (2004) report X-rays were measured 0 to 80 μs
prior to and at the beginning of 73% of triggered return
strokes studied. Each X-ray burst usually lasted less
than 1 μs. The most intense bursts come from parts of
the channel that is within 50 m of the ground. A sketch
of one of the recorded signals is shown below. The
return stroke began at time t=0.
Energies for most of the x-rays that were detected are shown
in the publication, some of the values are included in the
sketch above (in keV). Note how the
amplitudes of the x-rays in this and the next figure
increase as the leader (a dart leader in this case) nears
the ground.
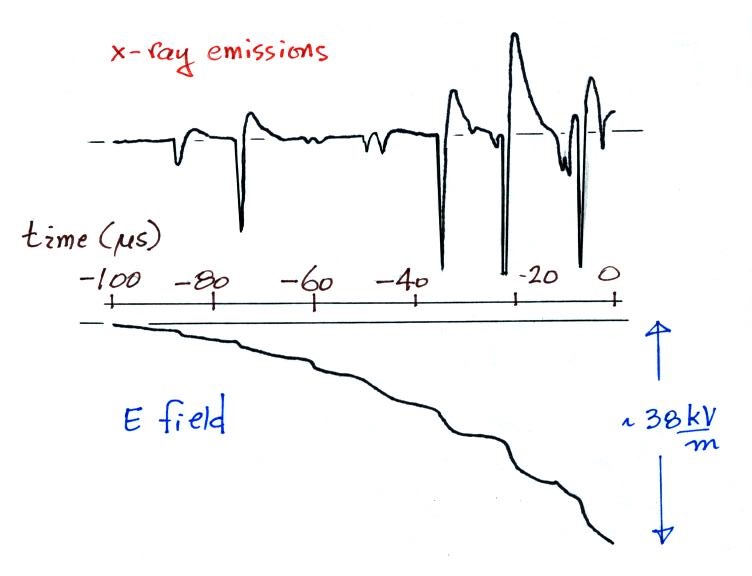
Dwyer
et al. (2005) has measured X-ray emissions coming from
the stepped leader process in natural cloud to ground
discharges. The last 11 steps of the stepped leader
are shown in the sketch below (the start of the return
stroke is at time = 0).
The lightning struck about 50 m from the electric field
derivative antenna (the E field signal above is an integration
of the measured dE/dt signal) and about 260 m from the x-ray
detector.
It seems clear that the x-rays are produced during the
stepping process. Because of the similarity
between x-rays produced by dart leaders in triggered lightning
and stepped leaders in natural lightning Dwyer et al. (2005)
suggests that the production mechanisms are similar and that
dart leaders also step, but with a frequency that isn't
resolved on optical or field records.
Implications
Emissions from dart leaders in triggered lightning and
stepped leaders in natural lightning are similar. This
suggests some similarities in the discharge process (dart
leaders may actually step)
Observations may provide some clues about leader propagation
processes.
The standard "relativistic runaway electron avalanche model"
might have some trouble trying to explain the lightning
generated X-ray emissions.
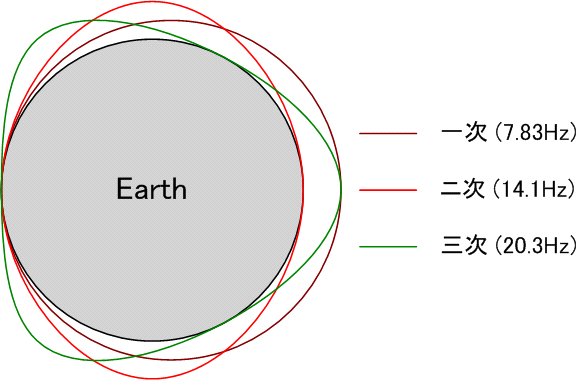
Schumann resonance
Lightning signals excite the earth - ionosphere
cavity. Resonant frequencies are amplified.
|
|
source of the image above
|
source of the plot above
|