Mon., Mar. 24, 2014
"Evil"
from a new group Phox that I learned about over Spring Break was
featured before class today. Discoveries like this are
purely random. In the case of Phox, I first read about them
in an
article on Salon.com. Here's another song
of theirs "Noble
Heart". Both songs were recorded by
Audiotree Music, they've done the same with many other groups and
artists that you can find listed here. I am going
to have to methodically work my way through every one of
them.
I was able to catch up with the grading over Spring
Break. Quiz #2, the latest 1S1P reports & Optional
Assignments, and the revised Expt. #1 reports were returned today
together with up to date grade summaries. More about the
grade summaries at the end of today's notes.
The Experiment #2 revised reports are due Friday this week (Mar.
28). Please return your original report with your revised
report. The Experiment #3 reports are due next Monday, Mar.
31 (unless noted otherwise here).
That means you should try to collect your data this week so that
you can return the materials and pick up the supplementary
information handout. If you're working on or thinking of
doing a Book Report, Scientific Paper Report, or an Experiment #4
Report, they are all due in 2 weeks, on Monday April 7. That
deadline is to give me time to get the reports graded and returned
to you with enough time for you to turn in a revised report is you
choose to.
You'll find mention of an In-class Optional Assignment further on
in today's notes.
Now, as is the custom after a quiz, we'll start a new
bunch of material. Here's an introduction to the first part
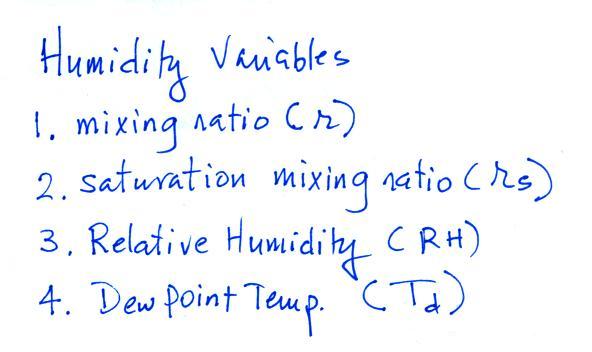
of that: humidity (moisture in the air). This topic and the
terms that we will be learning are probably new and might be
confusing. That's the reason for this introduction. We
will be mainly be interested in 4 variables:
Your task will be to learn the "jobs" of these
variables, what they're good for, units, and what can cause them
to change value.
The bottom half of the figure below can be found on p. 83 in
the ClassNotes.
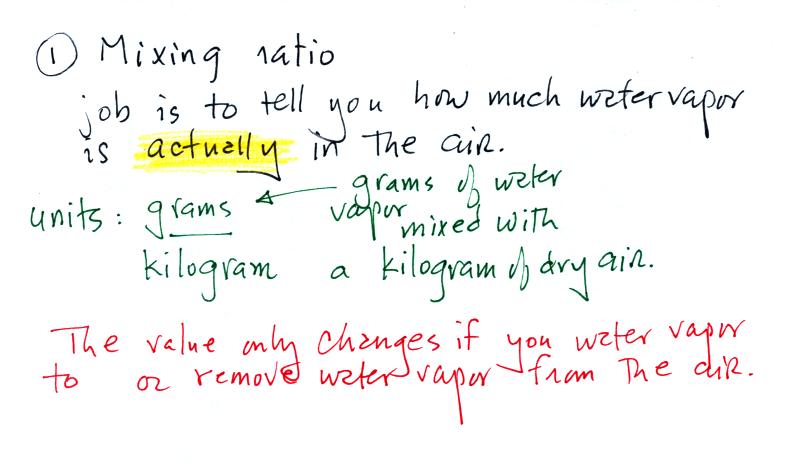
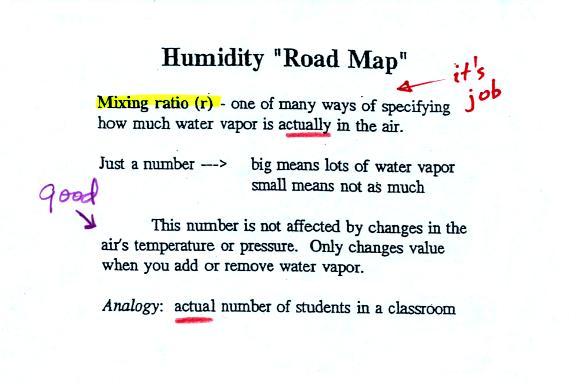
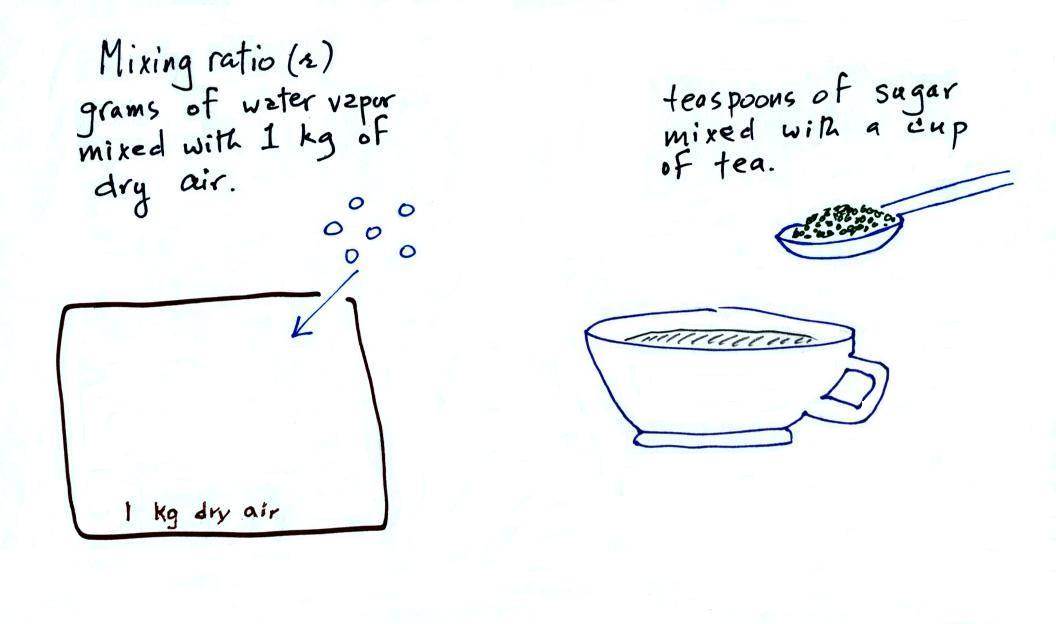
Mixing ratio tells you how much water vapor is actually
in the air. You can think of it as just a number: when the
value is large there's more water vapor in the air than when the
value is small. Here's a case where units are
helpful. Mixing ratio has units of grams of water vapor per
kilogram of dry air (the amount of water vapor in grams mixed with
a kilogram of dry air). A kilogram of air is about one cubic
meter of air (about one cubic yard of air).
Mixing ratio is basically the same
idea as teaspoons of sugar mixed in a cup of tea.
The value of the mixing
ratio won't change unless you add water vapor to or remove
water vapor from the air. Warming the air won't change
the mixing ratio. Cooling the air won't change the
mixing ratio (with
one exception - when the air is cooled below its
dew point temperature and water vapor starts to
condense). This is a property we'll make use of when
we do some example problems in class on Wednesday.
Since the mixing ratio's job is to tell you how much water
vapor is in the air, you don't want it to change unless
water vapor is actually added to or removed from the air.
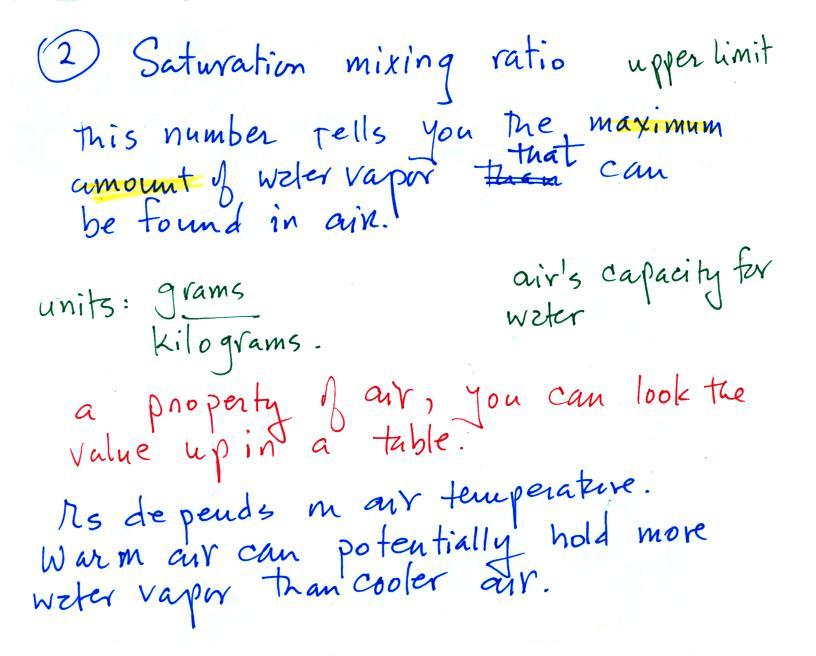
There is an upper limit to the amount of moisture that
can be found in air. The next variable, the saturation
mixing ratio, tells you what that limit is.
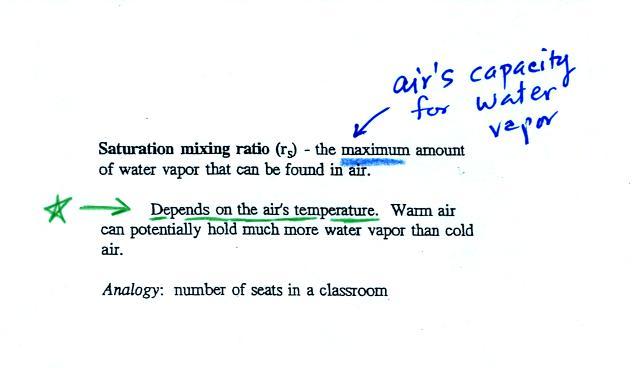
Saturation mixing ratio is just an upper
limit to how much water vapor can be found in air,
the air's capacity for water vapor.
It's a property of air and depends on the air's temperature;
warm air can potentially hold
more water vapor than cold air. It doesn't
say anything about how much water vapor is actually in the
air (that's the mixing ratio's job). This
variable has the same units: grams of water vapor per
kilogram of dry air. Saturation mixing ratio values
for different air temperatures are listed and graphed on p.
86 in the ClassNotes.
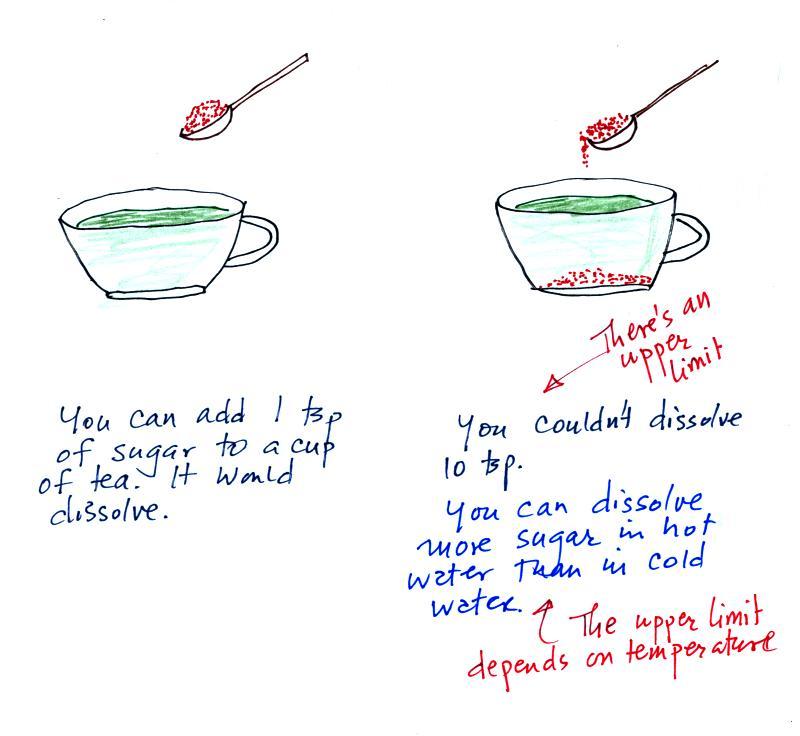
The sugar dissolved in tea analogy is still helpful.
Just as is the case with water vapor in air, there's a limit
to how much sugar can be dissolved in a cup of hot
water. And not only that, the amount depends on
temperature: you can dissolve more sugar in hot water than in cold
water.
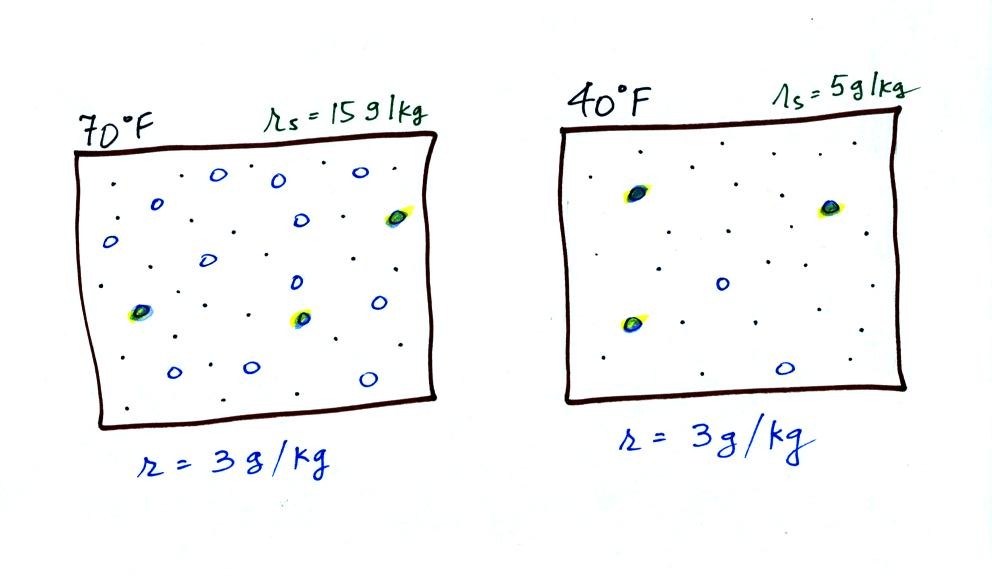
The dependence of saturation mixing ratio on air
temperature is illustrated below:
The small specks represent all
of the gases in air except for the water vapor. Each of
the open circles represents 1 gram of water vapor
that the air could potentially hold. There are 15 open
circles drawn in the 1 kg of 70 F air; each 1 kg of 70 F air
could hold up to 15 grams of water vapor. The 40 F air
only has 5 open circles; this cooler air can only
hold up to 5 grams of water vapor per kilogram of dry air.
The numbers 15 and 5 came from the table on p. 86.
Now we have gone and actually put some water vapor into the
volumes of 70 F and 40 F air (the open circles are colored
in). The same amount, 3 grams of water vapor, has been added
to each volume of air. Three of the open circles have been
colored in. The mixing ratio, r, is 3 g/kg in both cases.
It was at about this point that an In-class
Optional Assignment was handed out. The assignment was
collected at the end of class. If you weren't in class you
can earn at least partial credit by downloading the assignment and
turning it in at the start of class on Wednesday.
After looking at the figure above you might start to guess at what
relative humidity might mean.
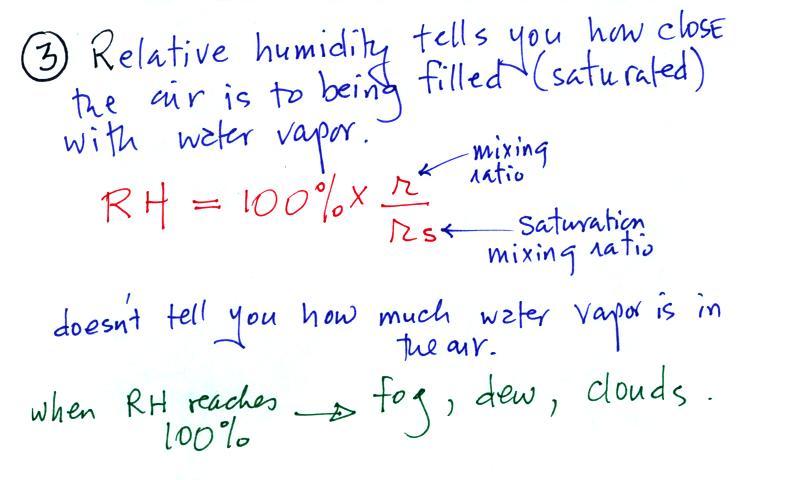
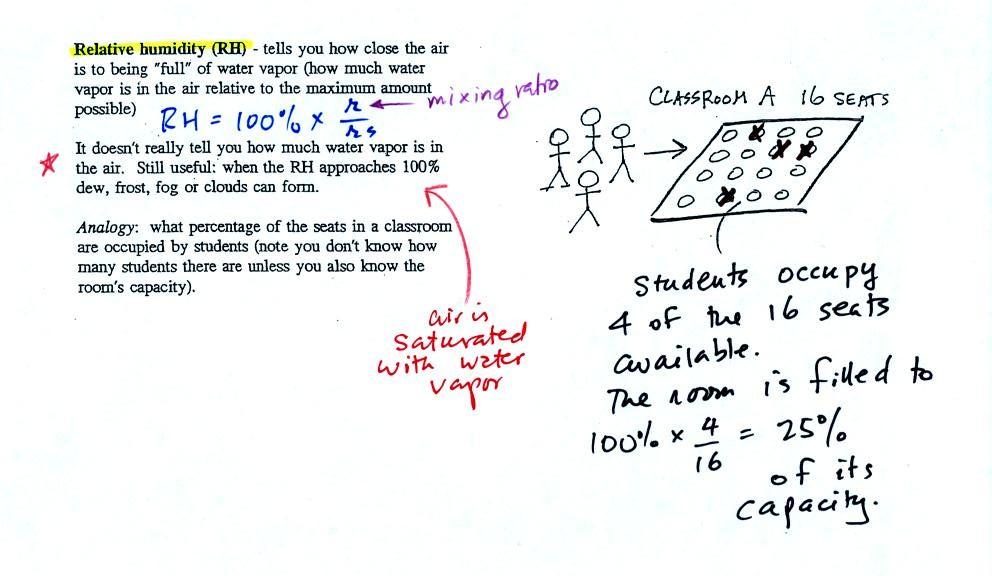
The relative humidity is the
variable most people are familiar with. It tells you how
"full" the air is with water vapor, how close it is to
being filled to capacity with water vapor, how
close the air is to being "saturated" with water vapor.
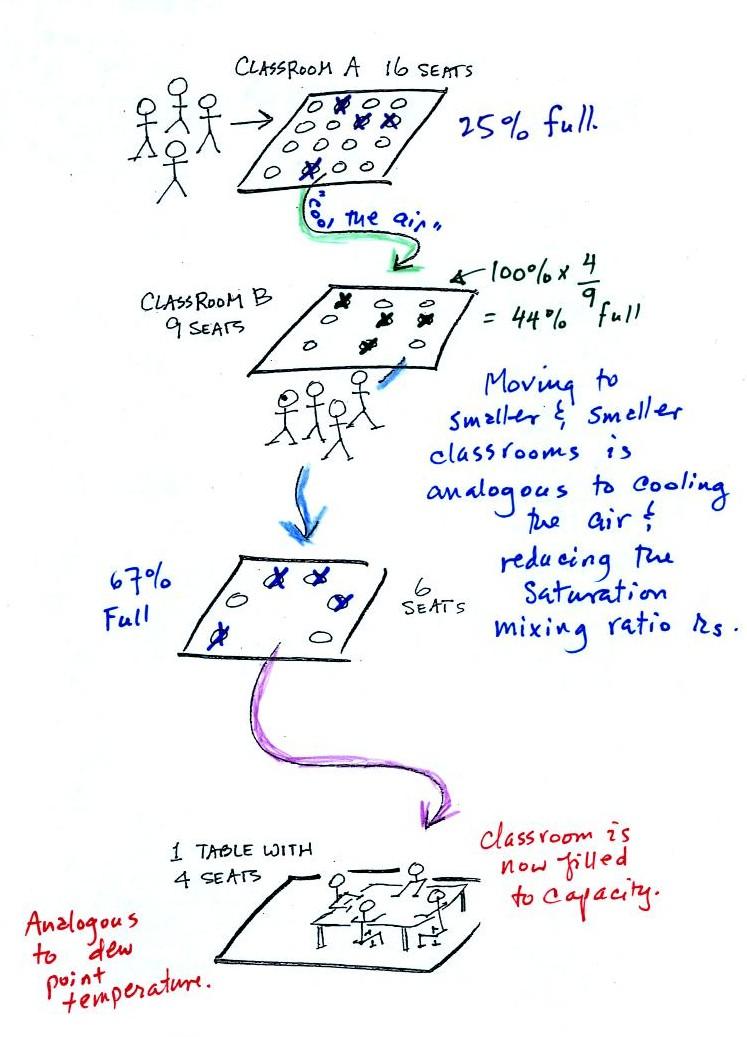
In the analogy (sketched on the right hand side of p. 83 in
the photocopied notes) 4 students wander into Classroom A
which has 16 empty seats. Classroom A is
filled to 25% of its capacity. You can think
of 4, the actual number of students, as being analogous to the
mixing ratio. The classroom capacity is analogous to the
saturation mixing ratio. How full the room is is
analogous to the relative humidity.
The figure below goes back to the volumes (1 kg each) of 70
F and 40 F air that could potentially hold 15 grams or 5 grams
of water vapor.
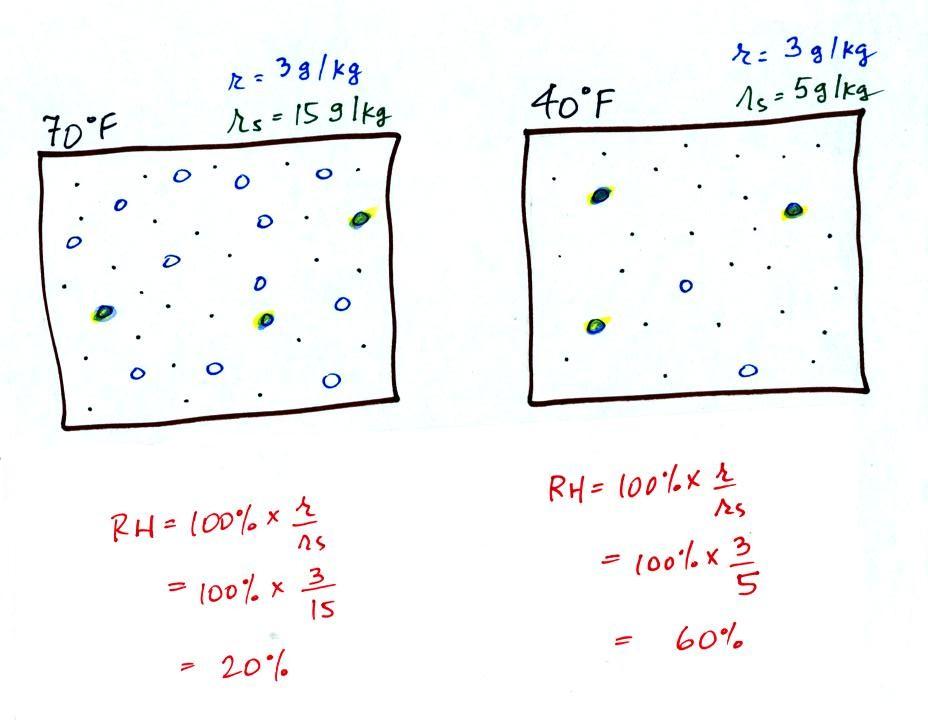
Something important to note: RH
doesn't really tell you how much water vapor is actually in the
air. The two volumes of air above contain the same
amount of water vapor (3 grams per kilogram) but have very
different values of relative humidity. You could just as
easily have two volumes of air with the same relative humidity but
different actual amounts of water vapor.
What is the RH good for if it doesn't tell you how much moisture
is in the air? When the RH reaches 100% dew, fog, and clouds
form. RH tells you whether clouds or fog are about to form
or not.
|
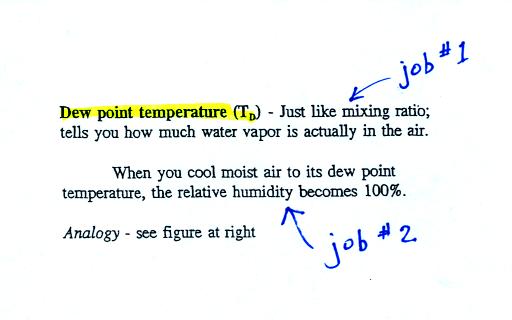 |
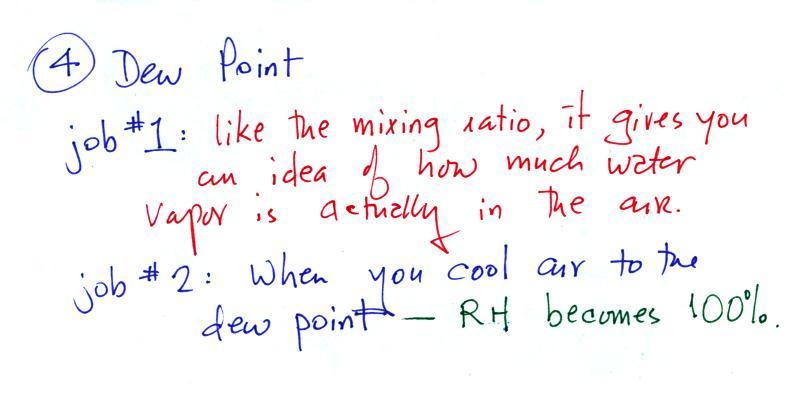
The dew point temperature has two jobs. First it
gives you an idea of the actual
amount of water vapor in the air. In this respect
it is just like the mixing ratio. If the dew point
temperature is low the air doesn't contain much water vapor.
If it is high the air contains more water vapor. This is
something we learned early in the semester. On Wednesday
we'll find that if you know the mixing ratio you can quickly
figure out the dew point temperature (and vice versa).
Second the dew point tells you
how much you must cool the air in order to cause the RH to
increase to 100% (at which point a cloud, or dew or
frost, or fog would form). This idea of cooling the air
until the RH increases to 100% is important and is something we
will use a lot.
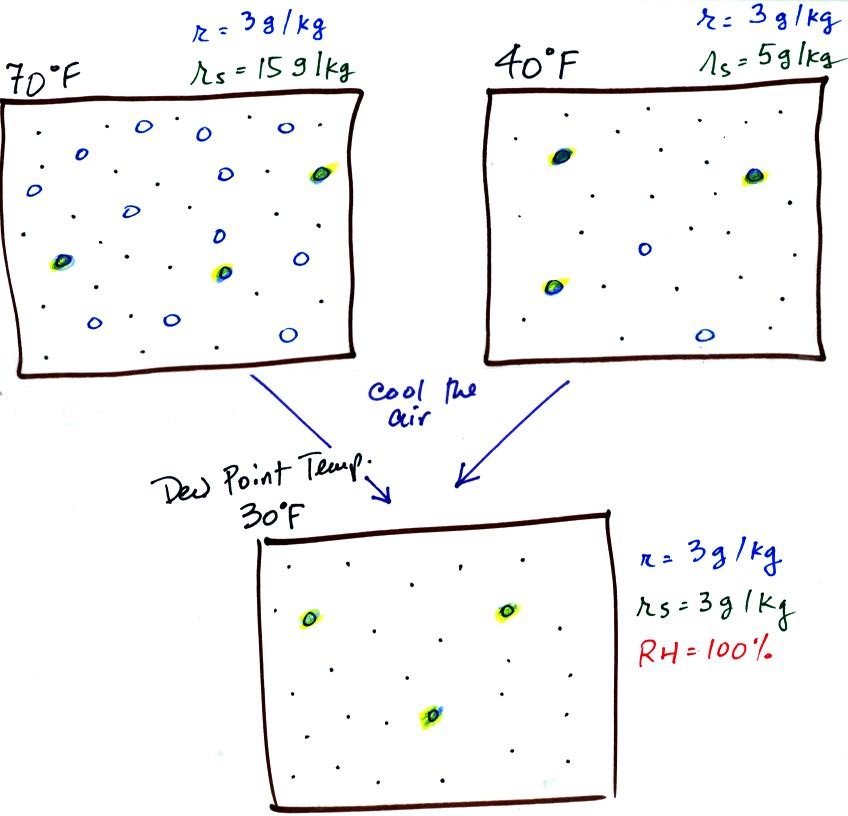
If we cool the 70 F air or the 40 F air to 30 F we would find
that the saturation mixing ratio would decrease to 3
grams/kilogram. Since the air actually contains 3 g/kg,
the RH of the 30 F air would become 100%. The 30 F air
would be saturated, it would be filled to capacity with water
vapor. 30 F is the dew point temperature for 70 F air
that contains 3 grams of water vapor per kilogram of dry
air. It is also the dew point temperature for 40 F air
that contains 3 grams of water vapor per kilogram of dry air.
Because both volumes of air had the same amount of
water vapor, they both also
have the same dew point temperature.
Now back to the
student/classroom analogy
The 4 students move into classrooms of smaller and smaller
capacity. The decreasing capacity of the classrooms is
analogous to the decrease in saturation mixing ratio that occurs
when you cool air. Eventually the students move into a
classroom that they just fill to capacity. This is
analogous to cooling the air to the dew point.
Once you become a little bit more familiar with these humidity
variables and after we do some example problems on Wednesday you
should be able to produce a charge like this.
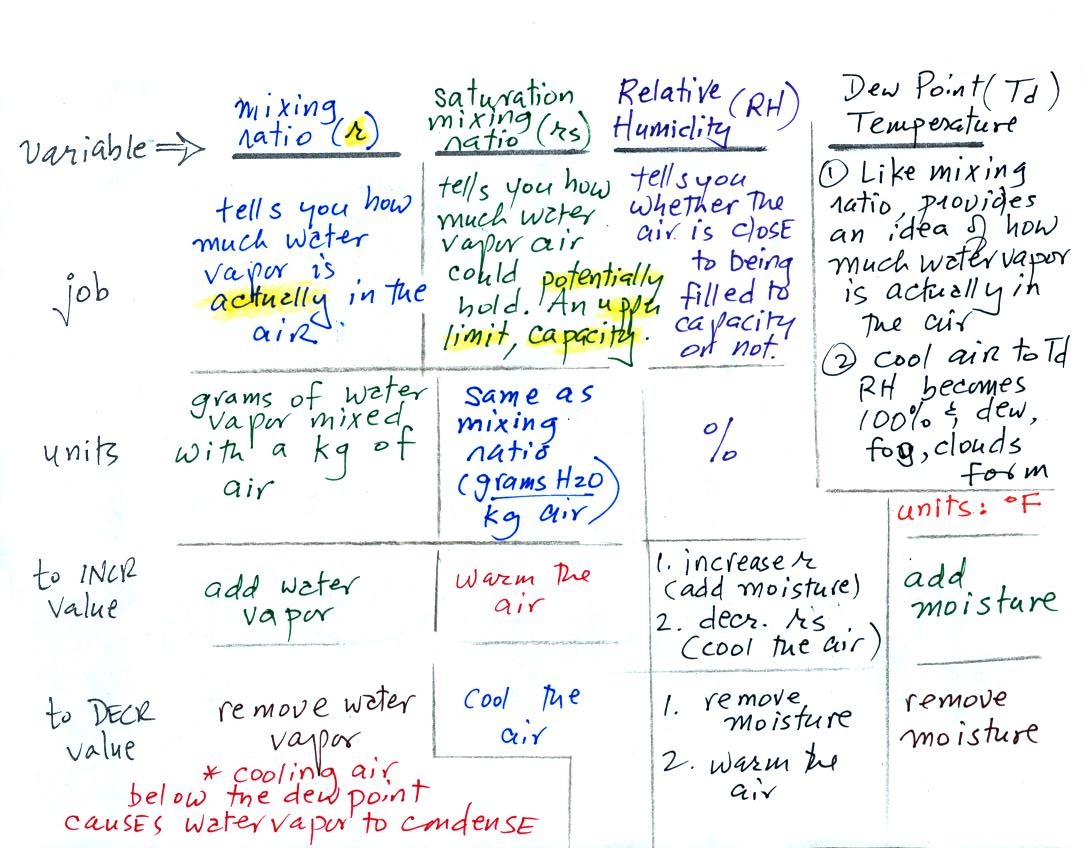
At that point you should be able to say
what the job of each of the four humidity variables is and
also give the units of each of the variables.
A brief detour at this point to have a look at the grade
summary printouts. A color coded example is shown below
(values shown are class averages)
|
Doe_J
quiz1 -44 (175 pts
possible) 74.9%
quiz2 -48 (150 pts possible) 68.0%
1.9 EC points (2.15 pts
possible)
writing scores: 0.0 (expt/book
report) + 19 (1S1P pts (average is 19))
writing percentage grade estimate: 94.7%
average (no quiz
scores dropped): 76.1% + 1.00 = 77.1%
average (lowest quiz score dropped):
79.8% + 1.0 = 80.8%
*
because you haven't completed the experiment or book
report
yet (or your report hasn't been graded yet) an
average score was
used to compute your writing grade.
|
Your grades on the two quizzes are shown first in dark green (I didn't record your
score on the Practice Quiz and it isn't shown). There are
two more quizzes this semester.
Next in dark brown are the number of
extra credit points you have earned from turning in Optional
Assignments. It is possible to have earned 2.15 pts at
this point, a handful of students have. By the end
of the semester you will have had an opportunity to have earned
at least 3 pts of extra credit (perhaps a little more than
that).
Your score on either an Expt. #1, Expt. #2 or a book report is
shown next in purple.
Many students haven't yet turned in a report. They'll find
a 0 listed here and the short message at the bottom of their
grade summary saying that an average score was used by the
computer to provide a reasonable estimate of their writing
grade. The report score is followed by the total number of
1S1P points you have earned (the class average is 16 which is on
target to earn 45 pts by the end of the semester). The
report points and the 1S1P points are added and a writing
percentage grade is computed. The computer has taken into
account the fact that most students haven't earned 45 1S1P
points at this point in the semester. By the end of the
semester if you have a decent experiment report score and 45
1S1P pts the writing percentage grade should be close to, maybe
a little over, 100%. It is important to understand
that the writing grade shown on your grade summary is not
"locked in." If you stop writing 1S1P reports your writing
grade will drop by the end of the semester. So keep
writing 1S1P reports until you have reached the 45 pt maximum
number of 1S1P pts allowed.
Finally the quiz scores and the writing percentage grade are
themselves averaged, the extra credit is added on and your
overall grade is shown in this reddish
color. No quiz scores have been dropped in
the first average. This is the average that has to be
90.0% or above on the last day of classes in order to get out of
the Final Exam. If you do have to take the Final Exam, the
second average (with your lowest quiz score dropped) will be
used together with your Final Exam score to determine your
overall grade.
Another important point to keep in mind. The grade
estimate attempts to determine what you will end up with at the
end of the semester if you keep doing like you have done up
to this point. With two quizzes left and more
writing still to do there is time for significant
improvement. It is also possible for your grade to drop
between now and the end of classes if you stop performing as you
have been.
I'll try to handout
another grade summary following Quiz #3 and a 3rd grade summary
for sure after Quiz #4 so students will know whether they need
to take the Final Exam or not.
NOTE: Please check to
be sure the grades listed on your summary are correct. And,
as far as graded work is concerned, we're at about the 60%
point. There is still time to earn a lot of 1S1P points and
there are two quizzes left to take. So your grade can change
significantly between now and the last day of classes.